
Prometheus 监控Mysql服务器及Grafana可视化
Prometheus 监控Mysql服务器及Grafana可视化、
mysql_exporter:用于收集MySQL性能信息。
- 使用版本
- mysqld_exporter 0.11.0
- 官方地址
- 使用文档:https://github.com/prometheus/mysqld_exporter
- 图标模板:https://grafana.com/dashboards/7362
- 下载地址:https://github.com/prometheus/mysqld_exporter/releases/download/v0.12.1/mysqld_exporter-0.12.1.linux-amd64.tar.gz
- 百度云:mysqld_exporter 0.11.0
- 下载地址:https://pan.baidu.com/s/1JfjbK3uOMXObc7-F8h13Dw
- 密码:dxsn
注:要求数据库mysql 5.5 以上版本。
安装mysql_exporter
1、下载到被监控端解压压缩包
tar zxvf mysqld_exporter-0.11.0.linux-amd64.tar.gz
2、改名并移动到指定目录
mv mysqld_exporter-0.11.0.linux-amd64 /usr/local/mysql_exporter

cd /usr/local/mysql_exporter
3、登录mysql为exporter创建账号并授权
# 创建数据库用户。

mysql> CREATE USER 'exporter'@'localhost' IDENTIFIED BY 'XXXXXXXX';
# 可查看主从运行情况查看线程,及所有数据库。

mysql> GRANT PROCESS, REPLICATION CLIENT, SELECT ON *.* TO 'exporter'@'localhost';
4、创建mysql配置文件、运行时可免密码连接数据库:vim /usr/local/mysql_exporter/.my.cnf
[client]

user=exporter

password=xiangsikai
5、启动exporter客户端
./mysqld_exporter --config.my-cnf=.my.cnf
常用参数:

# 选择采集innodb

--collect.info_schema.innodb_cmp

# innodb存储引擎状态

--collect.engine_innodb_status

# 指定配置文件

--config.my-cnf=".my.cnf"
启动常用参数
6、添加系统服务:vi /usr/lib/systemd/system/mysql_exporter.service
[Unit]

Description=https://prometheus.io

[Service]

Restart=on-failureExecStart=/usr/local/mysql_exporter/mysqld_exporter --config.my-cnf=.my.cnf

[Install]

WantedBy=multi-user.target
7、启动添加后的系统服务
systemctl daemon-reload

systemctl restart mysql_exporter.service
8、网站查看捕获mysql数据
访问:http://47.98.138.176:9104/metrics

9、使用prometheus监控修改监控端配置文件:vim prometheus.yml
scrape_configs:

  # 添加作业并命名

  - job_name: 'mysql'

    # 静态添加node

    static_configs:

    # 指定监控端

    - targets: ['47.98.138.176:9104']
10、检查并重启服务
./promtool check config prometheus.yml

kill -hup 5997
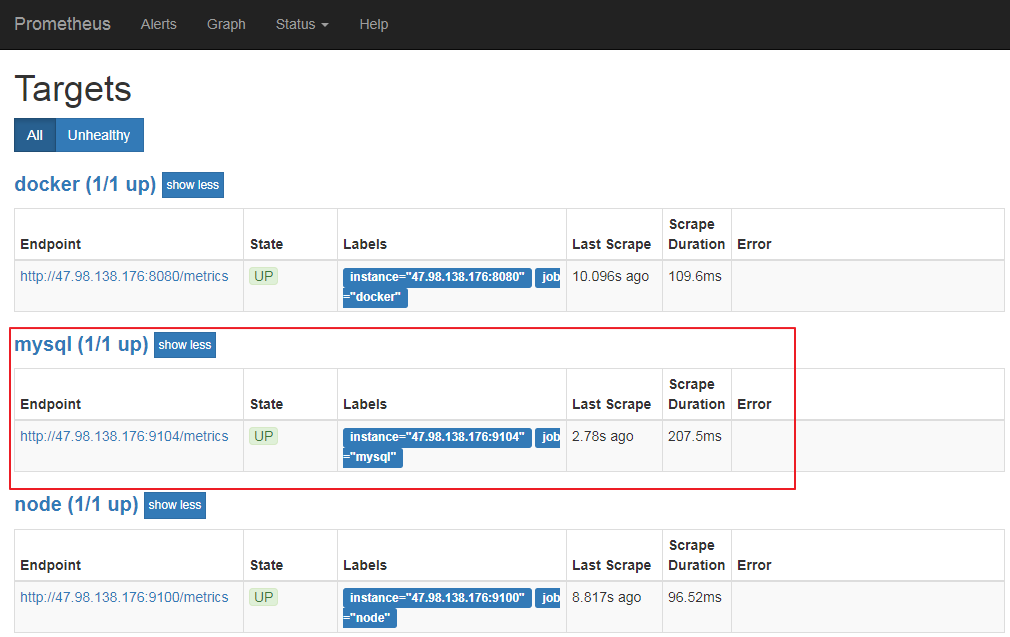
11、查看监控端是否介入
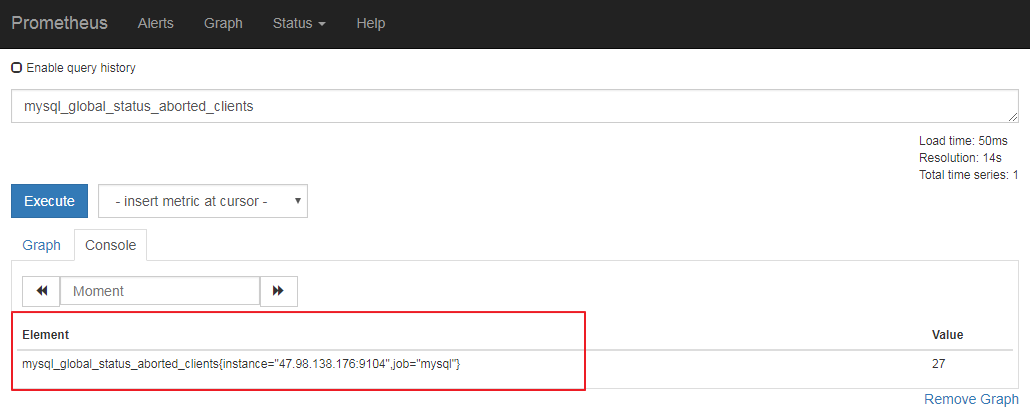
12、使用promSQL查看mysql监控信息
# 测试查看mysqlglobal状态信息

mysql_global_status_aborted_clients
PromSQL
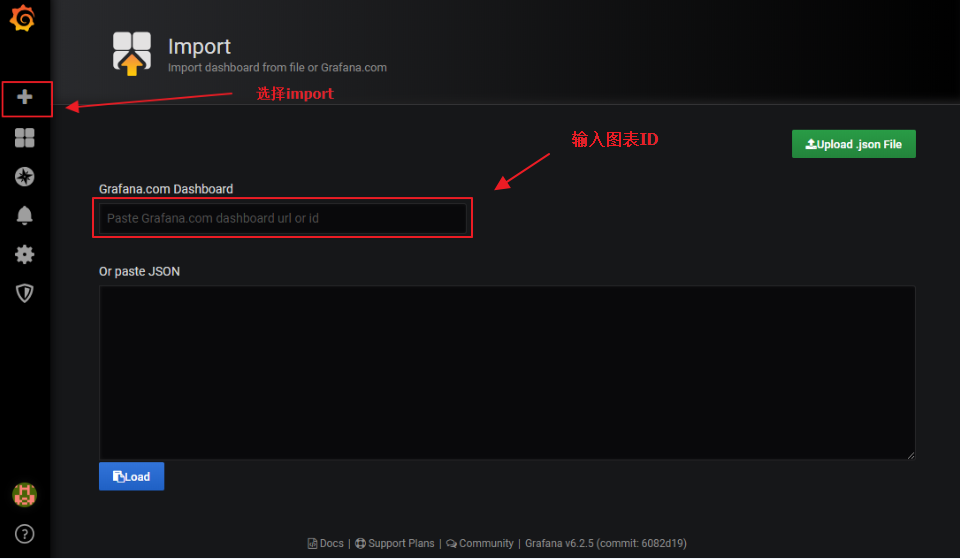
13、Granfana 导入Mysql 监控图表
- 推荐图标ID:https://grafana.com/dashboards/7362
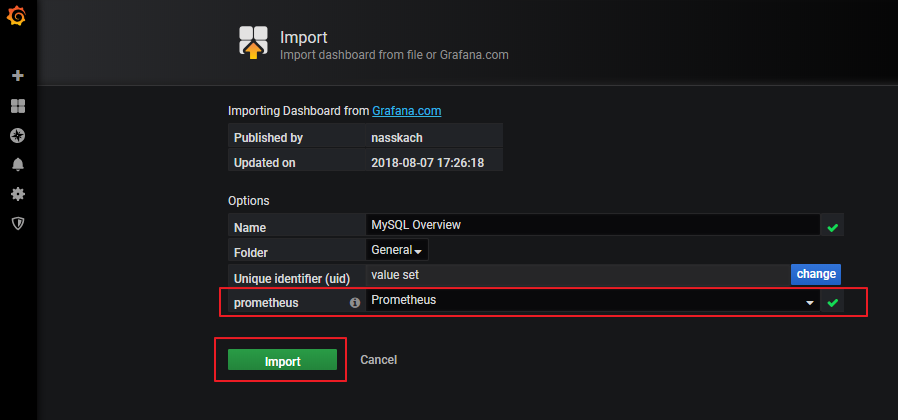
14、输入导入图标ID等待3秒弹出如下,修改后保存
15、监控展示

Prometheus 监控Mysql服务器及Grafana可视化的更多相关文章
- Prometheus 监控Docker服务器及Granfanna可视化
Prometheus 监控Docker服务器及Granfanna可视化 cAdvisor(Container Advisor)用于收集正在运行的容器资源使用和性能信息. 使用Prometheus监控c ...
- Grafana+Prometheus 监控 MySQL
转自:Grafana+Prometheus 监控 MySQL 架构图 环境 IP 环境 需装软件 192.168.0.237 mysql-5.7.20 node_exporter-0.15.2.lin ...
- 详解 Spotlight on MySQL监控MySQL服务器
前一章详解了Spotlight on Unix 监控Linux服务器 ,今天再来看看Spotlight on MySQL怎么监控MySQL服务器. 注:http://www.cnblogs.com/J ...
- Prometheus 监控linux服务器
Prometheus 监控linux服务器 node_exporter:用于*NIX系统监控,使用Go语言编写的收集器. 使用版本 node_exporter 0.17.0 相关文档 使用文档:htt ...
- Grafana+Prometheus监控mysql性能
#cmd /usr/local 今天讲一下如何监控服务器中的mysql数据库的性能 一.数据库操作 1.mysql启动 #service mysqld start #启动数据库 #service my ...
- 使用 Docker 部署 Grafana + Prometheus 监控 MySQL 数据库
一.背景 在平时开发过程当中需要针对 MySQL 数据库进行监控,这里我们可以使用 Grafana 和 Prometheus 来实现监控功能.Grafana 是一款功能强大的仪表盘面板,支持多种数据源 ...
- 采用prometheus 监控mysql
1. prometheus 是什么 开源的系统监控和报警工具,监控项目的流量.内存量.负载量等实时数据. 它通过直接或短时jobs中介收集监控数据,在本地存储所有收集到的数据,并且通过定义好的rule ...
- Grafan+Prometheus 监控 MySQL
架构图 环境 IP 环境 需装软件 192.168.0.237 mysql-5.7.20 node_exporter-0.15.2.linux-amd64.tar.gz mysqld_exporter ...
- Prometheus 监控MySQL
目录 0.简介 1.mysql_exporter部署 2.mysql报警规则 0.简介 文中主要监控MySQL/MySQL主从信息 版本:mysql-5.7,mysql_exporter-0.12.1 ...
随机推荐
- C#.net模拟提交表单POST
方法一.System.Net.WebClient WebClientObj = new System.Net.WebClient(); System.Collections.Spec ...
- 12.redis 的并发竞争问题是什么?如何解决这个问题?了解 redis 事务的 CAS 方案吗?
作者:中华石杉 面试题 redis 的并发竞争问题是什么?如何解决这个问题?了解 redis 事务的 CAS 方案吗? 面试官心理分析 这个也是线上非常常见的一个问题,就是多客户端同时并发写一个 ke ...
- EM算法-完整推导
前篇已经对EM过程,举了扔硬币和高斯分布等案例来直观认识了, 目标是参数估计, 分为 E-step 和 M-step, 不断循环, 直到收敛则求出了近似的估计参数, 不多说了, 本篇不说栗子, 直接来 ...
- SQL注入:Cookie注入
什么是Cookie Cookie就是代表你身份的一串字符串,网站根据Cookie来识别你是谁,如果你获取了管理员的Cookie,就表示你可以无需密码直接登陆管理员账号. Cookie注入的原理 在动态 ...
- SQL之单表与多表查询
DML语句使用 source 路径 :把SQL脚本导入到数据库中 查询语句类型:[简单查询|多表查询|子查询] 投影:select 字段名,字段名 from 表名 where ...
- C# 在不同编译下的不同表现
这是我在2018年的时候发在Unity Forums上的帖子, 至今无人回复, 之前是想用TypedReference做DataTable的相关功能的, 可是结果不正确. tiancaiwrk, Oc ...
- IDEA 一键生成所有setter方法(GenerateAllSetter插件)
GenerateAllSetter插件使用效果如下: alt+enter快捷键选择Generate all setter 之后就会自动生成其中的所有setter方法 下面介绍idea安装步骤: alt ...
- echo和printf打印输出
[root@node2 scprits]# echo Hello World! Hello World! [root@node2 scprits]# echo 'Hello World!' Hello ...
- selenium 2定位方式实例
#########百度输入框的定位方式########## #通过id方式定位 browser.find_element_by_id("kw").send_keys("s ...
- win10 配置 hadoop-2.7.2
win10 配置 hadoop-2.7.2 1.下载 先在 http://acrchive.apache.org/dist/hadoop/common/hadoop-2.7.2/hadoop-2.7. ...