Matplotlib中柱状图bar使用
一、函数原型
matplotlib.pyplot.bar(left, height, alpha=1, width=0.8, color=, edgecolor=, label=, lw=3)
1. left:x轴的位置序列,一般采用range函数产生一个序列,但是有时候可以是字符串
2. height:y轴的数值序列,也就是柱形图的高度,一般就是我们需要展示的数据;
3. alpha:透明度,值越小越透明
4. width:为柱形图的宽度,一般这是为0.8即可;
5. color或facecolor:柱形图填充的颜色;
6. edgecolor:图形边缘颜色
7. label:解释每个图像代表的含义,这个参数是为legend()函数做铺垫的,表示该次bar的标签,其中legend()函数loc参数如下:
'best'         : 0, (only implemented for axes legends)(自适应方式)

'upper right'  : 1,

'upper left'   : 2,

'lower left'   : 3,

'lower right'  : 4,

'right'        : 5,

'center left'  : 6,

'center right' : 7,

'lower center' : 8,

'upper center' : 9,

'center'       : 10,
8. linewidth or linewidths or lw:边缘or线的宽
import pandas as pd
import numpy as np
import matplotlib as mpl
mpl.rcParams['font.sans-serif']=['SimHei'] import matplotlib.pyplot as plt
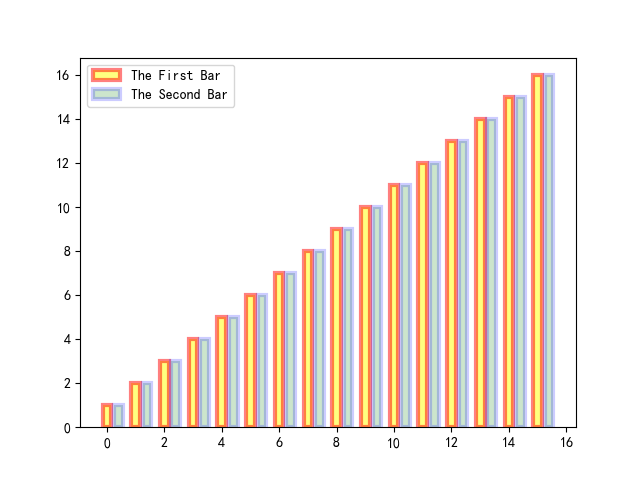
y = range(1,17) plt.bar(np.arange(16), y, alpha=0.5, width=0.3, color='yellow', edgecolor='red', label='The First Bar', lw=3)
plt.bar(np.arange(16)+0.4, y, alpha=0.2, width=0.3, color='green', edgecolor='blue', label='The Second Bar', lw=3)
plt.legend(loc='upper left')
plt.show()
1)为坐标轴加上标签
plt.xlabel('This Is X Axis', fontsize=15)

plt.ylabel('This Is Y Axis', fontsize=15)

plt.title('This Is My Title', fontsize=15)

#fontsize可以控制字体大小
2)X轴可以是字符串
import matplotlib as mpl
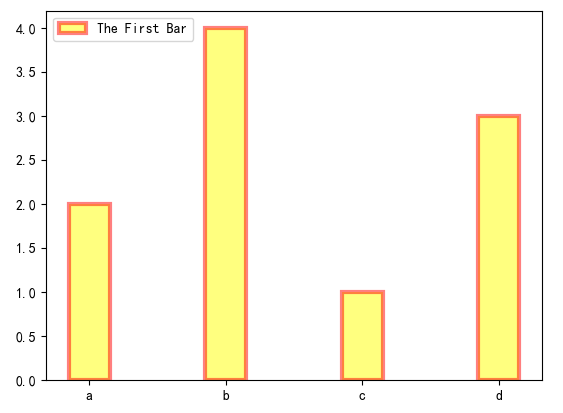
mpl.rcParams['font.sans-serif']=['SimHei'] import matplotlib.pyplot as plt x = ['c', 'a', 'd', 'b']
y = [1, 2, 3, 4] plt.bar(x, y, alpha=0.5, width=0.3, color='yellow', edgecolor='red', label='The First Bar', lw=3)
plt.legend(loc='upper left') plt.show()
python3已经自动将x轴的字符串进行了排序,x轴变成了[ 'a', 'b', 'c', 'd' ](放心:同时x轴对应的y轴值也跟随x的顺序变化),python2并未自动对x轴字符串进行排序:
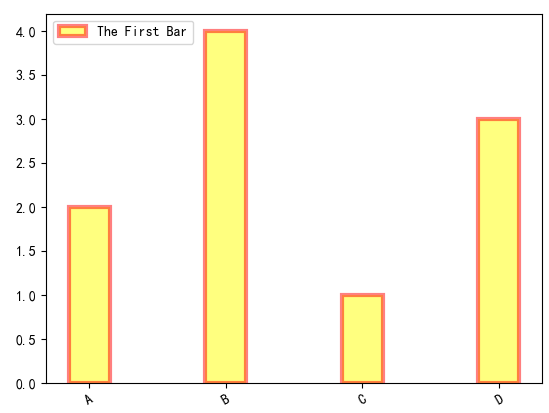
3) 如果想自己给x轴的bar加上标签,或者想让标签倾斜:plt.xticks()
import numpy as np

import matplotlib as mpl

mpl.rcParams['font.sans-serif']=['SimHei']

import matplotlib.pyplot as plt

x = []

y = []

x = ['c', 'a', 'd', 'b']

y = [1, 2, 3, 4]

#plt.figure(figsize=(40,40))

plt.bar(x, y, alpha=0.5, width=0.3, color='yellow', edgecolor='red', label='The First Bar', lw=3)

plt.legend(loc='upper left')

plt.xticks(np.arange(4), ('A','B', 'C', 'D'), rotation=30)#rotation控制倾斜角度

plt.show()
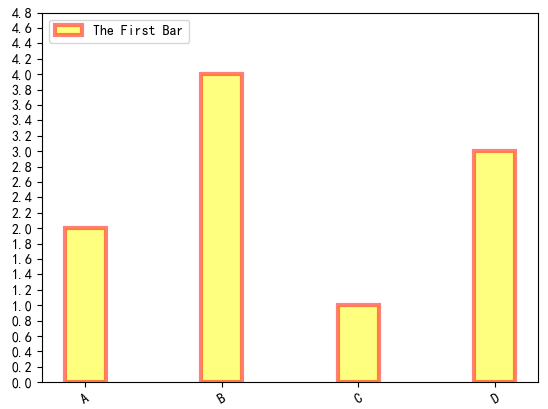
4) 如果想控制y轴数值间隔:plt.yticks(np.arange(0,5,0.2))
import numpy as np

import matplotlib as mpl

mpl.rcParams['font.sans-serif']=['SimHei']

import matplotlib.pyplot as plt

x = []

y = []

x = ['c', 'a', 'd', 'b']

y = [1, 2, 3, 4]

#plt.figure(figsize=(40,40))

plt.bar(x, y, alpha=0.5, width=0.3, color='yellow', edgecolor='red', label='The First Bar', lw=3)

plt.legend(loc='upper left')

plt.xticks(np.arange(4), ('A','B', 'C', 'D'), rotation=30)#rotation控制倾斜角度

plt.yticks(np.arange(0, 5, 0.2))

plt.show()
5)加上label和title
import numpy as np
import matplotlib as mpl
mpl.rcParams['font.sans-serif']=['SimHei'] import matplotlib.pyplot as plt x = ['c', 'a', 'd', 'b']
y = [1, 2, 3, 4]
#plt.figure(figsize=(40,40))
plt.bar(x, y, alpha=0.5, width=0.3, color='yellow', edgecolor='red', label='The First Bar', lw=3)
plt.legend(loc='upper left')
plt.xticks(np.arange(4), ('A','B', 'C', 'D'), rotation=30)#rotation控制倾斜角度
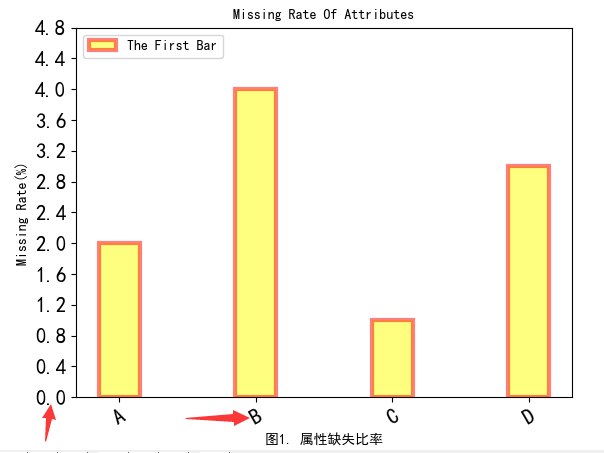
plt.yticks(np.arange(0, 5, 0.4)) #fontsize控制了label和title字体大小
plt.ylabel('Missing Rate(%)', fontsize=10)
plt.title('Missing Rate Of Attributes', fontsize=10)
plt.xlabel('图1. 属性缺失比率', fontsize=10) #但是如果想调整轴上数值字体大小呢?
plt.tick_params(axis='both', labelsize=15) plt.show()
6)如果遇到title越出画布的,可以使用plt.figure(figsize=(50,80))适当调整figsize的大小,plt.savefig('NA.png')可以保存图片。
7)可以将图形框的四条边去掉,或者坐标轴线宽进行加粗
import numpy as np

import matplotlib as mpl

mpl.rcParams['font.sans-serif']=['SimHei']

import matplotlib.pyplot as plt

x = ['c', 'a', 'd', 'b']

y = [1, 2, 3, 4]

plt.figure(figsize=(40,40), dpi=80)

#底部和左边加粗,顶部和右边消失

ax = plt.subplot(1,1,1)

ax.spines['bottom'].set_linewidth(10)

ax.spines['left'].set_linewidth(10)

ax.spines['top'].set_visible(False)

ax.spines['right'].set_visible(False)

plt.bar(x, y, alpha=0.8, width=0.3, color='yellow', edgecolor='red', label='The First Bar', lw=6)

plt.legend(loc='upper left', fontsize=35)

plt.xticks(np.arange(4), ('A','B', 'C', 'D'), rotation=30)#rotation控制倾斜角度

plt.yticks(np.arange(0, 5, 0.4))

#fontsize控制了label和title字体大小

plt.ylabel('Missing Rate(%)', fontsize=40)

plt.title('Missing Rate Of Attributes', fontsize=40)

plt.xlabel('图1. 属性缺失比率', fontsize=40)

#但是如果想调整轴上数值字体大小呢?

plt.tick_params(axis='both', labelsize=35)

plt.savefig('NA.png', dpi=80)
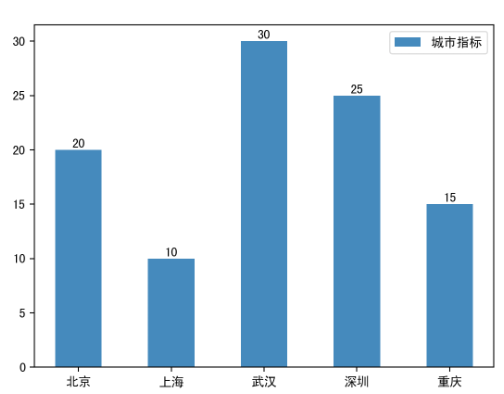
8)给柱状图顶部添加文字(plt.text)
"""

    默认的是竖值条形图

"""

import numpy as np

import matplotlib.pyplot as plt

# 将全局的字体设置为黑体

plt.rcParams['font.family'] = 'SimHei'

# 数据

N = 5

y = [20, 10, 30, 25, 15]

x = np.arange(N)

# 添加地名坐标

str1 = ("北京", "上海", "武汉", "深圳", "重庆")

# 绘图 x x轴, height 高度, 默认:color="blue", width=0.8

p1 = plt.bar(x, height=y, width=0.5, label="城市指标", tick_label=str1)

# 添加数据标签,也就是给柱子顶部添加标签

for a, b in zip(x, y):

    plt.text(a, b + 0.05, '%.0f' % b, ha='center', va='bottom', fontsize=10)

# 添加图例

plt.legend()

# 展示图形

plt.show()
Matplotlib中柱状图bar使用的更多相关文章
- 使用matplotlib中的bar函数绘制柱状图
使用柱状图显示三日电影的票房信息 要显示的数据为2018年12月7日-9日四场电影的票房信息 四场电影分别为:无名之辈,狗十三,毒液:知名守卫者,憨豆特工3 2018年12月7日四场电影票房分别为:[ ...
- Python Matplotlib 中对于 bar 显示时间的问题
参考: 官方教程: http://matplotlib.org/1.3.1/users/recipes.html http://stackoverflow.com/questions/13515471 ...
- 基于matplotlib的数据可视化 - 柱状图bar
柱状图bar 柱状图常用表现形式为: plt.bar(水平坐标数组,高度数组,宽度比例,ec=勾边色,c=填充色,label=图例标签) 注:当高度值为负数时,柱形向下 1 语法 bar(*args, ...
- Python——使用matplotlib绘制柱状图
Python——使用matplotlib绘制柱状图 1.基本柱状图 首先要安装matplotlib(http://matplotlib.org/api/pyplot_api.htm ...
- Matplotlib 在绘画bar时, 鼠标响应点击 bar 的消息
官方教程: http://urania.udea.edu.co/sitios/astronomia-2.0/pages/descargas.rs/files/descargasdt5vi/Cursos ...
- matplotlib 中的一些参数设置
首先:在pycharm 中要使图显示出来,最后一定要加上 plt.show(),如: plt.bar(x, y) plt.show() 下面就是我使用 matplotlib 遇到的一些常用参数设置: ...
- 基于Python实现matplotlib中动态更新图片(交互式绘图)
最近在研究动态障碍物避障算法,在Python语言进行算法仿真时需要实时显示障碍物和运动物的当前位置和轨迹,利用Anaconda的Python打包集合,在Spyder中使用Python3.5语言和mat ...
- 有趣的冷知识:编程中Foo, Bar 到底什么意思?
转自:编程中Foo, Bar 到底什么意思? 1 前言 在很多国外计算机书本和一些第三份开源软件的Demo中经常用到两个英文单词Foo,Bar.这到底是什么意思呢?从步入屌丝界的IT生活见到这两个单词 ...
- matplotlib中color可用的颜色
http://stackoverflow.com/questions/22408237/named-colors-in-matplotlib 参考网址给出了matplotlib中color可用的颜色: ...
随机推荐
- Redis之父表示ARM服务器没戏!
ARM表示Neoverse N1平台和E1 CPU即将发布,Neoverse N1和E1采用7nm制程,并且为服务器和通信设备增加重要提升,拥有高可扩展性.高处理量以及高性能,将分别在2020年和20 ...
- 把当前ubuntu系统做成镜像
把当前ubuntu系统做成镜像 2018年06月19日 15:24:51 还需要再学习一个 阅读数:9720 原文地址: http://community.bwbot.org/topic/167/%E ...
- JAVA spring配置文件总结
首先来看一个标准的Spring配置文件 applicationContext.xml <?xml version="1.0" encoding="UTF-8&quo ...
- BZOJ2275[Coci2010]HRPA——斐波那契博弈
题目描述 N个石子,A和B轮流取,A先.每个人每次最少取一个,最多不超过上一个人的个数的2倍.取到最后一个石子的人胜出,如果A要有必胜策略,第一次他至少要取多少个. 输入 第一行给出数字N,N< ...
- Android 自定义ListView 修改数据
当我们修改了 自定义ListView,如何更新界面上的控件呢? 两种方法: 1 重新绑定adapter (不推荐) Adapter_InboundPO adapter =(Adapter_Inboun ...
- 洛谷3703 [SDOI2017] 树点染色 【LCT】【线段树】
题目分析: 操作一很明显等价于LCT上的access操作,操作二是常识,操作三转化到dfs序上求最大值也是常识.access的时候顺便在线段树中把对应部分-1,把右子树的子树+1即可. 代码: #in ...
- linux常用目录简介
简单归纳: /bin目录(binary)是二进制执行文件目录,主要用于具体应用 /sbin目录(system binary)是系统管理员专用的二进制代码存放目录,主要用于系统管理 附转载一份: /bi ...
- python学习日记(流程控制习题)
请输出1-2+3...+99除88以外的和 i = 1 sum = 0 while i <= 99: if i == 88: i = i + 1 continue else: if i%2 == ...
- Install Nagios (Agent) nrpe client and plugins in Ubuntu/Debian
安装apt-get install nagios-nrpe-server nagios-plugins 修改nrpe.cfgvi /etc/nagios/nrpe.cfg修改Allow Host,添加 ...
- Android 9.png图片的制作方法
在Android的设计过程中,为了适配不同的手机分辨率,图片大多需要拉伸或者压缩,这样就出现了可以任意调整大小的一种图片格式".9.png".这种图片是用于Android开发的一种 ...