ELK的文档搭建
一、安装elasticsearch
官网:https://www.elastic.co/guide/index.html
https://www.elastic.co/guide/en/elasticsearch/reference/2.3/index.html
参考搭建文档
Elasticsearch-6.0.

logstash-6.0.

kibana-6.0.

filebeat-6.0.

https://blog.51cto.com/zero01/2079879   上篇

https://blog.51cto.com/zero01/2082794    下篇

参考  https://www.cnblogs.com/superlinux/p/10591428.html
filebeat写入kafka  :https://www.jianshu.com/p/da8113f58115
1)环境准备
[root@k8s6 ~]# java -version

openjdk version "1.8.0_201"

OpenJDK Runtime Environment (build 1.8.0_201-b09)

OpenJDK -Bit Server VM (build 25.201-b09, mixed mode)

)

[root@k8s6 ~]# ls elktools/

elasticsearch-2.3..rpm  kibana-4.5.-.x86_64.rpm  logstash-2.3.-.noarch.rpm
2)rpm包安装
[root@k8s6 ~]# rpm -ivh elktools/elasticsearch-2.3..rpm
3)修改配置文件
备份配置文件

cp /etc/elasticsearch/elasticsearch.yml /etc/elasticsearch/elasticsearch.yml.bak

修改配置文件

[root@k8s6 elasticsearch]# diff /etc/elasticsearch/elasticsearch.yml /etc/elasticsearch/elasticsearch.yml.bak

17c17

< cluster.name: myes

---

> # cluster.name: my-application

23c23

< node.name: master_node

---

> # node.name: node-

54c54

< network.host: 192.168.10.22

---

> # network.host: 192.168.0.1

58c58

< http.port:

---

> # http.port:
补充:
bootstrap.mlockall: false

bootstrap.system_call_filter: false
4)启动服务
[root@k8s6 elasticsearch]# systemctl start elasticsearch    启动服务

[root@k8s6 elasticsearch]# netstat -lntup|grep java

tcp6              192.168.10.22:      :::*                    LISTEN      /java

tcp6              192.168.10.22:      :::*                    LISTEN      /java
5)对elasticsearch的api验证
[root@k8s6 elasticsearch]# curl http://192.168.10.22:9200

{

  "name" : "master_node",

  "cluster_name" : "myes",

  "version" : {

    "number" : "2.3.5",

    "build_hash" : "90f439ff60a3c0f497f91663701e64ccd01edbb4",

    "build_timestamp" : "2016-07-27T10:36:52Z",

    "build_snapshot" : false,

    "lucene_version" : "5.5.0"

  },

  "tagline" : "You Know, for Search"

}
二、安装elasticsearch的插件安装
1)查看执行的命令和插件位置
[root@k8s6 ~]# ls /usr/share/elasticsearch/

bin  lib  LICENSE.txt  modules  NOTICE.txt  plugins  README.textile
2)安装head插件
[root@k8s6 ~]# /usr/share/elasticsearch/bin/plugin install mobz/elasticsearch-head        从github下载

[root@k8s6 ~]# ls /usr/share/elasticsearch/plugins/head/

Dockerfile                          Gruntfile.js       LICENCE                       proxy           src

Dockerfile-alpine                   grunt_fileSets.js  package.json                  README.textile  test

elasticsearch-head.sublime-project  index.html         plugin-descriptor.properties  _site
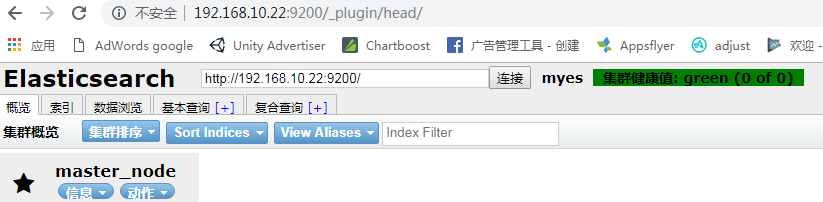
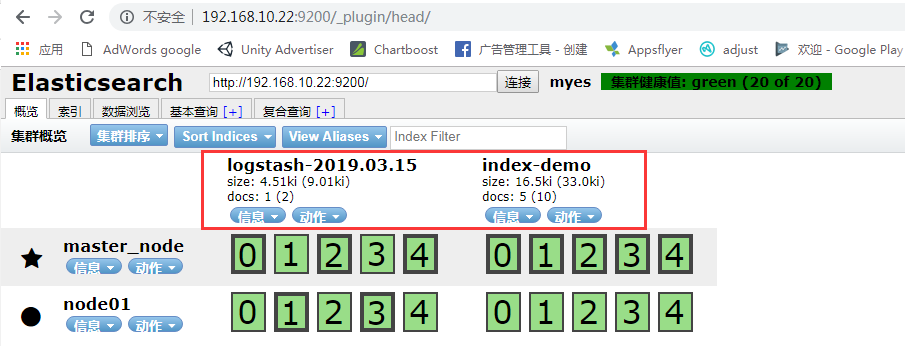
2.1)访问测试
http://192.168.10.22:9200/_plugin/head/
3.1)安装 kopf 插件
[root@k8s6 ~]# /usr/share/elasticsearch/bin/plugin install lmenezes/elasticsearch-kopf
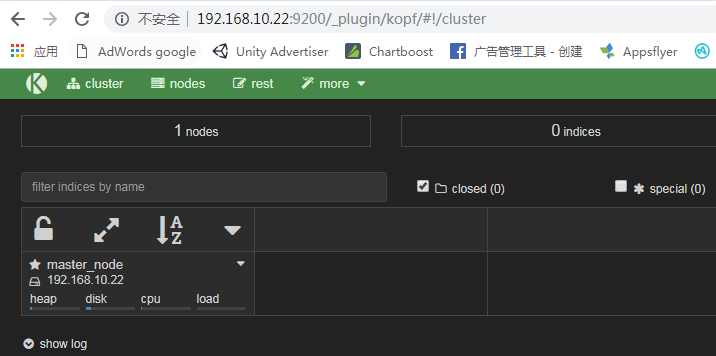
3.2)访问测试
http://192.168.10.22:9200/_plugin/kopf/
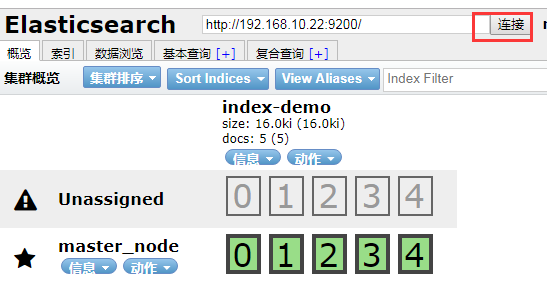
4)模拟提交post请求

刷新连接
二、es的集群测试
1)另一台机器同样安装好es,修改配置文件(主播模式)测试vm会存在问题
[root@node01 elasticsearch]# grep '^[a-Z]' elasticsearch.yml

cluster.name: myes

node.name: node01

path.data: /data/es-data

path.logs: /var/log/elasticsearch

bootstrap.mlockall: false

bootstrap.system_call_filter: false

network.host: 192.168.10.23

http.port:
创建目录,并授权
[root@node01 elasticsearch]# mkdir -p /data/es-data

[root@node01 elasticsearch]# chown elasticsearch:elasticsearch /data/es-data/
2)单播模式
[root@node01 elasticsearch]# grep '^[a-Z]' elasticsearch.yml

cluster.name: myes

node.name: node01

path.data: /data/es-data

path.logs: /var/log/elasticsearch

bootstrap.mlockall: true

network.host: 192.168.10.23

http.port:

discovery.zen.ping.unicast.hosts: ["192.168.10.22", "192.168.10.23"]
3)启动服务
强调,一点要关闭防火墙。否则无法弄成集群
[root@node01 elasticsearch]# /etc/init.d/elasticsearch start
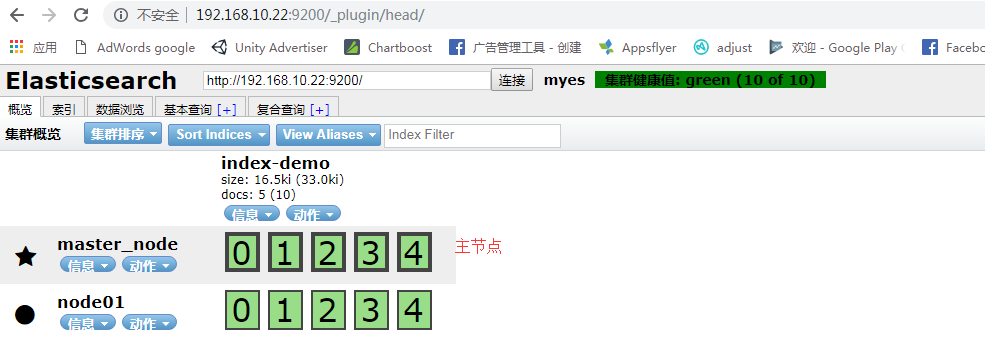
4)查询集群的状态
[root@node01 ~]# curl -XGET 'http://192.168.10.22:9200/_cluster/health?pretty=true'

{

  "cluster_name" : "myes",

  "status" : "green",

  "timed_out" : false,

  "number_of_nodes" : ,    # 2个节点

  "number_of_data_nodes" : ,

  "active_primary_shards" : ,

  "active_shards" : ,

  "relocating_shards" : ,

  "initializing_shards" : ,

  "unassigned_shards" : ,

  "delayed_unassigned_shards" : ,

  "number_of_pending_tasks" : ,

  "number_of_in_flight_fetch" : ,

  "task_max_waiting_in_queue_millis" : ,

  "active_shards_percent_as_number" : 100.0

}
三、在主节点安装 logstash
1)安装logstash
[root@k8s6 elktools]# rpm -ivh logstash-2.3.-.noarch.rpm

准备中...                          ################################# [%]

正在升级/安装...

   :logstash-:2.3.-               ################################# [%]

[root@k8s6 elktools]# rpm -qa|grep logstash

logstash-2.3.-.noarch

[root@k8s6 elktools]# rpm -ql logstash    # 查看安装生成了哪些文件
2)模拟日志标准输出:/opt/logstash/bin/logstash -e 'input { stdin{} } output { stdout{} }'
[root@k8s6 elktools]# /opt/logstash/bin/logstash -e 'input { stdin{} } output { stdout{} }'

Settings: Default pipeline workers:

Pipeline main started

hello

--15T04::.106Z k8s6 hello

hello world

--15T04::.121Z k8s6 hello world
json格式输出: /opt/logstash/bin/logstash -e 'input { stdin{} } output { stdout{ codec => rubydebug } }'
[root@k8s6 elktools]# /opt/logstash/bin/logstash -e 'input { stdin{} } output { stdout{ codec => rubydebug } }'

Settings: Default pipeline workers:

Pipeline main started

hello world

{

       "message" => "hello world",

      "@version" => "",

    "@timestamp" => "2019-03-15T04:47:12.509Z",

          "host" => "k8s6"

}
3)命令行模拟输出到elasticsearch: /opt/logstash/bin/logstash -e 'input { stdin{} } output { elasticsearch{ hosts => ["192.168.10.22:9200"] index => "logstash-%{+YYYY.MM.dd}" } }'
[root@k8s6 elktools]# /opt/logstash/bin/logstash -e 'input { stdin{} } output { elasticsearch{ hosts => ["192.168.10.22:9200"] index => "logstash-%{+YYYY.MM.dd}" } }'

Settings: Default pipeline workers:

Pipeline main started

hhhee
查询到输出的值
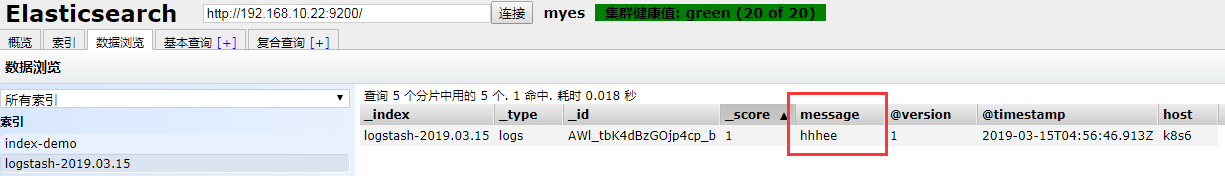
4)同时进行屏幕输出并写入es
[root@k8s6 elktools]# /opt/logstash/bin/logstash -e 'input { stdin{} } output { stdout{ codec => rubydebug }  elasticsearch{ hosts => ["192.168.10.22:9200"] index => "logstash-%{+YYYY.MM.dd}" } }'

Settings: Default pipeline workers:

Pipeline main started

天天向上

{

       "message" => "天天向上",

      "@version" => "",

    "@timestamp" => "2019-03-15T05:02:55.388Z",

          "host" => "k8s6"

}
四、使用配置文件启动logstash
检测语法
[root@node01 ~]# /opt/logstash/bin/logstash -t -f /etc/logstash/conf.d/nginx.conf
Configuration OK
1)进入到配置文件目录。cd /etc/logstash/conf.d/ ,该目录由/etc/init.d/logstash 这里定义的
[root@k8s6 elktools]# cd /etc/logstash/conf.d/

[root@k8s6 conf.d]# ls

[root@k8s6 conf.d]#
编辑 demo.conf文件,既输出在屏幕,也存入es
YYYY.MM.dd 每天
[root@k8s6 conf.d]# cat demo.conf

input {

    stdin{}

}

filter{

}

output{

    elasticsearch {

        hosts => ["192.168.10.22:9200"]

        index => "logstash-%{+YYYY.MM.dd}"

    }

    stdout{ codec => rubydebug }

}
启动服务:[root@k8s6 conf.d]# /opt/logstash/bin/logstash -f /etc/logstash/conf.d/demo.conf
2)使用file插件,指定要记录日志的目录
[root@k8s6 conf.d]# cat file.conf

input {

    file{

        path => ["/var/log/messages", "/var/log/secure"]

        type => "system-log"

        start_position => "beginning"

    }

}

filter{

}

output{

    elasticsearch {

        hosts => ["192.168.10.22:9200"]

        index => "system-log-%{+YYYY.MM}"

    }

}
file.conf
启动服务: /opt/logstash/bin/logstash -f /etc/logstash/conf.d/file.conf
五、安装kibana
1)在主节点安装kibana
[root@k8s6 elktools]# rpm -ivh kibana-4.5.-.x86_64.rpm
查看安装到了哪些位置
[root@k8s6 elktools]# rpm -ql kibana
2)修改配置文件
[root@k8s6 config]# pwd

/opt/kibana/config

[root@k8s6 config]# grep '^[a-Z]' kibana.yml

server.port:

server.host: "0.0.0.0"

elasticsearch.url: "http://192.168.10.22:9200"

kibana.index: ".kibana"
/opt/kibana/config/kibana.yml
启动服务:[root@k8s6 config]# /etc/init.d/kibana start
[root@k8s6 config]# netstat -lntup|grep

tcp               0.0.0.0:            0.0.0.0:*               LISTEN      /node
网页访问:192.168.10.22:5601
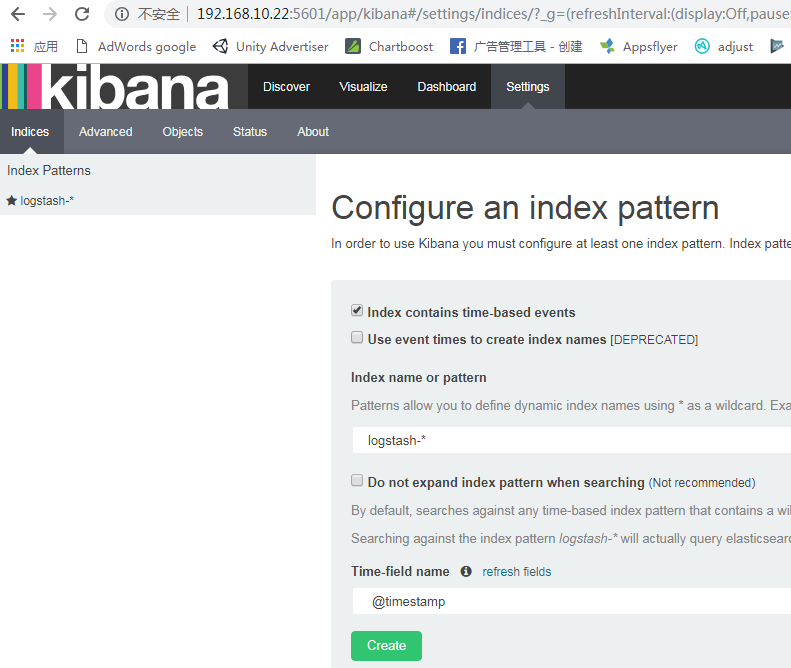
2)配置索引,配置哪个,显示哪个的日志文件

匹配到了创建,即可
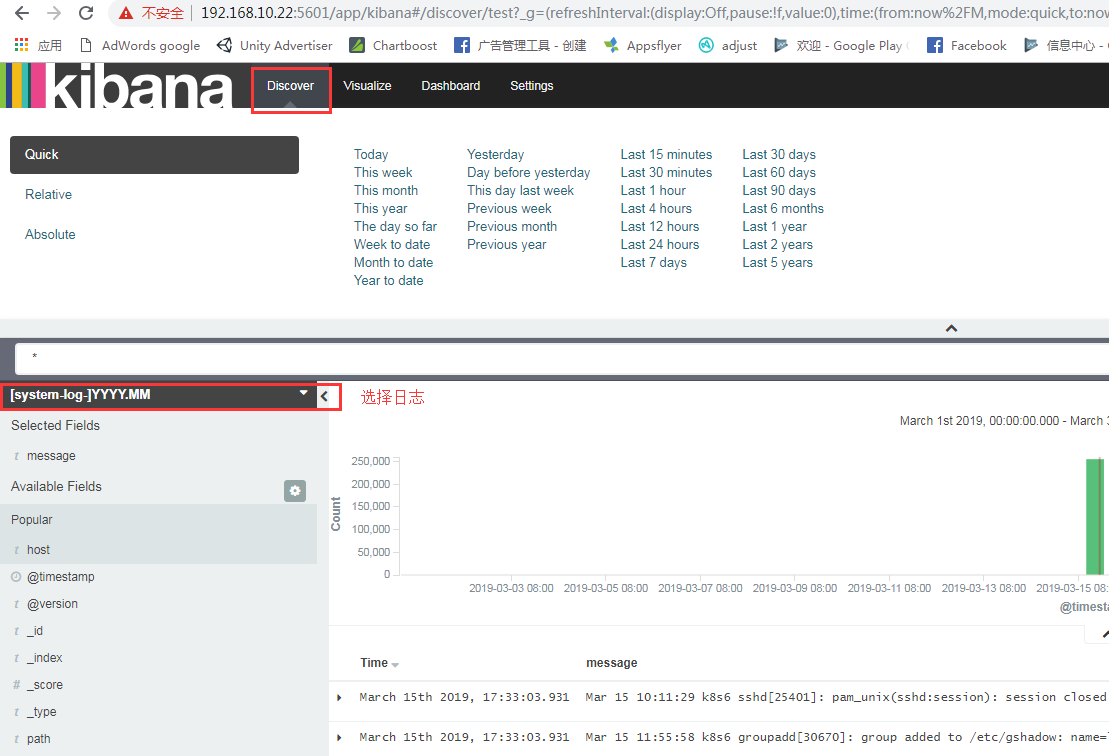
ELK的文档搭建的更多相关文章
- ELK安装文档
ELK安装文档: http://cuidehua.blog.51cto.com/5449828/1769525 如何将客户端日志通过ogstash-forwarder发送给服务端的logstash h ...
- swagger在线api文档搭建指南,用于线上合适么?
在上一篇文章中,我们讲解了什么是 api,什么是 sdk: https://www.cnblogs.com/tanshaoshenghao/p/16217608.html 今天将来到我们万丈高楼平地起 ...
- ELK 部署文档
1. 前言 在日常运维工作中,对于系统和业务日志的处理尤为重要.尤其是分布式架构,每个服务都会有很多节点,如果要手工一个一个的去取日志,运维怕是要累死. 简单介绍: ELK 是 elasticsear ...
- Filebeat+ELK部署文档
在日常运维工作中,对于系统和业务日志的处理尤为重要.今天,在这里分享一下自己部署的Filebeat+ELK开源实时日志分析平台的记录过程,有不对的地方还望指出. 简单介绍: 日志主要包括系统日志.应用 ...
- ELK帮助文档
elasticsearch: API中文指南:https://es.xiaoleilu.com/010_Intro/15_API.html 官方文档:https://www.elastic.co/cn ...
- elk升级文档
1.kibana等都统一版本了,5.4版本的kibana要5.4版本的elasticsearch 2.现有架构: logstash logstash读取日志-------->内网redis做队列 ...
- 一文搭建自己博客/文档系统:搭建,自动编译和部署,域名,HTTPS,备案等
本文纯原创,搭建后的博客/文档网站可以参考: Java 全栈知识体系.如需转载请说明原处. 第一部分 - 博客/文档系统的搭建 搭建博客有很多选择,平台性的比如: 知名的CSDN, 博客园, 知乎,简 ...
- hadoop2.6.0汇总:新增功能最新编译 32位、64位安装、源码包、API下载及部署文档
相关内容: hadoop2.5.2汇总:新增功能最新编译 32位.64位安装.源码包.API.eclipse插件下载Hadoop2.5 Eclipse插件制作.连接集群视频.及hadoop-eclip ...
- ASP.NET API Helper Page 创建并生成相关帮助文档
创建API项目 修改原工程文件,该行为是为了避免和引入第三方API工程文件冲突 修改发布设置 引入需要生成文档的相关文件,将第三方API依赖的相关文件(XML文件非常重要,是注释显示的关键),复制到文 ...
随机推荐
- dataTable转换成Json格式
#region dataTable转换成Json格式 /// <summary> /// /// </summary> /// <param name="dt& ...
- js:苹果手机页面返回,数据不刷新问题
$(function () { var isPageHide = false; window.addEventListener('pageshow', function () { ...
- 模拟Http请求的几种常用方式
HttpURLConnection HttpClient JSOUP Nutch 后续补充用法……
- 页面启动jquery
- 知识点---前端处理支持emoji表情
<!DOCTYPE html> <html lang="en"> <head> <meta charset="UTF-8&quo ...
- Oracle:查询各组最新的一条记录
oracle中怎么查询各组中最新的一条记录呢?比如说现在有一个表中几条数据如下: 有两种写法:写法一:over partition by 分析函数 SELECT * FROM (select ID_, ...
- WEB实现单元格合并
function merge_quadefect() { //可实现合并单元格,上下行来比较 //debugger; var totalCols = 7; 列数 var totalRows = $(& ...
- ALV编辑数据后未更新到内表
在调用 ‘I_CALLBACK_USER_COMMAND’的时候定义 DATA: GR_ALV TYPE REF TO CL_GUI_ALV_GRID. "alv数据更改后更新到内表 CAL ...
- Ubuntu 批量添加用户
#!/bin/bash cat user.txt | while read linedo user=$(echo $line | cut -d ' ' -f1) passwd=$(echo ...
- Hillstone基础上网配置
1.接口配置 1)进入设备管理界面后,点击左边 网络—接口: 2)选择相应的接口,点击编辑: 3)在接口配置界面中,选择接口的安全域类型(三层接口即为三层安全域,二层接口即为二层安全域).安全域名称 ...