如何通过DataGridView 实现单元格合并和二维表头
先看下实现出来的效果(这里随便写了几组数据,用来测试)
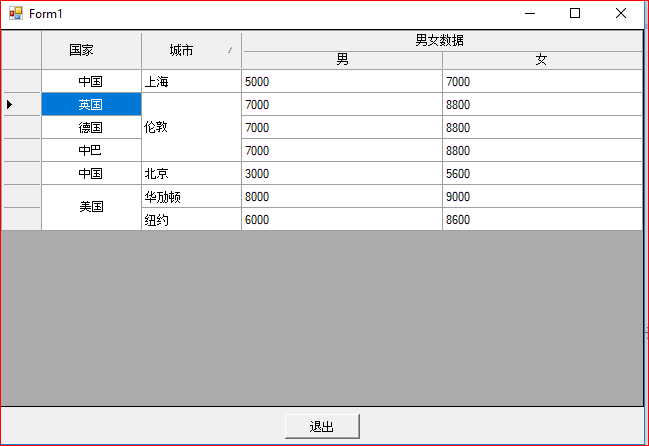
先初始一个DataGridView 设置哪几列
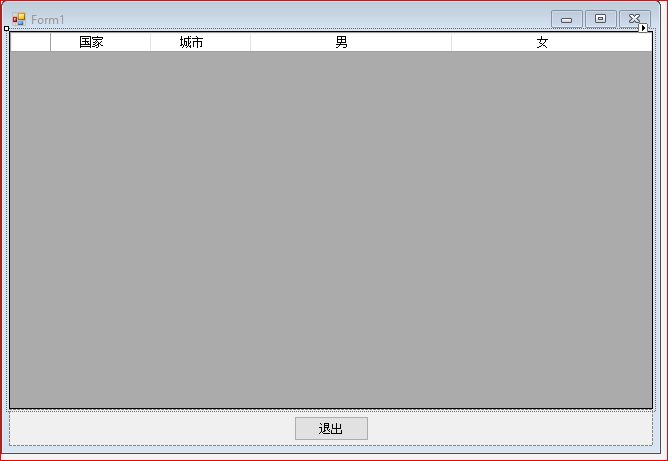
DataGridView 里男女这两列的 AutoSizeMode 可以设置Fill。
    public Form1()

        {

            InitializeComponent();

            this.CancelButton = this.button1;

            DataTable dt = new DataTable();

            dt.Columns.Add("1");

            dt.Columns.Add("2");

            dt.Columns.Add("3");

            dt.Columns.Add("4");

            dt.Rows.Add("中国", "上海", "5000", "7000");

            dt.Rows.Add("中国", "北京", "3000", "5600");

            dt.Rows.Add("美国", "纽约", "6000", "8600");

            this.rowMergeView1.DataSource = dt;

            this.rowMergeView1.ColumnHeadersHeight = 40;

            this.rowMergeView1.ColumnHeadersHeightSizeMode = DataGridViewColumnHeadersHeightSizeMode.DisableResizing;

            this.rowMergeView1.MergeColumnNames.Add("Column1");

            this.rowMergeView1.MergeColumnNames.Add("Column2");

            this.rowMergeView1.AddSpanHeader(2, 2, "男女数据");

        }
手动添加了一些数据填充到DataGridView里,创建一个新的类 RowMergeView 并且继承 DataGridView;通过这个类对DataGridView 进行重绘
using System;
using System.Collections.Generic;
using System.ComponentModel;
using System.Data;
using System.Drawing;
using System.Drawing.Design;
using System.Text;
using System.Windows.Forms;
using System.Collections;
using System.Reflection;
using System.Runtime.InteropServices; /// <summary>
/// DataGridView行合并.请对属性MergeColumnNames 赋值既可
/// </summary>
public partial class RowMergeView : DataGridView
{
#region 构造函数
public RowMergeView()
{
InitializeComponent();
}
#endregion
#region 重写的事件
protected override void OnPaint(PaintEventArgs pe)
{
// TODO: 在此处添加自定义绘制代码 // 调用基类 OnPaint
base.OnPaint(pe);
}
protected override void OnCellPainting(DataGridViewCellPaintingEventArgs e)
{
try
{
if (e.RowIndex > -1 && e.ColumnIndex > -1)
{
DrawCell(e);
}
else
{
//二维表头
if (e.RowIndex == -1)
{
if (SpanRows.ContainsKey(e.ColumnIndex)) //被合并的列
{
//画边框
Graphics g = e.Graphics;
e.Paint(e.CellBounds, DataGridViewPaintParts.Background | DataGridViewPaintParts.Border); int left = e.CellBounds.Left, top = e.CellBounds.Top + 2,
right = e.CellBounds.Right, bottom = e.CellBounds.Bottom; switch (SpanRows[e.ColumnIndex].Position)
{
case 1:
left += 2;
break;
case 2:
break;
case 3:
right -= 2;
break;
} //画上半部分底色
g.FillRectangle(new SolidBrush(this._mergecolumnheaderbackcolor), left, top,
right - left, (bottom - top) / 2); //画中线
g.DrawLine(new Pen(this.GridColor), left, (top + bottom) / 2,
right, (top + bottom) / 2); //写小标题
StringFormat sf = new StringFormat();
sf.Alignment = StringAlignment.Center;
sf.LineAlignment = StringAlignment.Center; g.DrawString(e.Value + "", e.CellStyle.Font, Brushes.Black,
new Rectangle(left, (top + bottom) / 2, right - left, (bottom - top) / 2), sf);
left = this.GetColumnDisplayRectangle(SpanRows[e.ColumnIndex].Left, true).Left - 2; if (left < 0) left = this.GetCellDisplayRectangle(-1, -1, true).Width;
right = this.GetColumnDisplayRectangle(SpanRows[e.ColumnIndex].Right, true).Right - 2;
if (right < 0) right = this.Width; g.DrawString(SpanRows[e.ColumnIndex].Text, e.CellStyle.Font, Brushes.Black,
new Rectangle(left, top, right - left, (bottom - top) / 2), sf);
e.Handled = true;
}
}
}
base.OnCellPainting(e);
}
catch
{ }
}
protected override void OnCellClick(DataGridViewCellEventArgs e)
{
base.OnCellClick(e);
}
#endregion
#region 自定义方法
/// <summary>
/// 画单元格
/// </summary>
/// <param name="e"></param>
private void DrawCell(DataGridViewCellPaintingEventArgs e)
{
if (e.CellStyle.Alignment == DataGridViewContentAlignment.NotSet)
{
e.CellStyle.Alignment = DataGridViewContentAlignment.MiddleCenter;
}
Brush gridBrush = new SolidBrush(this.GridColor);
SolidBrush backBrush = new SolidBrush(e.CellStyle.BackColor);
SolidBrush fontBrush = new SolidBrush(e.CellStyle.ForeColor);
int cellwidth;
//上面相同的行数
int UpRows = 0;
//下面相同的行数
int DownRows = 0;
//总行数
int count = 0;
if (this.MergeColumnNames.Contains(this.Columns[e.ColumnIndex].Name) && e.RowIndex != -1)
{
cellwidth = e.CellBounds.Width;
Pen gridLinePen = new Pen(gridBrush);
string curValue = e.Value == null ? "" : e.Value.ToString().Trim();
string curSelected = this.CurrentRow.Cells[e.ColumnIndex].Value == null ? "" : this.CurrentRow.Cells[e.ColumnIndex].Value.ToString().Trim();
if (!string.IsNullOrEmpty(curValue))
{
#region 获取下面的行数
for (int i = e.RowIndex; i < this.Rows.Count; i++)
{
if (this.Rows[i].Cells[e.ColumnIndex].Value.ToString().Equals(curValue))
{
//this.Rows[i].Cells[e.ColumnIndex].Selected = this.Rows[e.RowIndex].Cells[e.ColumnIndex].Selected; DownRows++;
if (e.RowIndex != i)
{
cellwidth = cellwidth < this.Rows[i].Cells[e.ColumnIndex].Size.Width ? cellwidth : this.Rows[i].Cells[e.ColumnIndex].Size.Width;
}
}
else
{
break;
}
}
#endregion
#region 获取上面的行数
for (int i = e.RowIndex; i >= 0; i--)
{
if (this.Rows[i].Cells[e.ColumnIndex].Value.ToString().Equals(curValue))
{
//this.Rows[i].Cells[e.ColumnIndex].Selected = this.Rows[e.RowIndex].Cells[e.ColumnIndex].Selected;
UpRows++;
if (e.RowIndex != i)
{
cellwidth = cellwidth < this.Rows[i].Cells[e.ColumnIndex].Size.Width ? cellwidth : this.Rows[i].Cells[e.ColumnIndex].Size.Width;
}
}
else
{
break;
}
}
#endregion
count = DownRows + UpRows - 1;
if (count < 2)
{
return;
}
}
if (this.Rows[e.RowIndex].Selected)
{
backBrush.Color = e.CellStyle.SelectionBackColor;
fontBrush.Color = e.CellStyle.SelectionForeColor;
}
//以背景色填充
e.Graphics.FillRectangle(backBrush, e.CellBounds);
//画字符串
PaintingFont(e, cellwidth, UpRows, DownRows, count);
if (DownRows == 1)
{
e.Graphics.DrawLine(gridLinePen, e.CellBounds.Left, e.CellBounds.Bottom - 1, e.CellBounds.Right - 1, e.CellBounds.Bottom - 1);
count = 0;
}
// 画右边线
e.Graphics.DrawLine(gridLinePen, e.CellBounds.Right - 1, e.CellBounds.Top, e.CellBounds.Right - 1, e.CellBounds.Bottom); e.Handled = true;
}
}
/// <summary>
/// 画字符串
/// </summary>
/// <param name="e"></param>
/// <param name="cellwidth"></param>
/// <param name="UpRows"></param>
/// <param name="DownRows"></param>
/// <param name="count"></param>
private void PaintingFont(System.Windows.Forms.DataGridViewCellPaintingEventArgs e, int cellwidth, int UpRows, int DownRows, int count)
{
SolidBrush fontBrush = new SolidBrush(e.CellStyle.ForeColor);
int fontheight = (int)e.Graphics.MeasureString(e.Value.ToString(), e.CellStyle.Font).Height;
int fontwidth = (int)e.Graphics.MeasureString(e.Value.ToString(), e.CellStyle.Font).Width;
int cellheight = e.CellBounds.Height; if (e.CellStyle.Alignment == DataGridViewContentAlignment.BottomCenter)
{
e.Graphics.DrawString((String)e.Value, e.CellStyle.Font, fontBrush, e.CellBounds.X + (cellwidth - fontwidth) / 2, e.CellBounds.Y + cellheight * DownRows - fontheight);
}
else if (e.CellStyle.Alignment == DataGridViewContentAlignment.BottomLeft)
{
e.Graphics.DrawString((String)e.Value, e.CellStyle.Font, fontBrush, e.CellBounds.X, e.CellBounds.Y + cellheight * DownRows - fontheight);
}
else if (e.CellStyle.Alignment == DataGridViewContentAlignment.BottomRight)
{
e.Graphics.DrawString((String)e.Value, e.CellStyle.Font, fontBrush, e.CellBounds.X + cellwidth - fontwidth, e.CellBounds.Y + cellheight * DownRows - fontheight);
}
else if (e.CellStyle.Alignment == DataGridViewContentAlignment.MiddleCenter)
{
e.Graphics.DrawString((String)e.Value, e.CellStyle.Font, fontBrush, e.CellBounds.X + (cellwidth - fontwidth) / 2, e.CellBounds.Y - cellheight * (UpRows - 1) + (cellheight * count - fontheight) / 2);
}
else if (e.CellStyle.Alignment == DataGridViewContentAlignment.MiddleLeft)
{
e.Graphics.DrawString((String)e.Value, e.CellStyle.Font, fontBrush, e.CellBounds.X, e.CellBounds.Y - cellheight * (UpRows - 1) + (cellheight * count - fontheight) / 2);
}
else if (e.CellStyle.Alignment == DataGridViewContentAlignment.MiddleRight)
{
e.Graphics.DrawString((String)e.Value, e.CellStyle.Font, fontBrush, e.CellBounds.X + cellwidth - fontwidth, e.CellBounds.Y - cellheight * (UpRows - 1) + (cellheight * count - fontheight) / 2);
}
else if (e.CellStyle.Alignment == DataGridViewContentAlignment.TopCenter)
{
e.Graphics.DrawString((String)e.Value, e.CellStyle.Font, fontBrush, e.CellBounds.X + (cellwidth - fontwidth) / 2, e.CellBounds.Y - cellheight * (UpRows - 1));
}
else if (e.CellStyle.Alignment == DataGridViewContentAlignment.TopLeft)
{
e.Graphics.DrawString((String)e.Value, e.CellStyle.Font, fontBrush, e.CellBounds.X, e.CellBounds.Y - cellheight * (UpRows - 1));
}
else if (e.CellStyle.Alignment == DataGridViewContentAlignment.TopRight)
{
e.Graphics.DrawString((String)e.Value, e.CellStyle.Font, fontBrush, e.CellBounds.X + cellwidth - fontwidth, e.CellBounds.Y - cellheight * (UpRows - 1));
}
else
{
e.Graphics.DrawString((String)e.Value, e.CellStyle.Font, fontBrush, e.CellBounds.X + (cellwidth - fontwidth) / 2, e.CellBounds.Y - cellheight * (UpRows - 1) + (cellheight * count - fontheight) / 2);
}
}
#endregion
#region 属性
/// <summary>
/// 设置或获取合并列的集合
/// </summary>
[MergableProperty(false)]
[Editor("System.Windows.Forms.Design.ListControlStringCollectionEditor, System.Design, Version=2.0.0.0, Culture=neutral, PublicKeyToken=b03f5f7f11d50a3a", typeof(UITypeEditor))]
[DesignerSerializationVisibility(System.ComponentModel.DesignerSerializationVisibility.Visible)]
[Localizable(true)]
[Description("设置或获取合并列的集合"), Browsable(true), Category("单元格合并")]
public List<string> MergeColumnNames
{
get
{
return _mergecolumnname;
}
set
{
_mergecolumnname = value;
}
}
private List<string> _mergecolumnname = new List<string>();
#endregion
#region 二维表头
private struct SpanInfo //表头信息
{
public SpanInfo(string Text, int Position, int Left, int Right)
{
this.Text = Text;
this.Position = Position;
this.Left = Left;
this.Right = Right;
} public string Text; //列主标题
public int Position; //位置,1:左,2中,3右
public int Left; //对应左行
public int Right; //对应右行
}
private Dictionary<int, SpanInfo> SpanRows = new Dictionary<int, SpanInfo>();//需要2维表头的列
/// <summary>
/// 合并列
/// </summary>
/// <param name="ColIndex">列的索引</param>
/// <param name="ColCount">需要合并的列数</param>
/// <param name="Text">合并列后的文本</param>
public void AddSpanHeader(int ColIndex, int ColCount, string Text)
{
if (ColCount < 2)
{
throw new Exception("行宽应大于等于2,合并1列无意义。");
}
//将这些列加入列表
int Right = ColIndex + ColCount - 1; //同一大标题下的最后一列的索引
SpanRows[ColIndex] = new SpanInfo(Text, 1, ColIndex, Right); //添加标题下的最左列
SpanRows[Right] = new SpanInfo(Text, 3, ColIndex, Right); //添加该标题下的最右列
for (int i = ColIndex + 1; i < Right; i++) //中间的列
{
SpanRows[i] = new SpanInfo(Text, 2, ColIndex, Right);
}
}
/// <summary>
/// 清除合并的列
/// </summary>
public void ClearSpanInfo()
{
SpanRows.Clear();
//ReDrawHead();
}
private void DataGridViewEx_Scroll(object sender, ScrollEventArgs e)
{
if (e.ScrollOrientation == ScrollOrientation.HorizontalScroll)// && e.Type == ScrollEventType.EndScroll)
{
timer1.Enabled = false; timer1.Enabled = true;
}
}
//刷新显示表头
public void ReDrawHead()
{
foreach (int si in SpanRows.Keys)
{
this.Invalidate(this.GetCellDisplayRectangle(si, -1, true));
}
}
private void timer1_Tick(object sender, EventArgs e)
{
timer1.Enabled = false;
ReDrawHead();
}
/// <summary>
/// 二维表头的背景颜色
/// </summary>
[Description("二维表头的背景颜色"), Browsable(true), Category("二维表头")]
public Color MergeColumnHeaderBackColor
{
get { return this._mergecolumnheaderbackcolor; }
set { this._mergecolumnheaderbackcolor = value; }
}
private Color _mergecolumnheaderbackcolor = System.Drawing.SystemColors.Control;
#endregion
}
然后在前台code里直接调用这个类里面的方法。
如何通过DataGridView 实现单元格合并和二维表头的更多相关文章
- 【Winform-自定义控件】DataGridView 单元格合并和二维表头
DataGridView单元格合并和二维表头应用: //DataGridView绑定数据 DataTable dt = new DataTable(); dt.Columns.Add("); ...
- DataGridView单元格合并
本文章转载:http://www.cnblogs.com/xiaofengfeng/p/3382094.html 图: 代码就是如此简单 文件下载:DataGridView单元格合并源码 也可以参考: ...
- ExtJS 4.2 Grid组件的单元格合并
ExtJS 4.2 Grid组件本身并没有提供单元格合并功能,需要自己实现这个功能. 目录 1. 原理 2. 多列合并 3. 代码与在线演示 1. 原理 1.1 HTML代码分析 首先创建一个Grid ...
- NPOI 教程 - 2.1单元格合并
来源:http://liyingchun343333.blog.163.com/blog/static/3579731620091018212990/ 合并单元格在制作表格时很有用,比如说表格的标题就 ...
- asp.net使用控件datagrid实现表头单元格合并
合并的要点: 1.datagid的单元格合并原理是table中tr,td的布局实现; 2.合并的时机实在其datagridcreate事件中实现; 3.认识一个对象TableCellCollectio ...
- devexpress实现单元格合并以及依据条件合并单元格
1.devexpress实现单元格合并非常的简单,只要设置属性[AllowCellMerge=True]就可以了,实现效果如下图: 2.但是在具体要求中并非需要所有的相同单元格都合并,可能需要其他的条 ...
- SNF快速开发平台MVC-表格单元格合并组件
1. 表格单元格合并组件 1.1. 效果展示 1.1.1. 页面展现表格合并单元格 图 4.1 1.1.2. 导出excel合并单元格 图 4.2 1.2. 调用说 ...
- 关于table动态添加数据 单元格合并 数组合并
var newArr = [ {"BranchID":1,"BranchName":"城二","BranchFullName&qu ...
- excel技巧--单元格合并与拆分
如果要将上图的地区列做成下图的合并单一列: 有如下做法: (以下图表格为例) 1.选择要排序的表格,点击“开始”-->排序和筛选-->自定义排序.在对话框选择“业务项目”进行排序: 2.选 ...
随机推荐
- 我最常用的7个Web在线工具
为什么要用Web在线工具呢?有两个原因,第一,它不受限于物理平台,我既可以在自己的电脑上使用,也可以在公司或亲戚朋友的电脑上使用(不管对方的操作系统是什么,只要能上网):第二,可以解放硬盘,减少PC端 ...
- C# 判断access建库、建表、文件是否存在等
1.创建数据库 2.判断表是否存在 3.创建表 1. #region access数据库操作 之 创建数据库 private void creatMDB(string dbNam ...
- Winform解决界面重绘闪烁的问题
在窗体或用户控件中重写CreateParams protected override CreateParams CreateParams { get { CreateParams cp = base. ...
- UWP 响应键盘组合快捷键
方法1:响应Ctrl+?快捷键 首先在load事件或者keydown事件内注册事件 public MainPage() { this.InitializeComponent(); // Registe ...
- Python中super()的用法
参考链接:https://www.cnblogs.com/shengulong/p/7892266.html super 是用来解决多重继承问题的,直接用类名调用父类方法在使用单继承的时候没问题,但是 ...
- 【kuangbin专题】计算几何基础
1.poj2318 TOYS 传送:http://poj.org/problem?id=2318 题意:有m个点落在n+1个区域内.问落在每个区域的个数. 分析:二分查找落在哪个区域内.叉积判断点与线 ...
- vue项目常见需求(项目实战笔记)
一.起步 1.引入reset.css解决手机之间不同分辨率的问题(reset.css为别人封装的css文件) import './assets/styles/reset.css' 使用方式 1rem= ...
- flask框架1
说flask框架之前,必须得提一下web框架,他的作用是为了利用互联网交流工作文档,我们为什么要使用框架,因为框架的稳定性和可扩展性强并且可以降低开发难度,提高开发效率.总的来说就是避免做无用功,重复 ...
- JS: 数组的循环函数
JS 数组相关的循环函数,用得挺多,所以有些坑还是要去踩一下,先来看一道面试题. 注意:下面提到的不改变原数组仅针对基本数据类型. 面试题 模拟实现数组的 map 函数. 心中有答案了吗?我的答案放在 ...
- POJ 2603
#include<iostream> #include<stdio.h> #define M 350000 #define N 30000 using namespace st ...