
拒绝黑盒应用-Spring Boot 应用可视化监控

图文简介
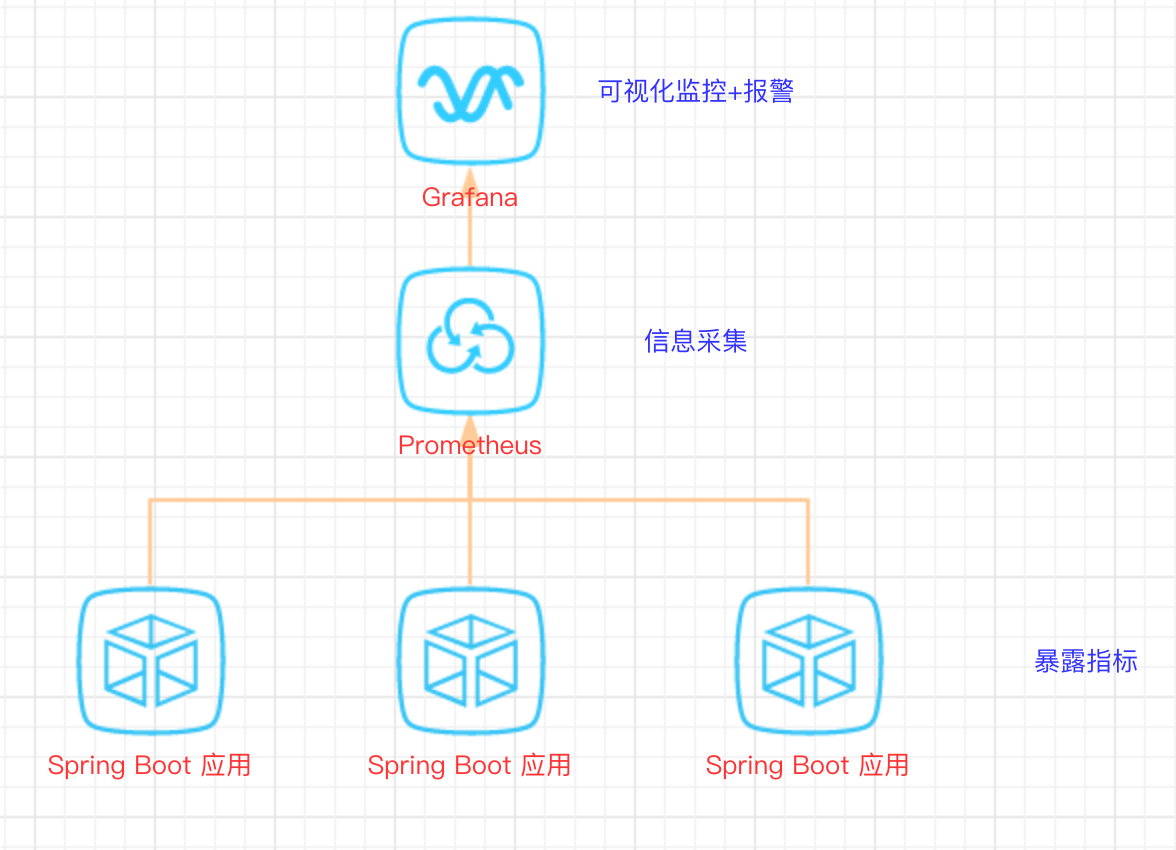
逻辑关系
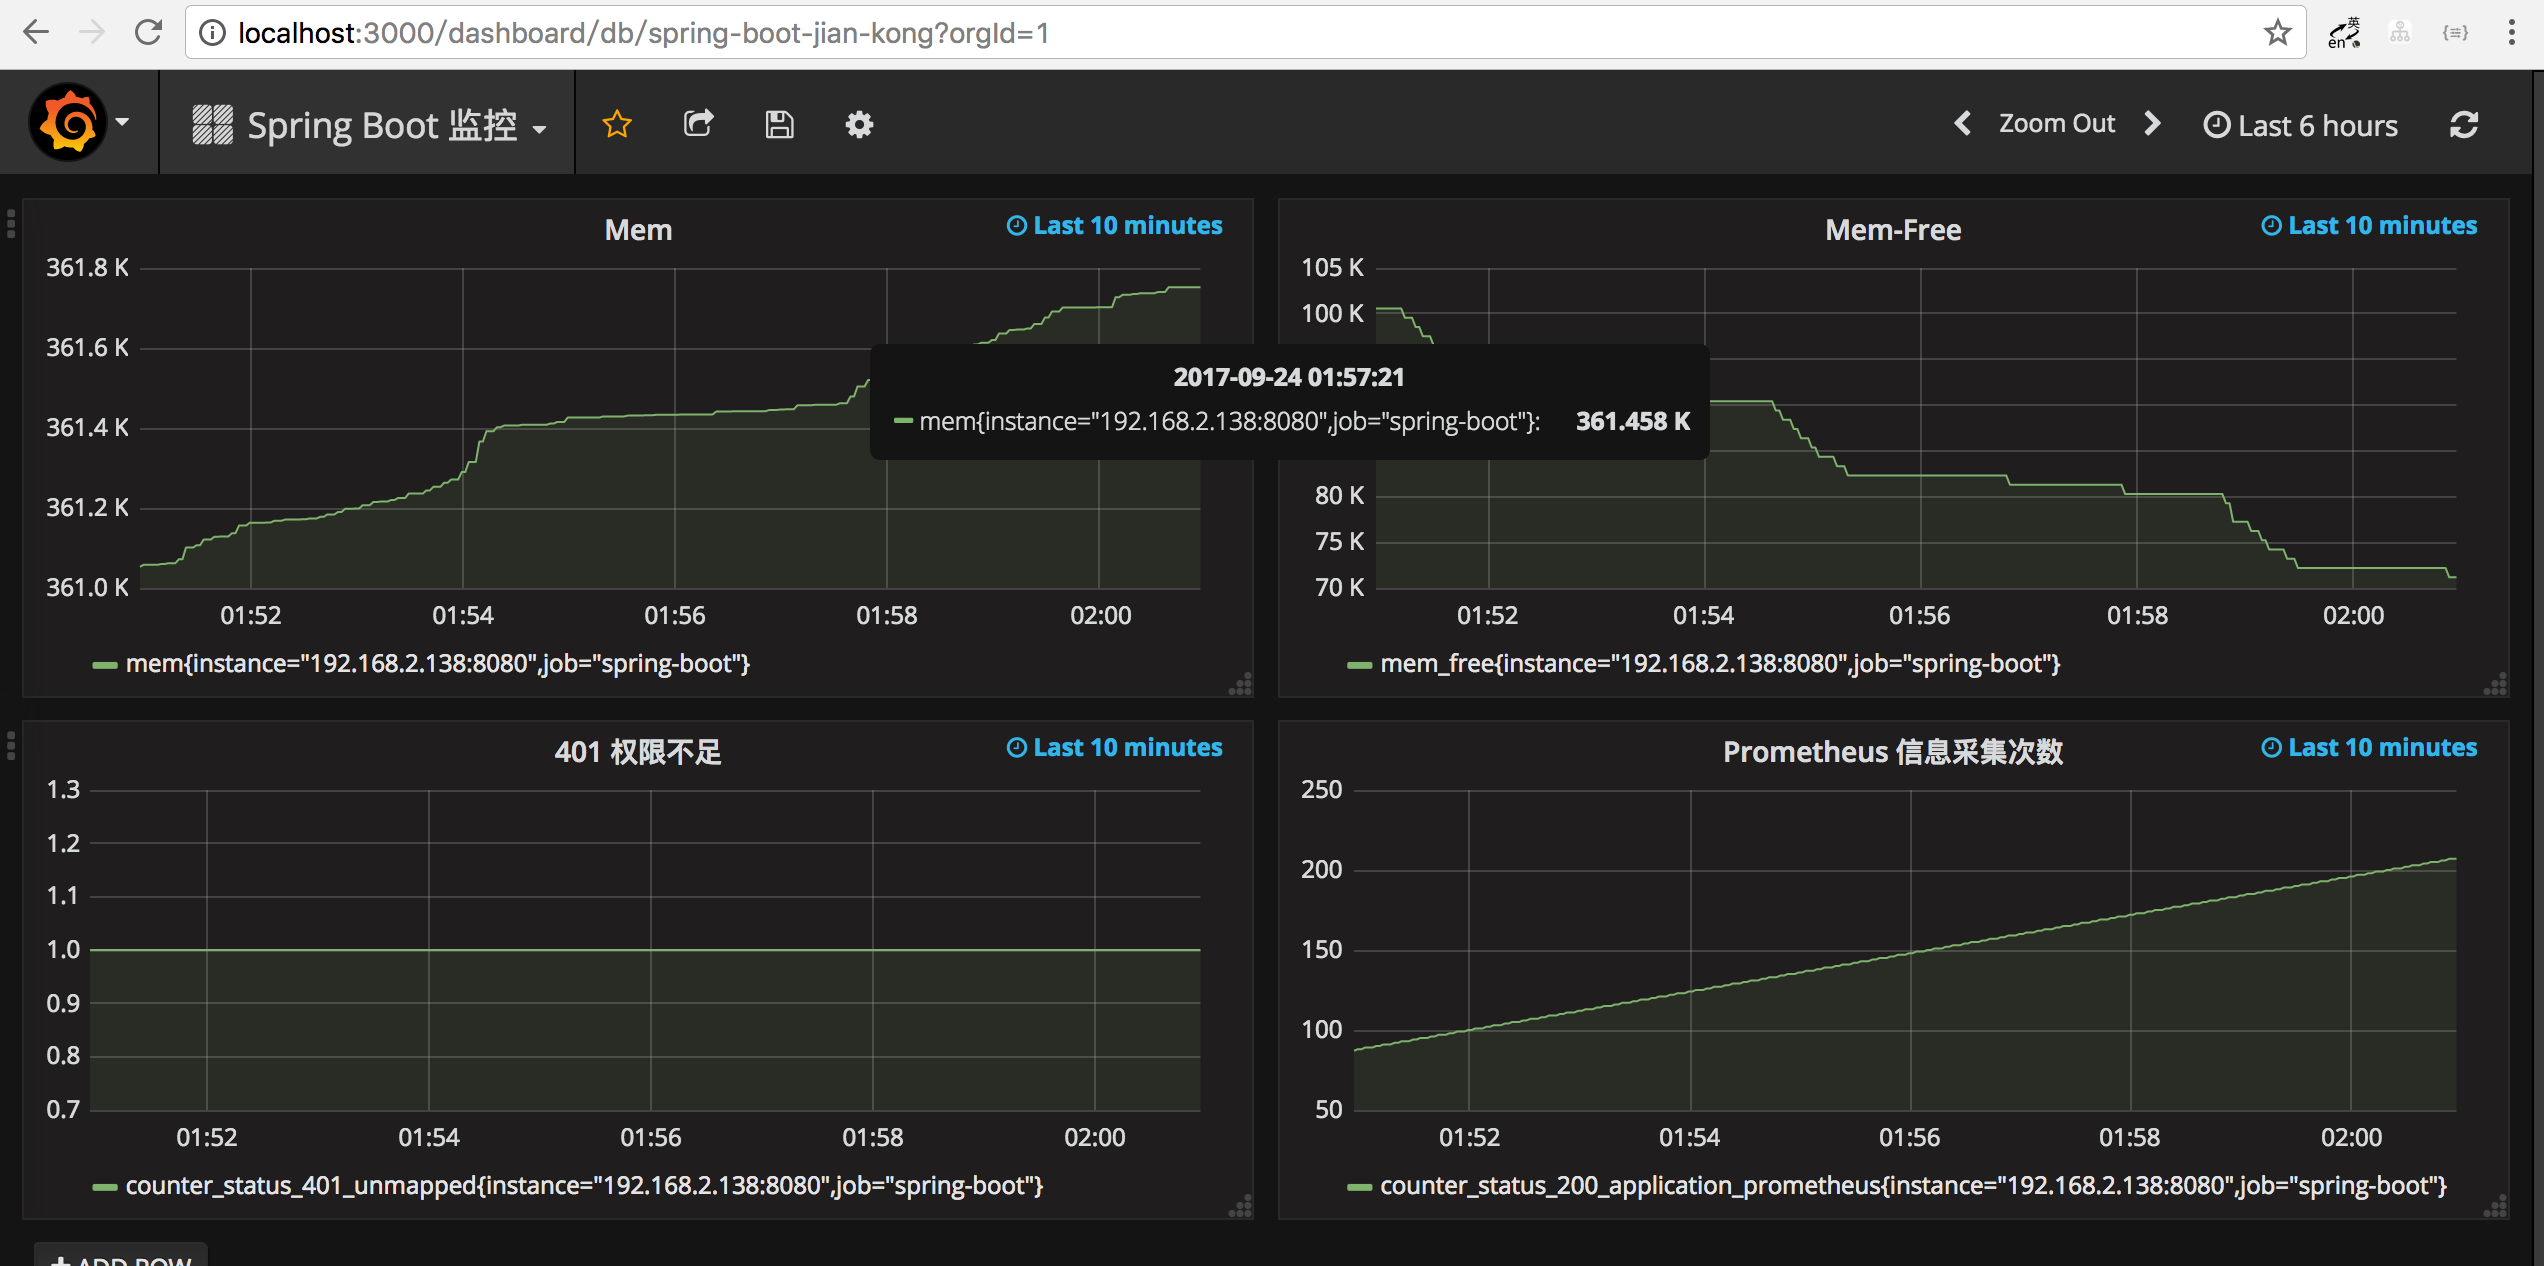
效果演示
快速开始
1、Spring Boot 应用暴露监控指标【版本 1.5.7.RELEASE】
首先,添加依赖如下依赖:
  <dependency>

            <groupId>org.springframework.boot</groupId>

            <artifactId>spring-boot-starter-actuator</artifactId>

        </dependency>

        <dependency>

            <groupId>io.prometheus</groupId>

            <artifactId>simpleclient_spring_boot</artifactId>

            <version>0.0.26</version>

        </dependency>
然后,在启动类 Application.java 添加如下注解:
@SpringBootApplication

@EnablePrometheusEndpoint

@EnableSpringBootMetricsCollector

public class Application {

    public static void main(String[] args) {

        SpringApplication.run(Application.class, args);

    }

}
最后,配置默认的登录账号和密码,在 application.yml 中:
security:

  user:

    name: user

    password: pwd
提示:不建议配置
management.security.enabled: false
启动应用程序后,会看到如下一系列的 Mappings
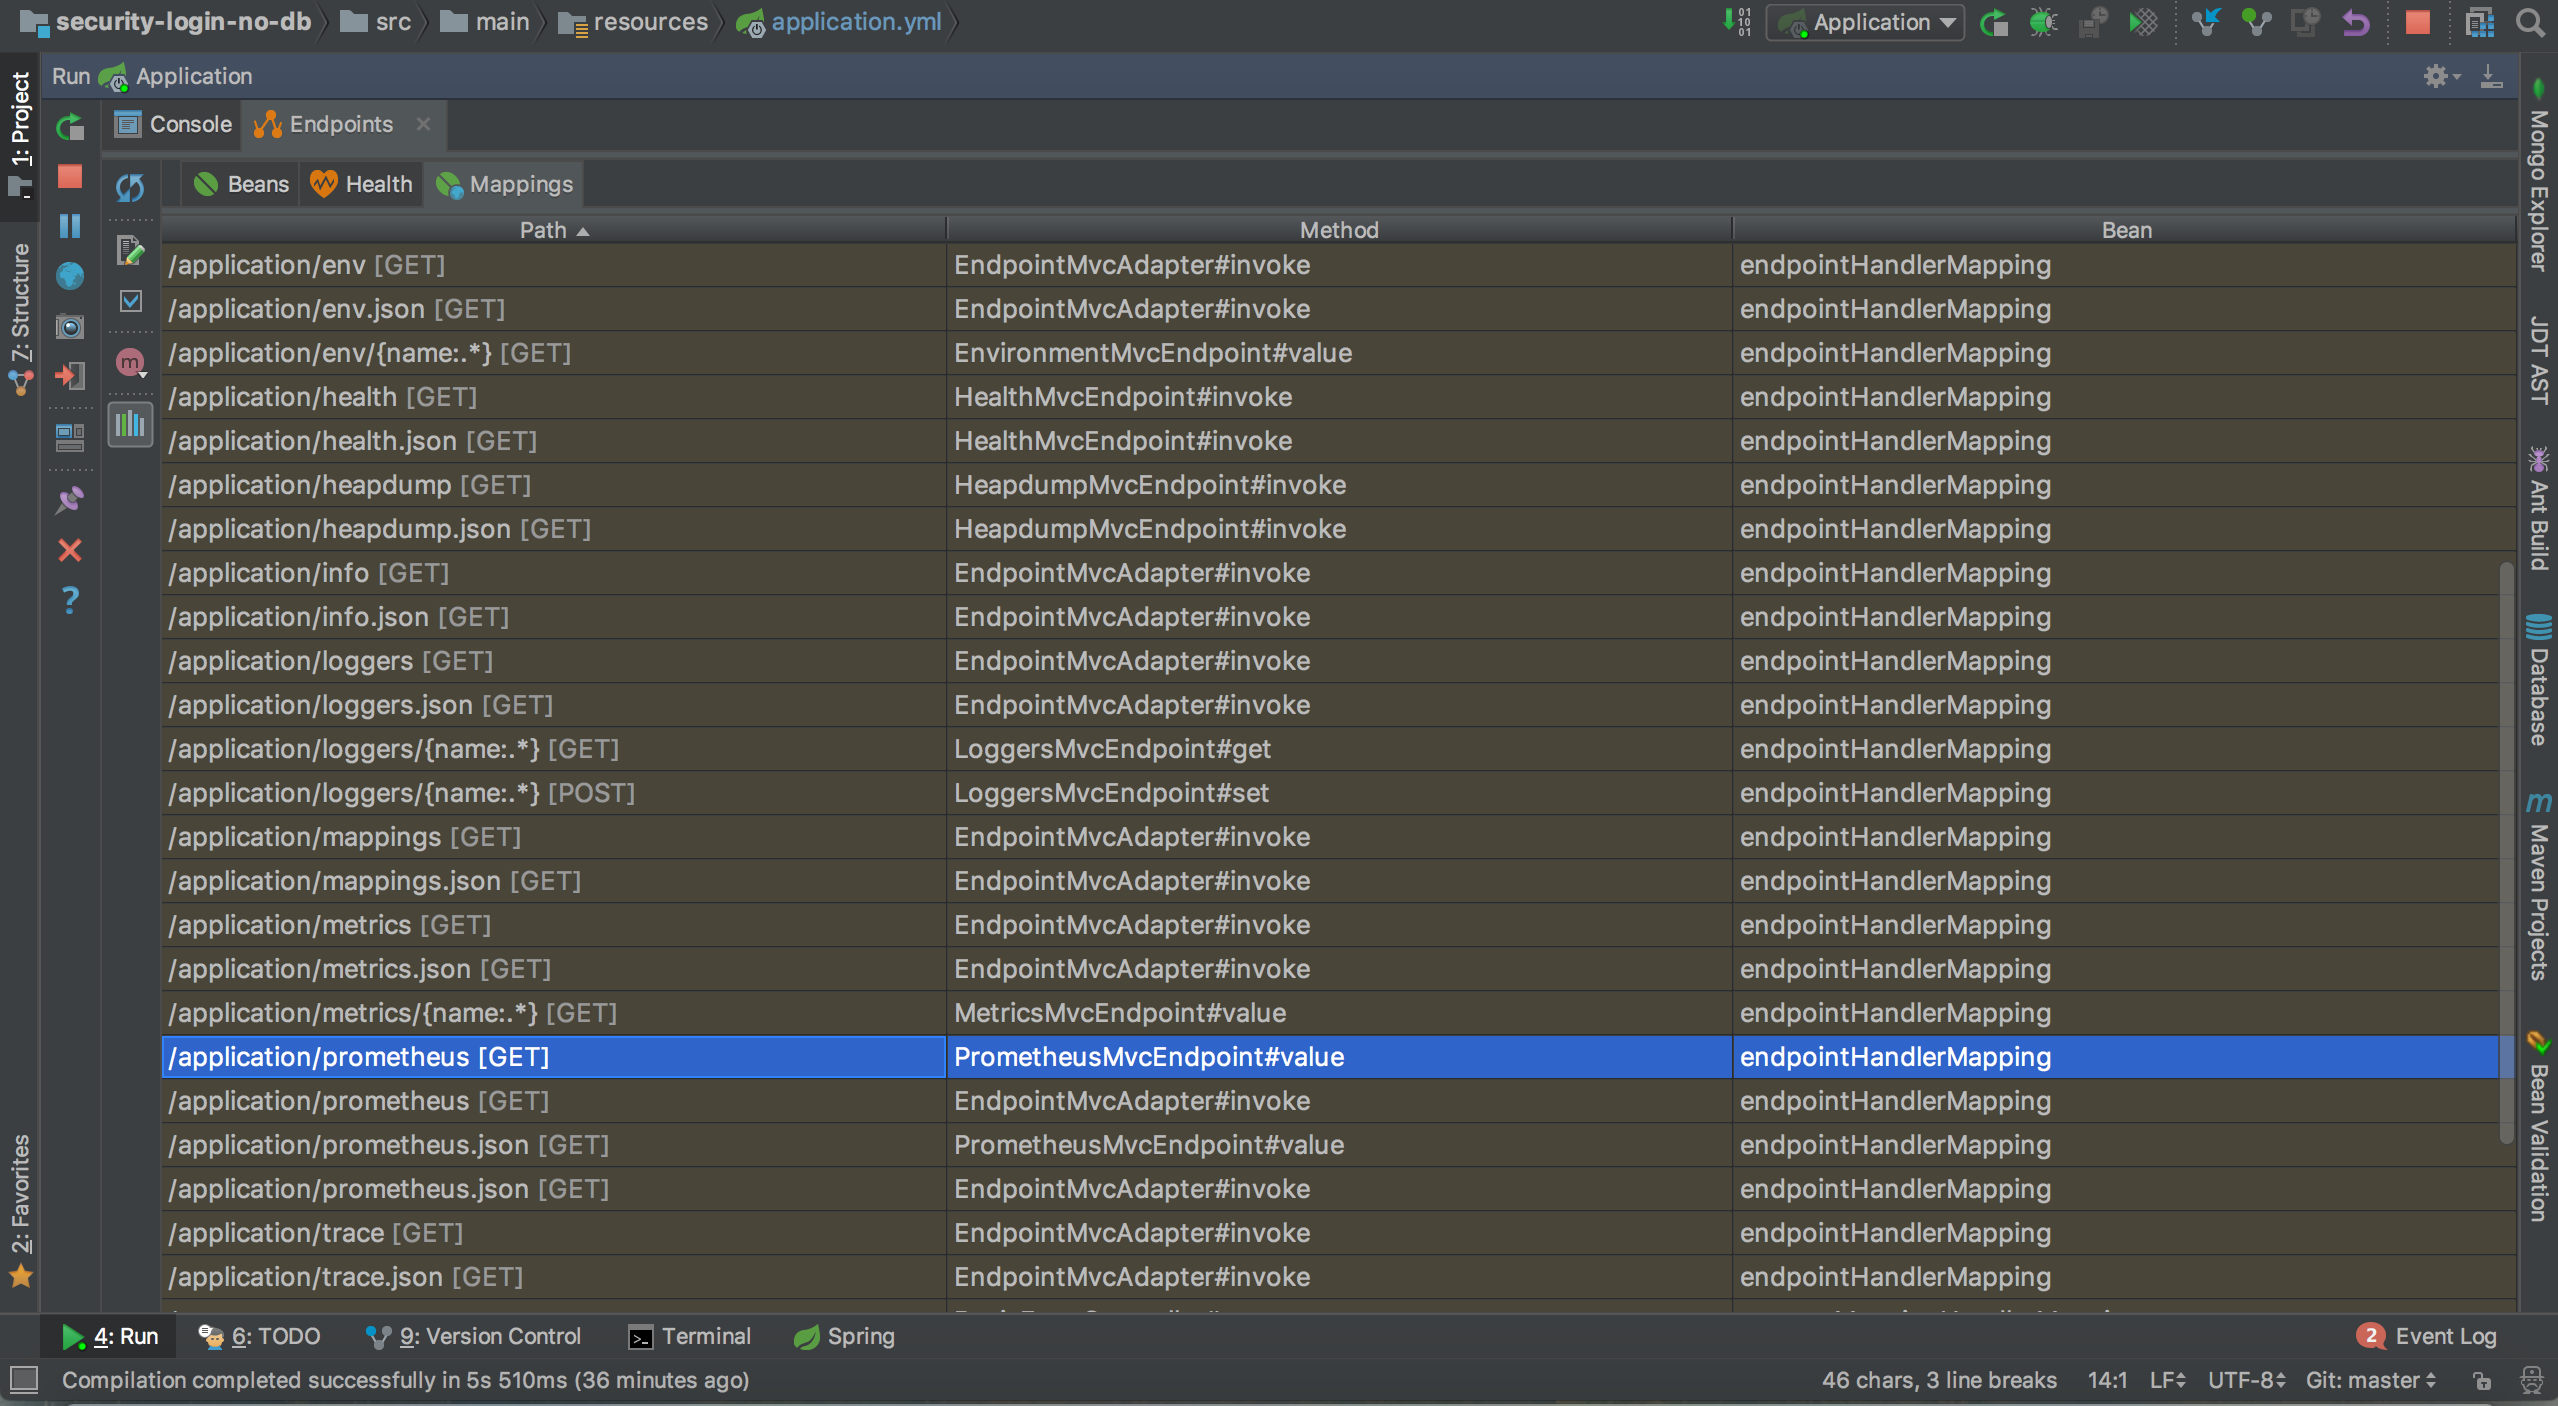
Mappings
利用账号密码访问 http://localhost:8080/application/prometheus ,可以看到 Prometheus 格式的指标数据

指标数据
2、Prometheus 采集 Spring Boot 指标数据
首先,获取 Prometheus 的 Docker 镜像:
$ docker pull prom/prometheus
然后,编写配置文件 prometheus.yml :
global:

  scrape_interval: 10s

  scrape_timeout: 10s

  evaluation_interval: 10m

scrape_configs:

  - job_name: spring-boot

    scrape_interval: 5s

    scrape_timeout: 5s

    metrics_path: /application/prometheus

    scheme: http

    basic_auth:

      username: user

      password: pwd

    static_configs:

      - targets:

        - 127.0.0.1:8080  #此处填写 Spring Boot 应用的 IP + 端口号
接着,启动 Prometheus :
$ docker run -d \

--name prometheus \

-p 9090:9090 \

-m 500M \

-v "$(pwd)/prometheus.yml":/prometheus.yml \

-v "$(pwd)/data":/data \

prom/prometheus \

-config.file=/prometheus.yml \

-log.level=info
最后,访问 http://localhost:9090/targets , 检查 Spring Boot 采集状态是否正常。

采集状态
3、Grafana 可视化监控数据
首先,获取 Grafana 的 Docker 镜像:
$ docker pull grafana/grafana
然后,启动 Grafana:
$ docker run --name grafana -d -p 3000:3000 grafana/grafana
接着,访问 http://localhost:3000/ 配置 Prometheus 数据源:
Grafana 登录账号 admin 密码 admin

配置 DataSource
最后,配置单个指标的可视化监控面板:
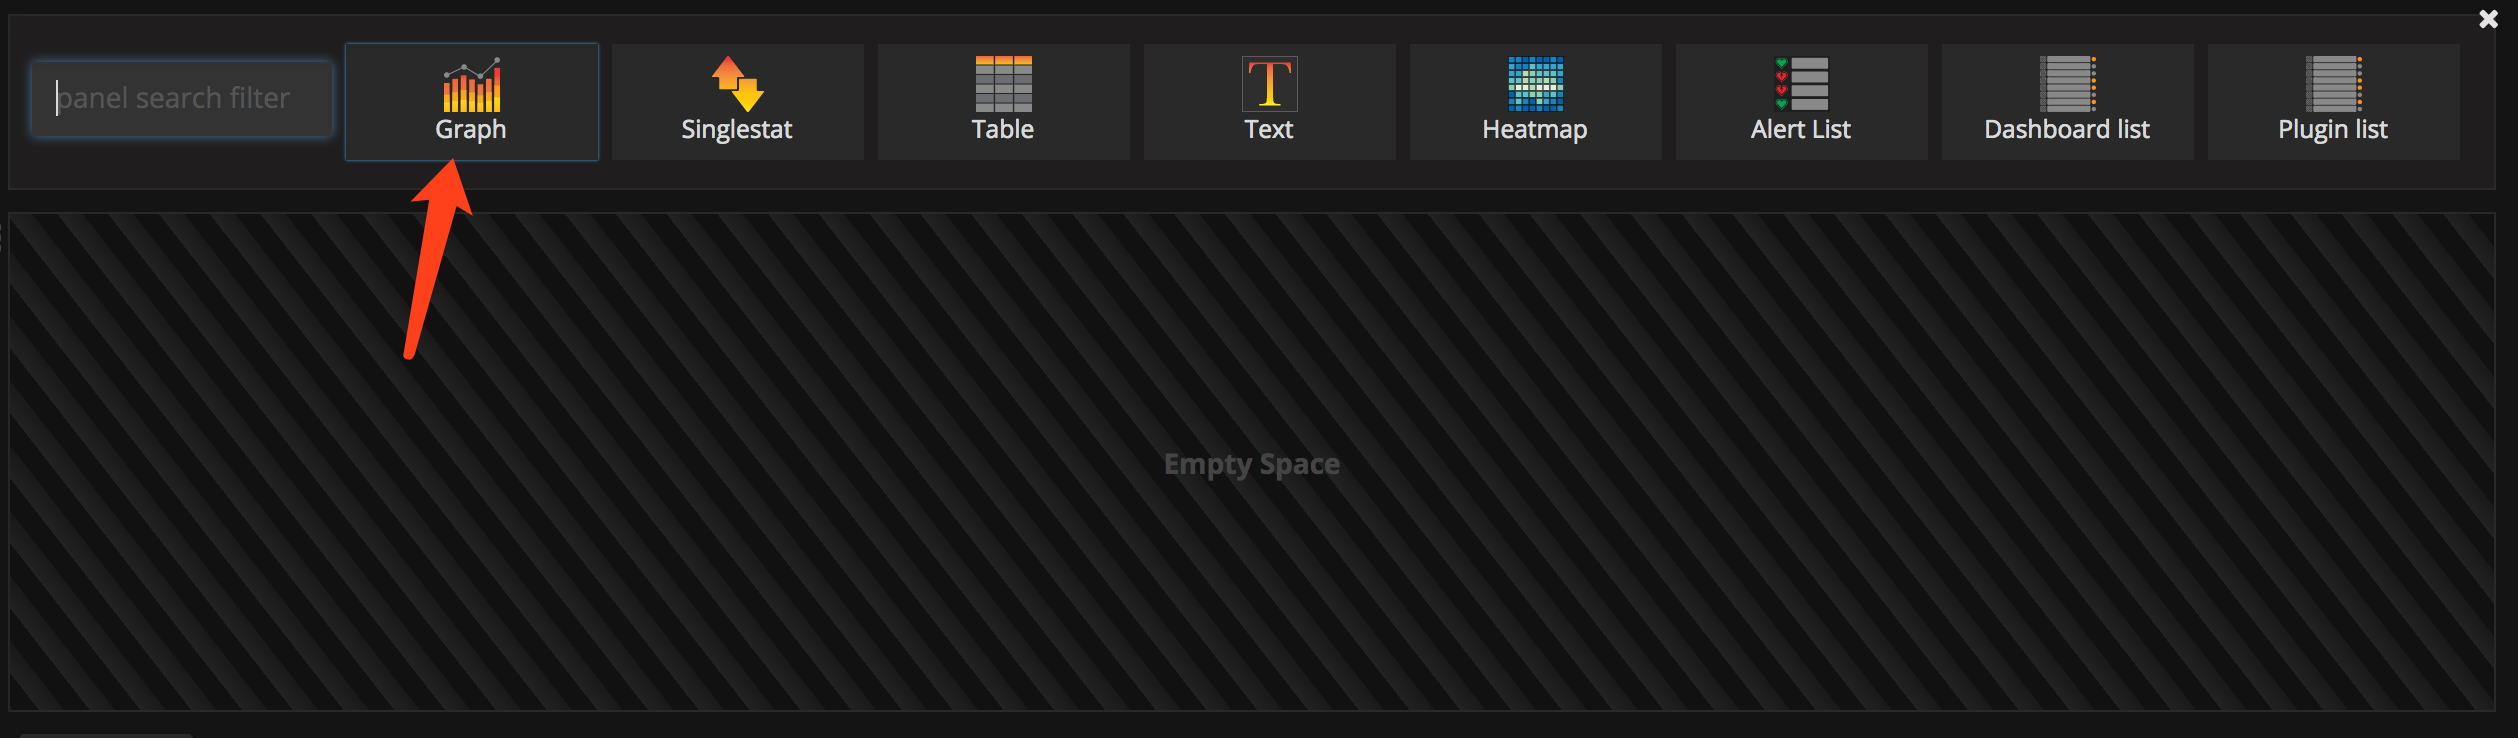
选择 Graph
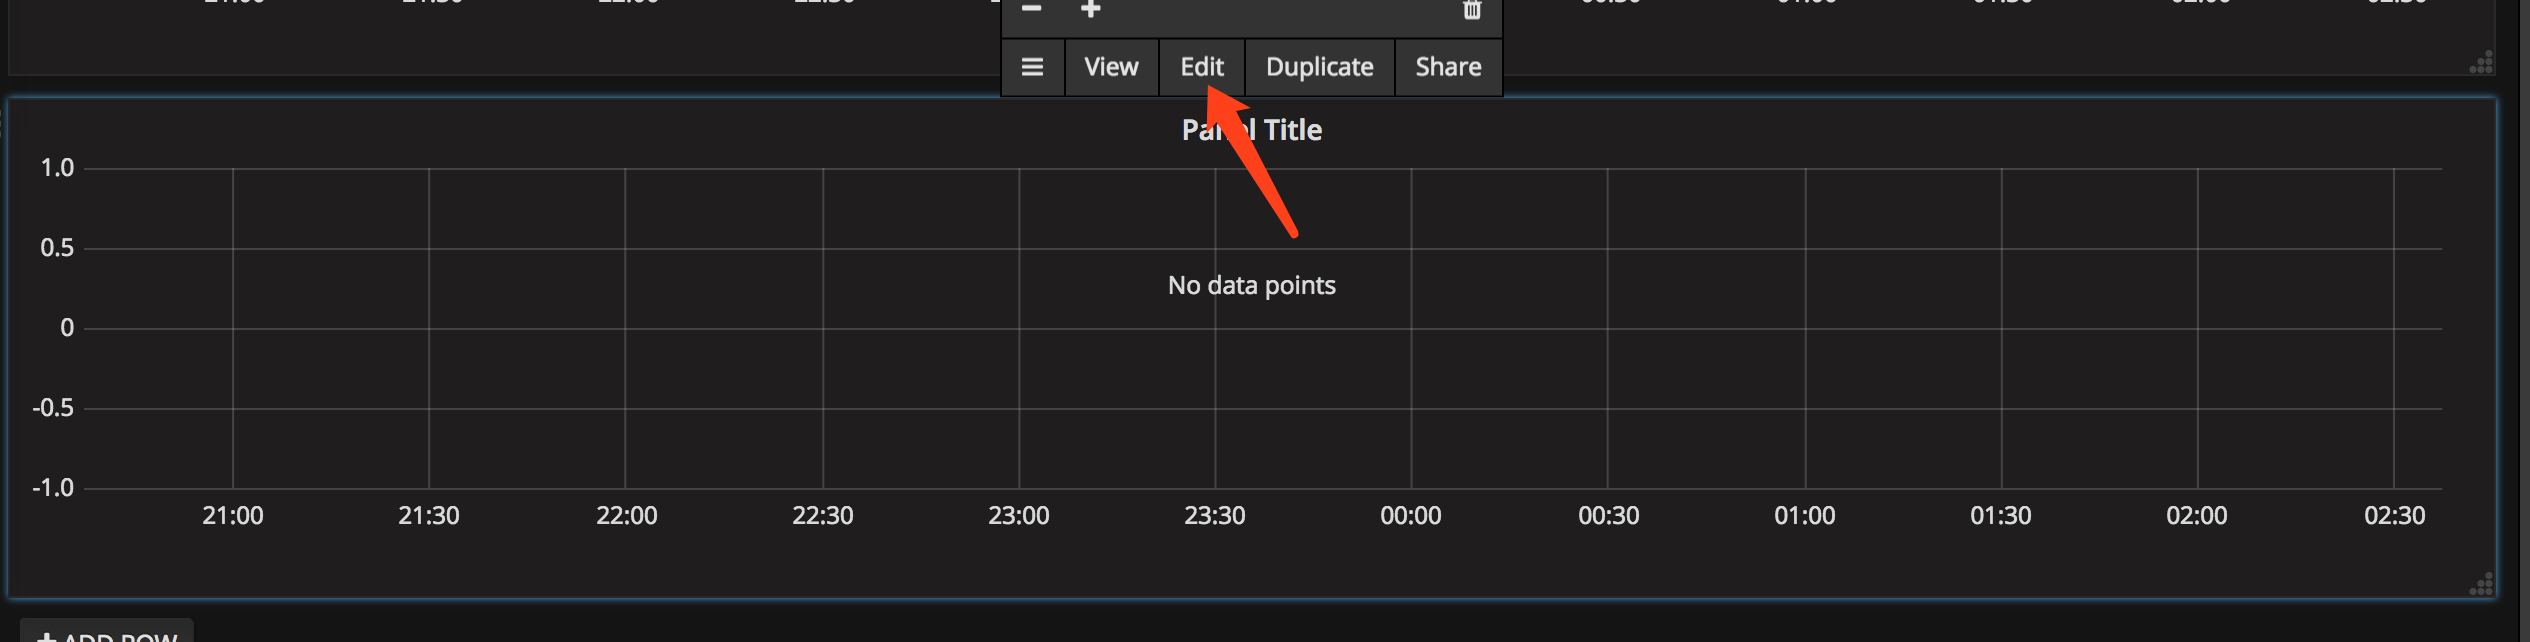
编辑
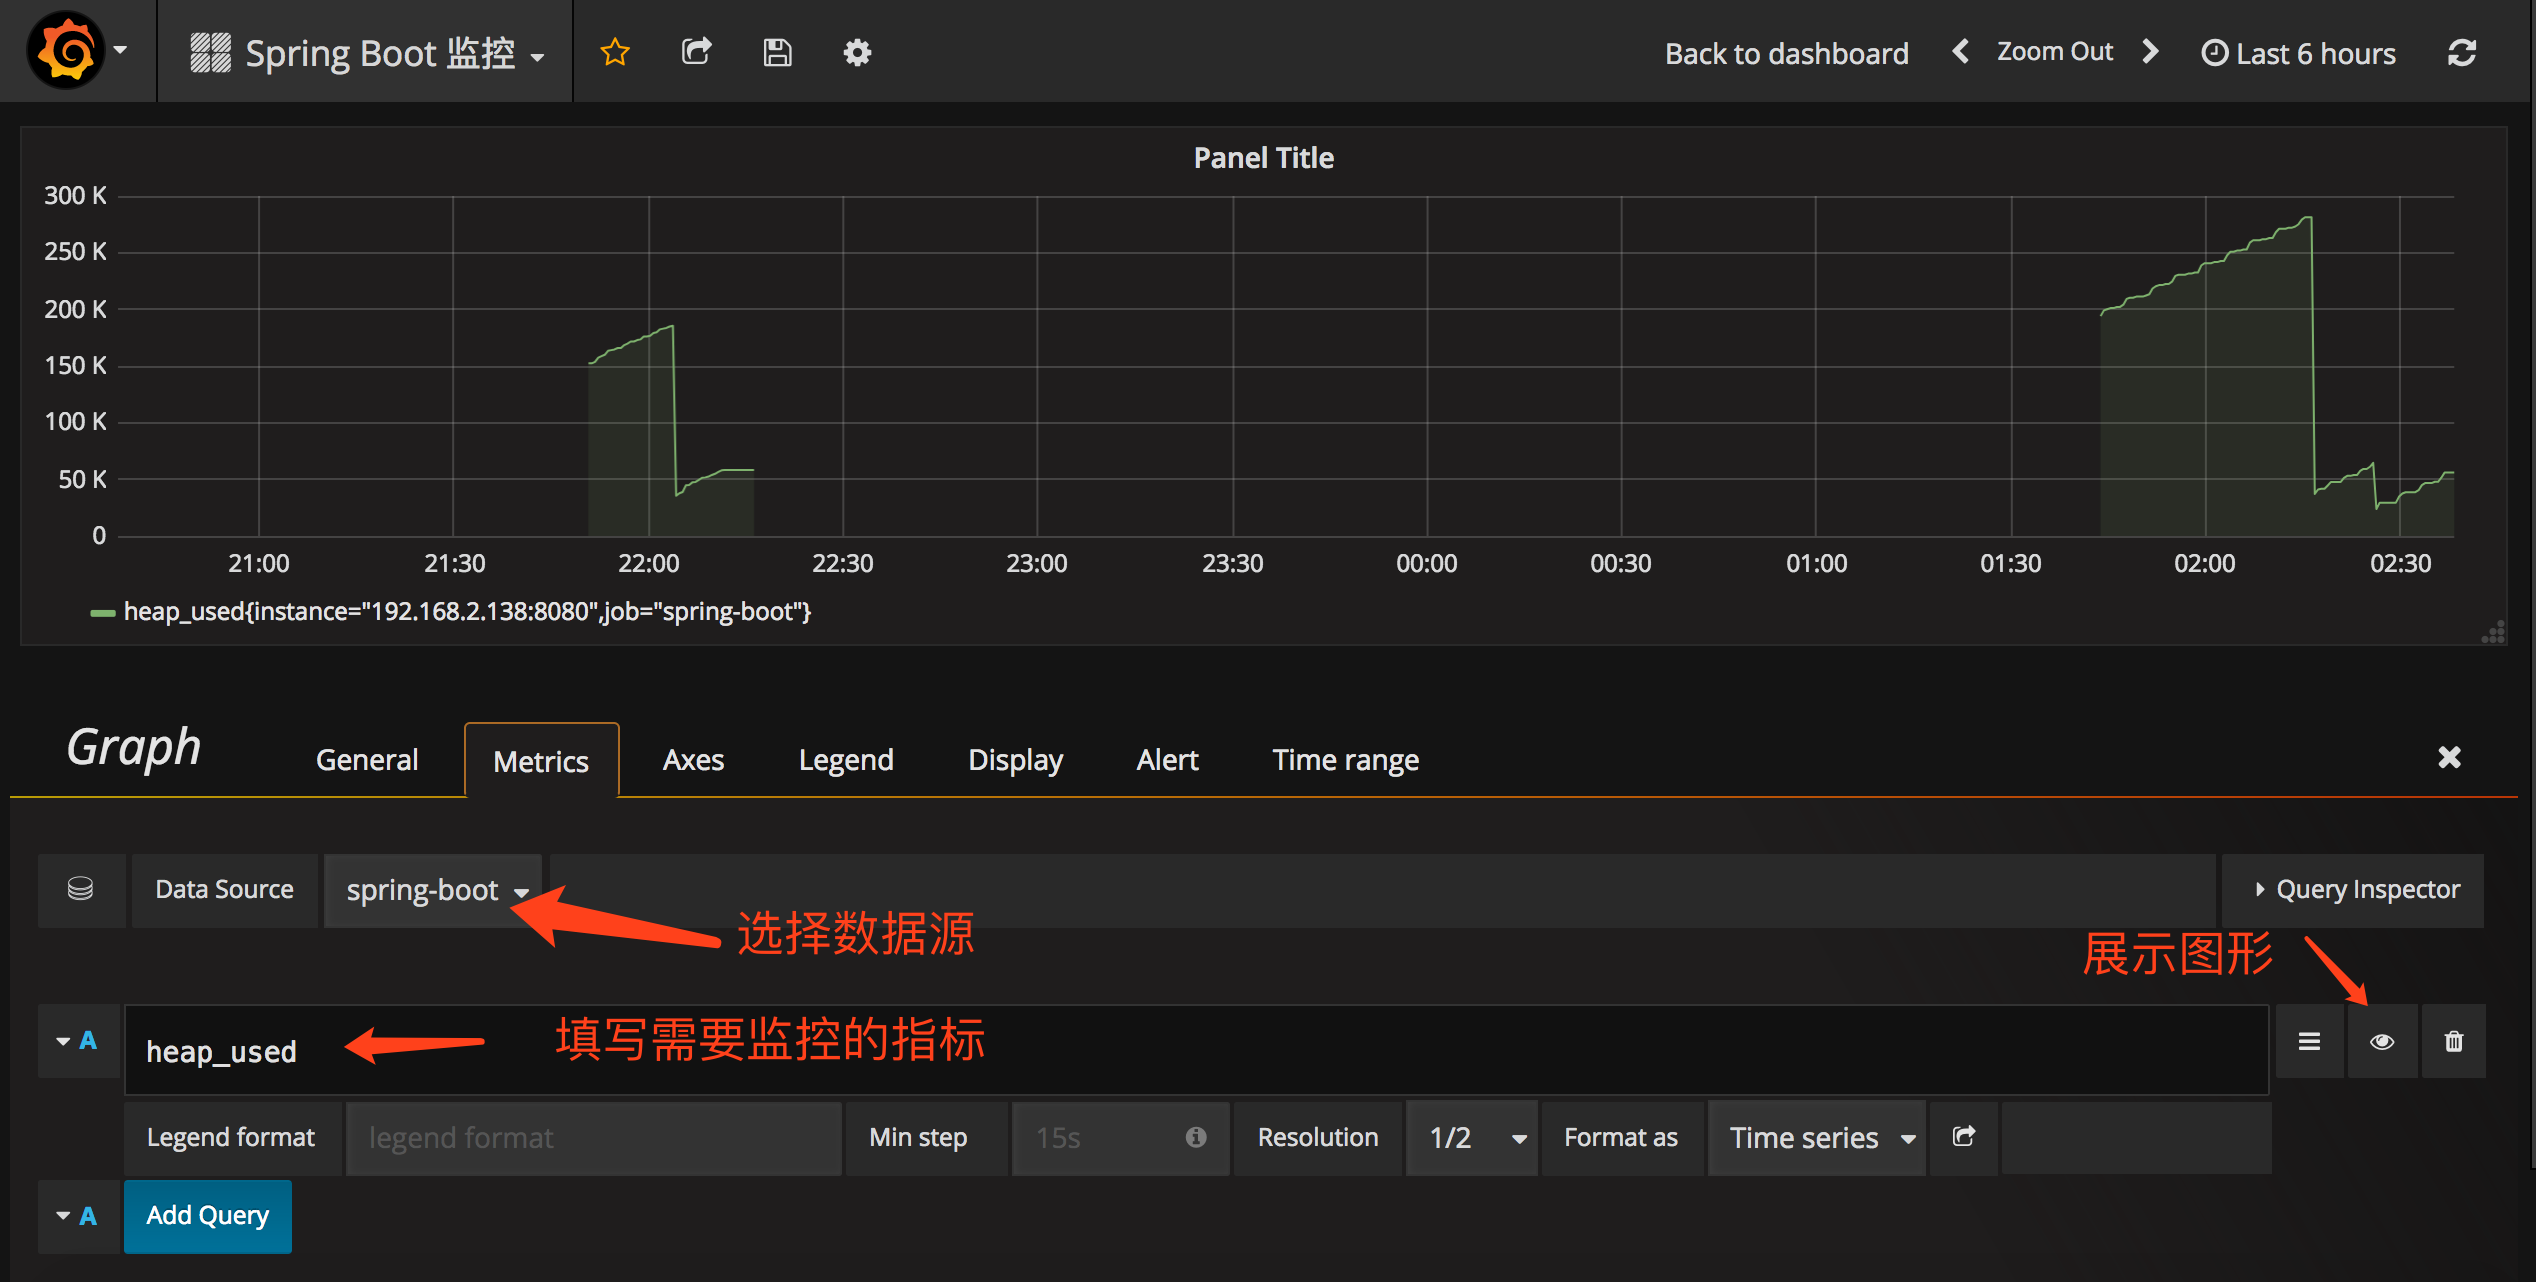
配置需要监控的指标
提示,此处不能任意填写,只能填已有的指标点,具体的可以在 Prometheus 的首页看到,即 http://localhost:9090/graph
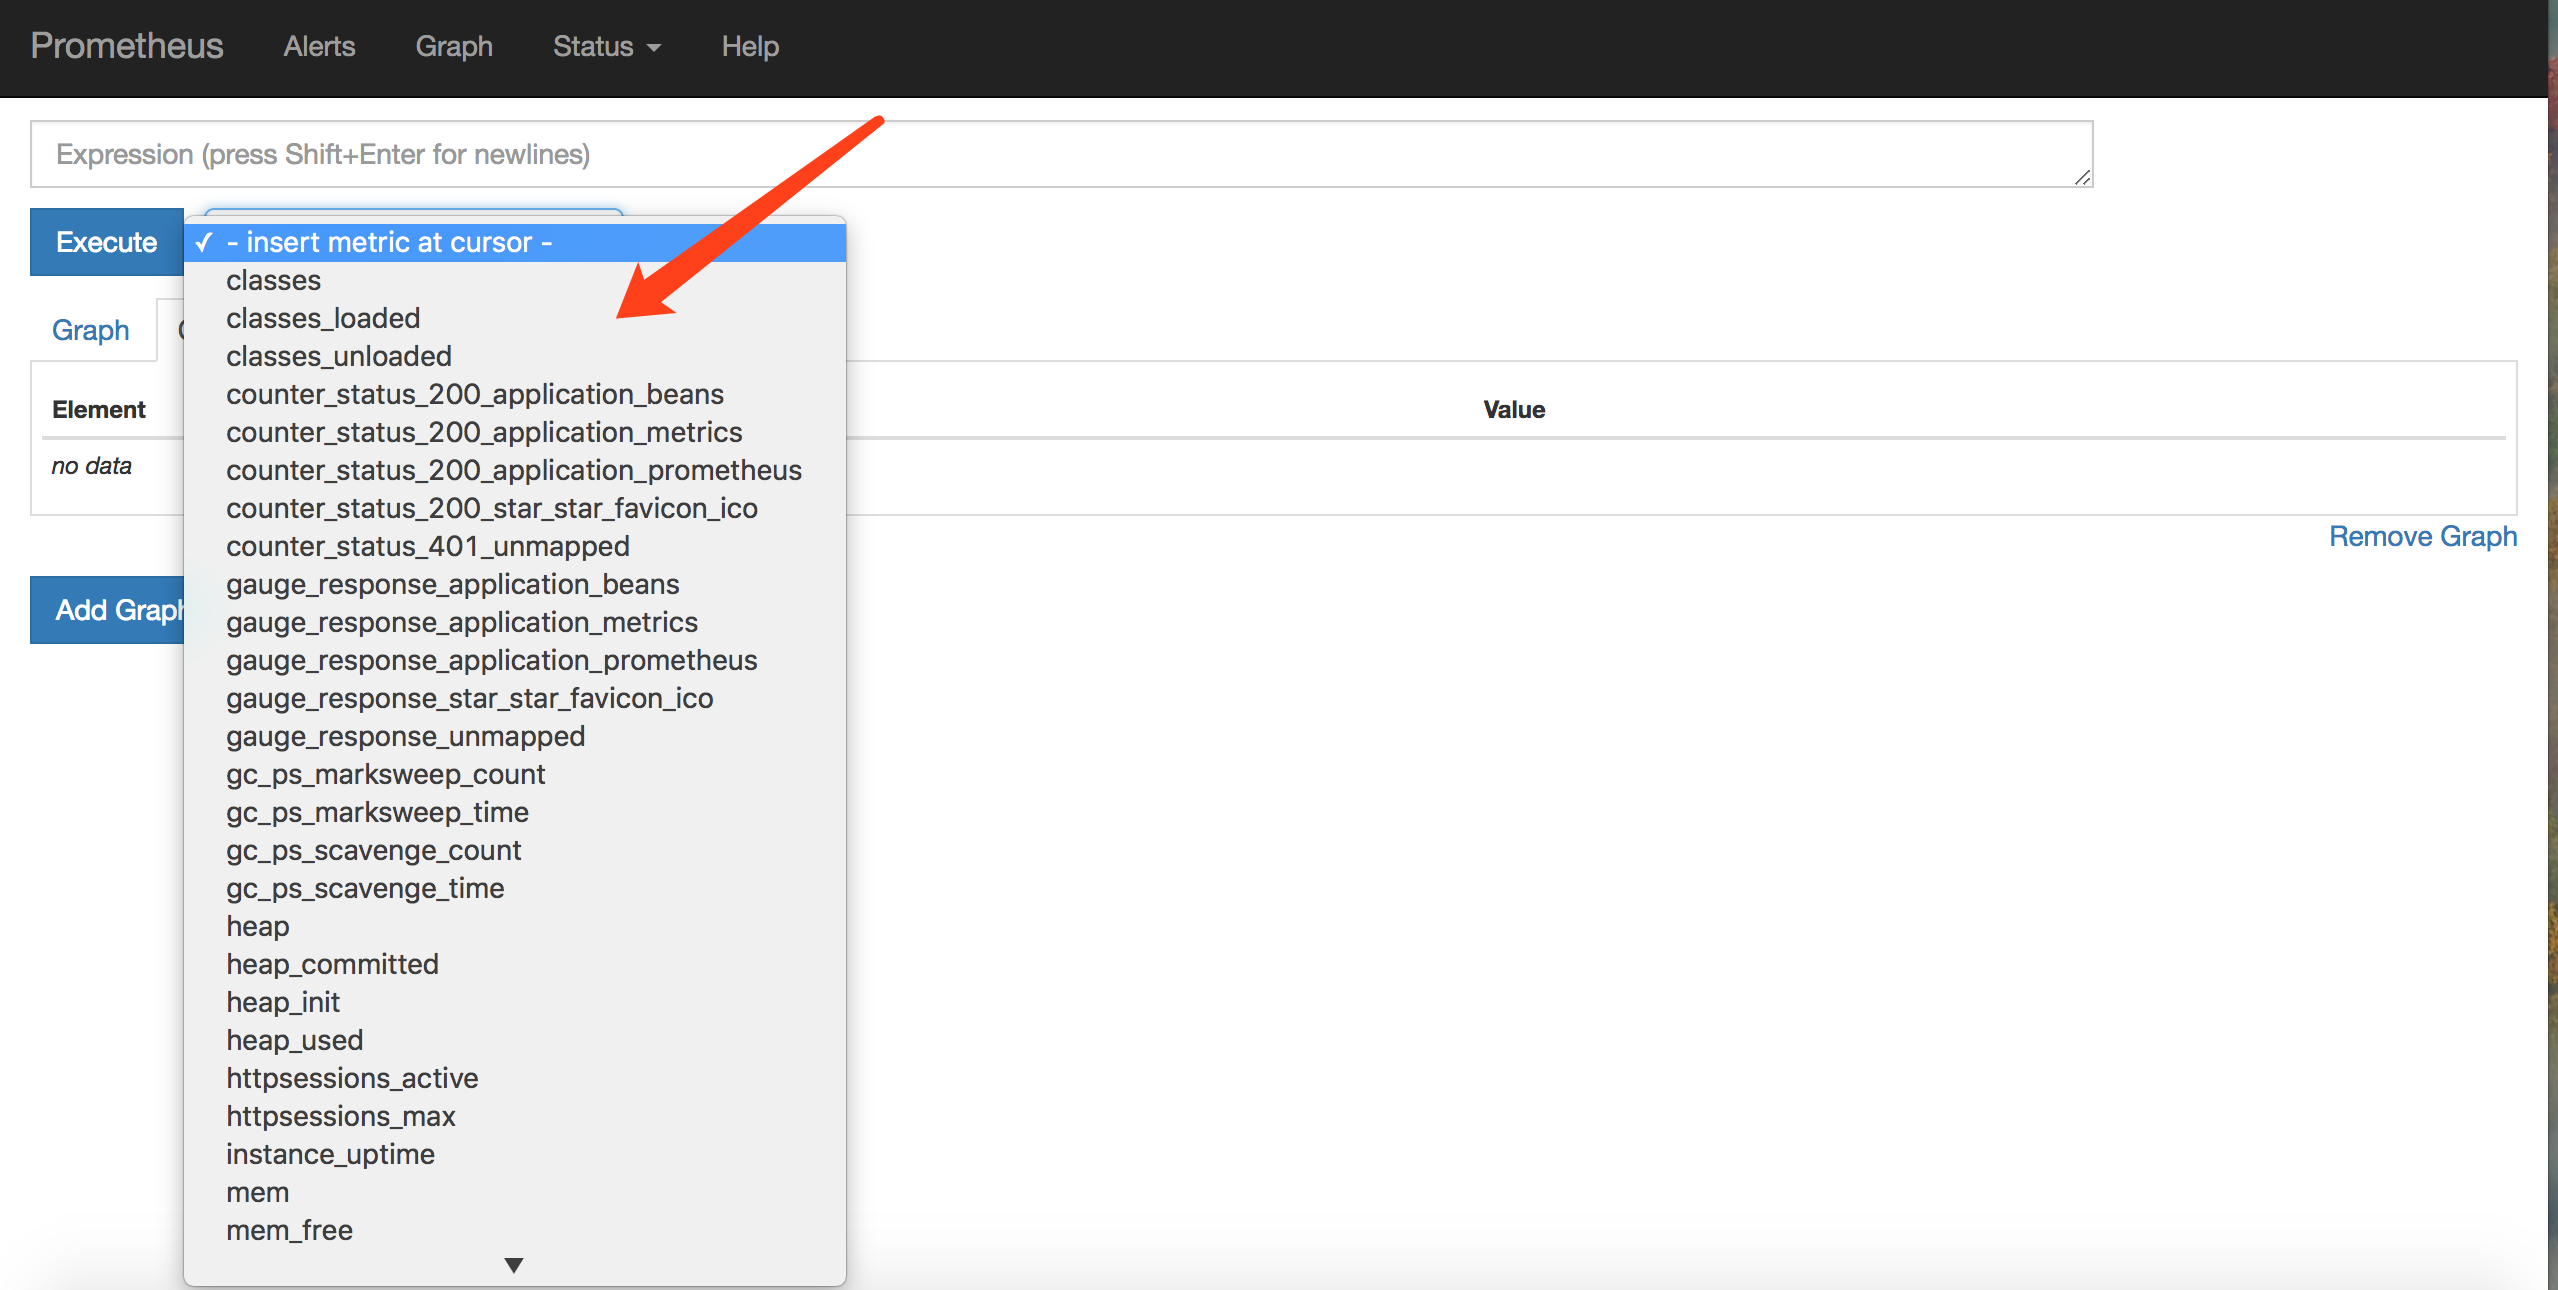
指标
多配置几个指标之后,即可有如下效果:
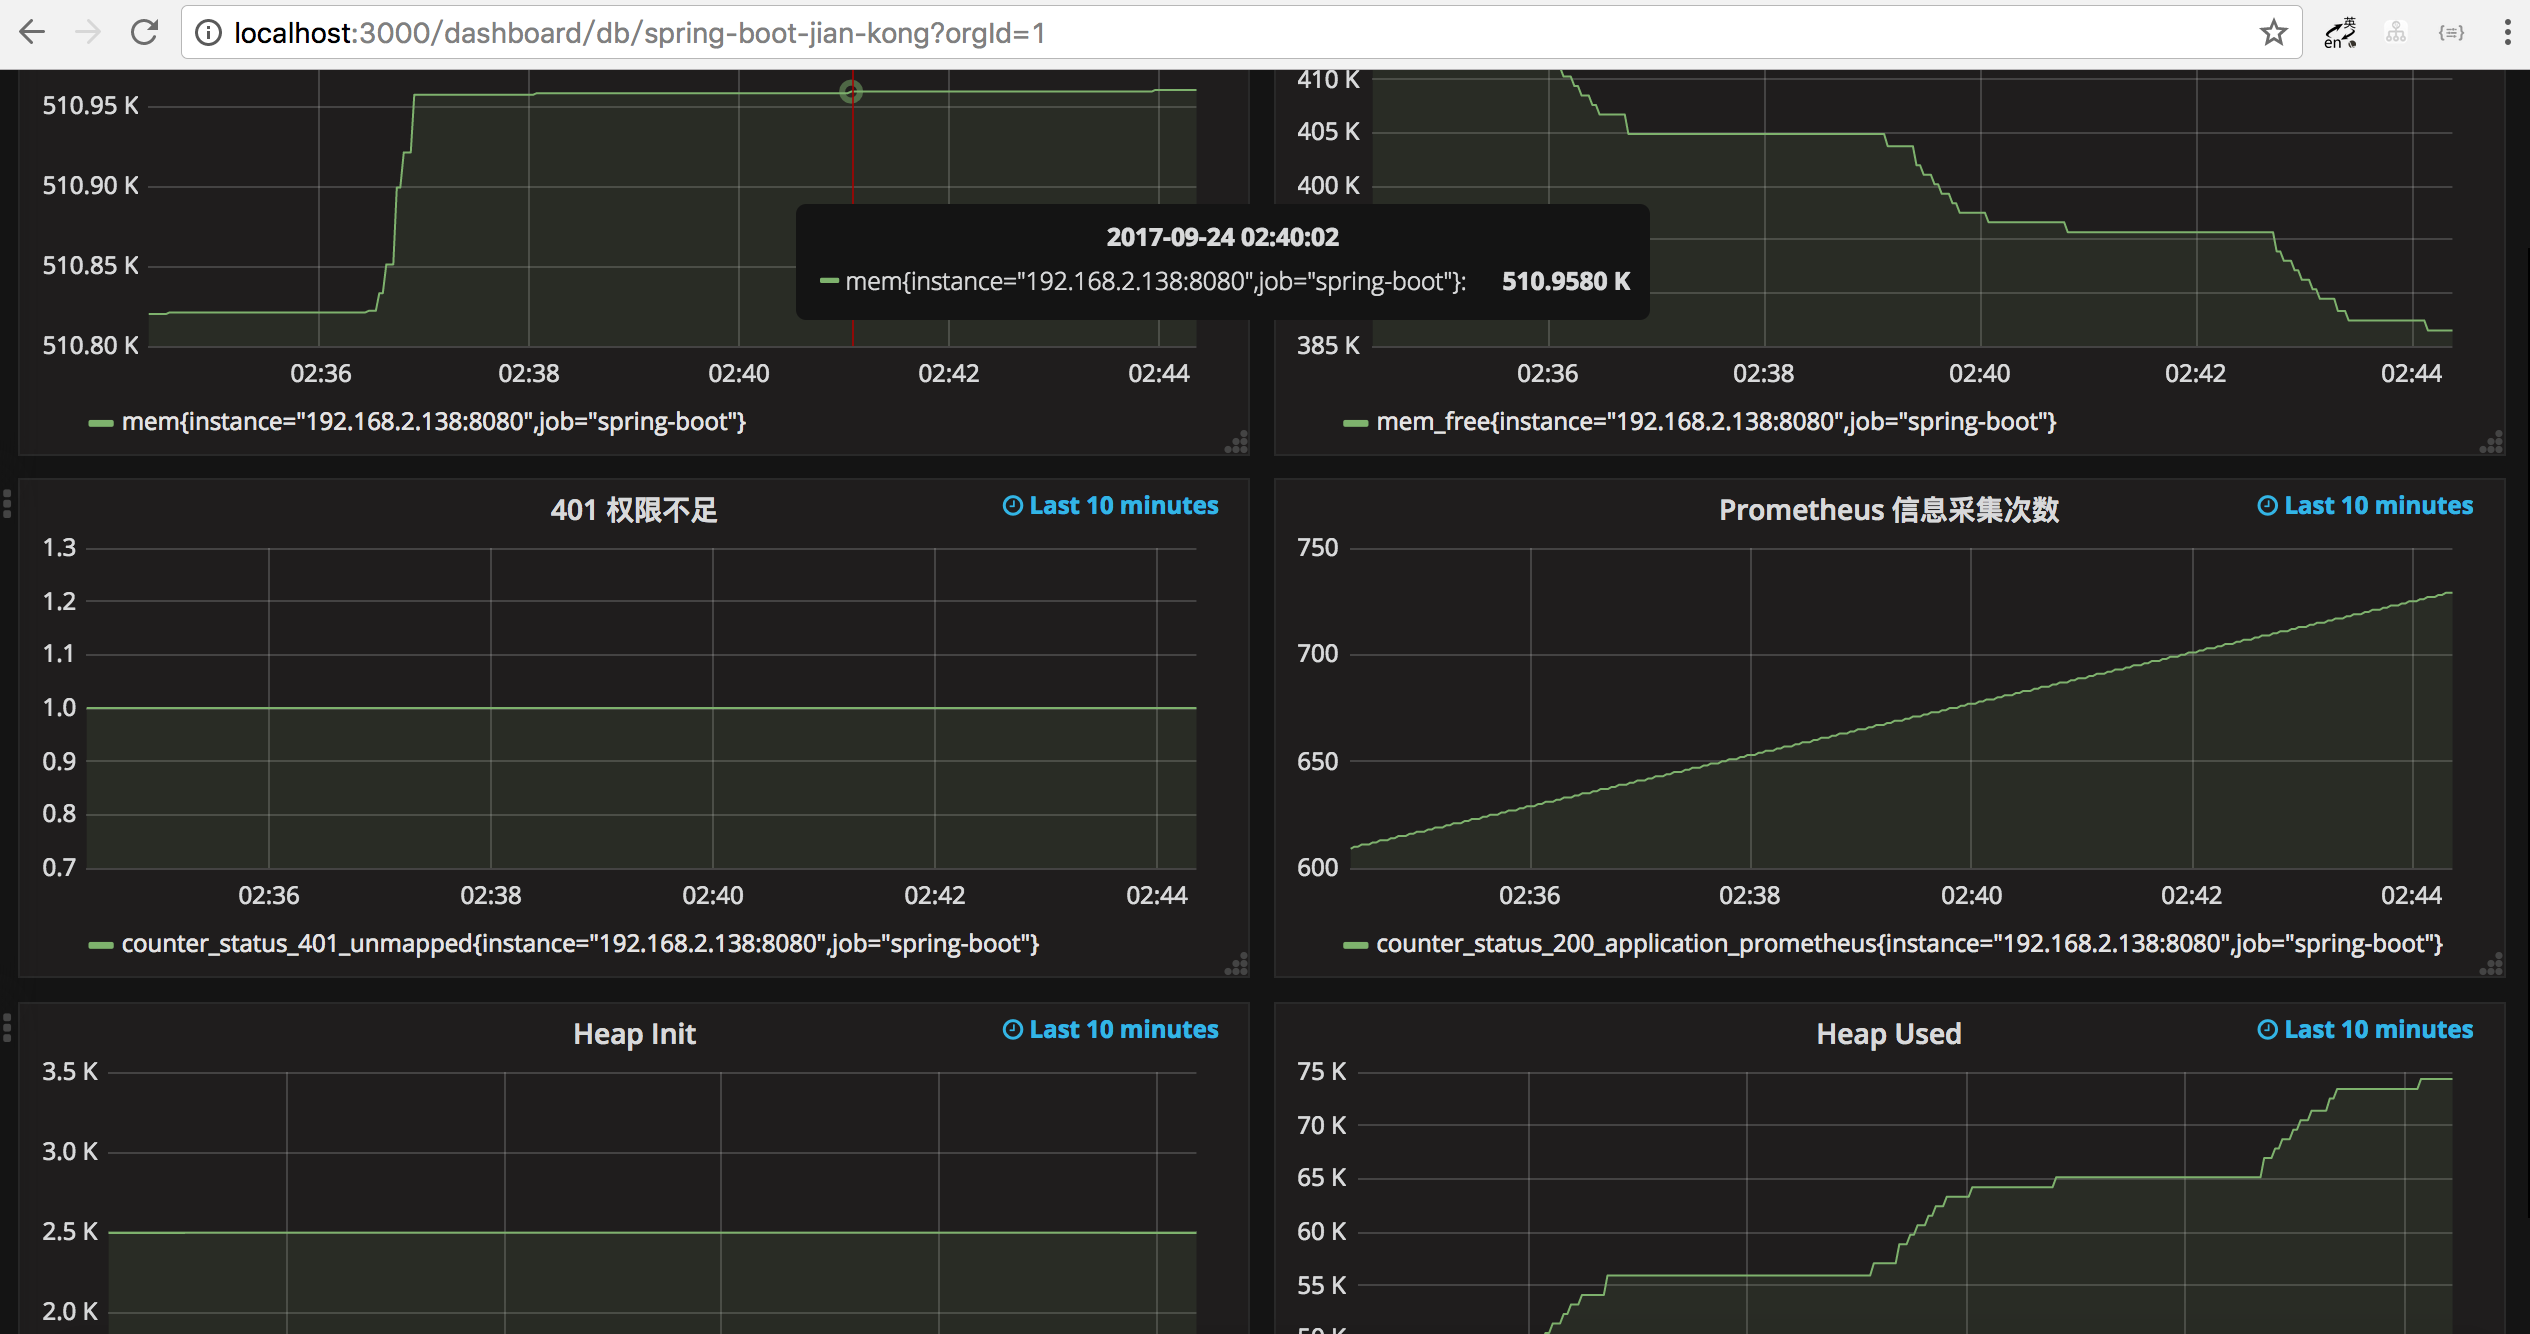
Grafana 监控界面
参考文档
© 著作权归作者所有,转载或内容合作请联系作者

本文由博客一文多发平台 OpenWrite 发布!
拒绝黑盒应用-Spring Boot 应用可视化监控的更多相关文章
- 微服务监控之三:Prometheus + Grafana Spring Boot 应用可视化监控
一.Springboot增加Prometheus 1.Spring Boot 应用暴露监控指标,添加如下依赖 <dependency> <groupId>org.springf ...
- (转)Spring Boot(二十):使用 spring-boot-admin 对 Spring Boot 服务进行监控
http://www.ityouknow.com/springboot/2018/02/11/spring-boot-admin.html 上一篇文章<Spring Boot(十九):使用 Sp ...
- Spring Boot Admin2.X监控的服务context-path问题
在使用Spring Boot Admin进行监控时,如果被监控的服务没有加context-path的话是不会有任何问题的,一旦服务加了context-path的配置,监控就会失败. 下图是正常情况的显 ...
- Spring Boot 2.x监控数据可视化(Actuator + Prometheus + Grafana手把手)
TIPS 本文基于Spring Boot 2.1.4,理论支持Spring Boot 2.x所有版本 众所周知,Spring Boot有个子项目Spring Boot Actuator,它为应用提供了 ...
- Spring Cloud第十三篇 | Spring Boot Admin服务监控
本文是Spring Cloud专栏的第十三篇文章,了解前十二篇文章内容有助于更好的理解本文: Spring Cloud第一篇 | Spring Cloud前言及其常用组件介绍概览 Spring Clo ...
- spring boot/cloud 应用监控
应用的监控功能,对于分布式系统非常重要.如果把分布式系统比作整个社会系统.那么各个服务对应社会中具体服务机构,比如银行.学校.超市等,那么监控就类似于警察局和医院,所以其重要性显而易见.这里说的,监控 ...
- spring Boot 学习(八、Spring Boot与与监控管理)
一.监控管理通过引入spring-boot-starter-actuator,可以使用Spring Boot为我们提供的准 生产环境下的应用监控和管理功能.我们可以通过HTTP,JMX,SSH协议来进 ...
- Spring Boot配置druid监控页功能
1.导入坐标 <?xml version="1.0" encoding="UTF-8"?> <project xmlns="http ...
- 基于spring boot admin 做监控的一些问题记录
问题一 各个健康节点权限问题 解决方式 加入权限模块 <dependency> <groupId>org.springframework.boot</groupId> ...
随机推荐
- mysql修改数据库的存储引擎(InnoDB)
查看当前的存储引擎 show engines; 基本的差别:MyISAM类型不支持事务处理等高级处理,而InnoDB类型支持.MyISAM类型的表强调的是性能,其执行数度比InnoDB类型更快,但是不 ...
- python的元组存储的实质和多元赋值
python中有一种赋值机制即多元赋值,采用这种方式赋值时,等号两边的对象都是元组并且元组的小括号是可选的.通常形式为 x, y, z = 1, 2, 'a string' 等同于 (x, y, z) ...
- Spring boot 梳理 -@SpringBootApplication、@EnableAutoConfiguration与(@EnableWebMVC、WebMvcConfigurationSupport,WebMvcConfigurer和WebMvcConfigurationAdapter)
@EnableWebMvc=继承DelegatingWebMvcConfiguration=继承WebMvcConfigurationSupport 直接看源码,@EnableWebMvc实际上引入一 ...
- thymeleaf 将后端绑定数据直接传递js变量
根据自我需求,thymeleaf可以直接将后端数据传递给js中进行使用,例如: 1.后端接口数据: @Controllerpublic class TestController { @RequestM ...
- 【ADO.NET基础-Regidter】简单的账户注册界面和源代码(可用于简单面试基础学习用)
在阅读时如有问题或者建议,欢迎指出和提问,我也是初学者......... 前台代码: <!DOCTYPE html> <html xmlns="http://www.w3. ...
- 如何使用CSS实现居中
前言: 这一篇主要是翻译 <how-to-center-anything-with-css>这一篇文章的主要内容,再加上自己的一些概括理解:主要问题是解决垂直居中的问题.我们知道实现水平居 ...
- go语言标准库之http/template
html/template包实现了数据驱动的模板,用于生成可对抗代码注入的安全HTML输出.它提供了和text/template包相同的接口,Go语言中输出HTML的场景都应使用text/templa ...
- [PHP] php, apache, VS Code安装与配置
1. 下载
- JAVA错误提示:The operation is not applicable to the current selection.Select a field which is not declared as type variable or a type that declares such fields.
平时没怎么注意,今天用Eclipse自动生成Set Get方法时提示错误,错误信息如下: The operation is not applicable to the current selectio ...
- 终端-Linux命令之非交互SSH密码验证-Sshpass
Sshpass是使用SSH所谓的"交互式键盘密码身份验证"以非交互方式执行密码身份验证的工具 通俗来说就是 使用ssh密码登录 是需要在连接时手动输入密码的,没办法明文连接,如下图 ...