微服务监控之三:Prometheus + Grafana Spring Boot 应用可视化监控
一、Springboot增加Prometheus
1、Spring Boot 应用暴露监控指标,添加如下依赖
<dependency>

    <groupId>org.springframework.boot</groupId>

    <artifactId>spring-boot-starter-actuator</artifactId>

</dependency>

<dependency>

    <groupId>io.prometheus</groupId>

    <artifactId>simpleclient_spring_boot</artifactId>

    <version>0.0.26</version>

</dependency>
    compile 'org.springframework.boot:spring-boot-starter-actuator'

    compile 'io.prometheus:simpleclient_spring_boot:0.0.26'
2、然后,在启动类 Application.java 添加如下注解:
@SpringBootApplication

@EnablePrometheusEndpoint

@EnableSpringBootMetricsCollector

public class Application {

    public static void main(String[] args) {

        SpringApplication.run(Application.class, args);

    }

}
3、配置文件设置
在application.xml里设置属性:spring.metrics.servo.enabled=false,

去掉重复的metrics,不然在prometheus的控制台的targets页签里,会一直显示此endpoint为down状态。
#应用可视化监控

management.security.enabled=false

spring.metrics.servo.enabled=false
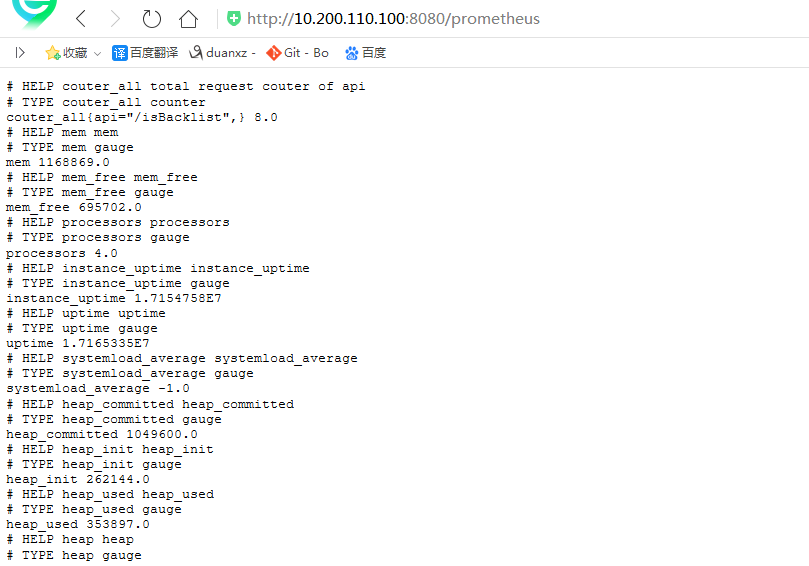
4、访问:http://192.168.10.213:6010/prometheus,可以看到 Prometheus 格式的指标数据
二、自定义prometheus注解
2.1、自定义prometheus注解
import java.lang.annotation.*;

@Target(ElementType.METHOD)

@Retention(RetentionPolicy.RUNTIME)

@Documented

public @interface PrometheusMetrics {

    /**

     * 默认为空,程序使用method signature作为Metric name 如果name有设置值,使用name作为Metric name

     *

     * @return

     */

    String name() default "";

}
2.2、自定义prometheus切面
import io.prometheus.client.Counter;

import io.prometheus.client.Histogram;

import org.apache.commons.lang3.StringUtils;

import org.aspectj.lang.ProceedingJoinPoint;

import org.aspectj.lang.annotation.Around;

import org.aspectj.lang.annotation.Aspect;

import org.aspectj.lang.annotation.Pointcut;

import org.aspectj.lang.reflect.MethodSignature;

import org.springframework.stereotype.Component;

import org.springframework.web.context.request.RequestContextHolder;

import org.springframework.web.context.request.ServletRequestAttributes;

import javax.servlet.http.HttpServletRequest;

@Aspect

@Component

public class PrometheusMetricsAspect {

    private static final Counter requestTotal = Counter.build().name("couter_all").labelNames("api")

            .help("total request couter of api").register();

    private static final Counter requestError = Counter.build().name("couter_error").labelNames("api")

            .help("response Error couter of api").register();

    private static final Histogram histogram = Histogram.build().name("histogram_consuming").labelNames("api")

            .help("response consuming of api").register();

    // 自定义Prometheus注解的全路径

    @Pointcut("@annotation(com....annotation.PrometheusMetrics)")

    public void pcMethod() {

    }

    @Around(value = "pcMethod() && @annotation(annotation)")

    public Object MetricsCollector(ProceedingJoinPoint joinPoint, PrometheusMetrics annotation) throws Throwable {

        MethodSignature methodSignature = (MethodSignature) joinPoint.getSignature();

        PrometheusMetrics prometheusMetrics = methodSignature.getMethod().getAnnotation(PrometheusMetrics.class);

        if (prometheusMetrics != null) {

            String name;

            if (StringUtils.isNotEmpty(prometheusMetrics.name())) {

                name = prometheusMetrics.name();

            } else {

                HttpServletRequest request = ((ServletRequestAttributes) RequestContextHolder.getRequestAttributes())

                        .getRequest();

                name = request.getRequestURI();

            }

            requestTotal.labels(name).inc();

            Histogram.Timer requestTimer = histogram.labels(name).startTimer();

            Object object;

            try {

                object = joinPoint.proceed();

            } catch (Exception e) {

                requestError.labels(name).inc();

                throw e;

            } finally {

                requestTimer.observeDuration();

            }

            return object;

        } else {

            return joinPoint.proceed();

        }

    }

}
2.3、被监控的方法上添加--自定义prometheus注解
    @PrometheusMetrics

    @PostMapping(value = "isBacklist")

    @ApiOperation(value = "黑名单判断", notes = "是否在黑名单中,如果存在并且记录状态为2,则为黑名单,返回true,否则返回:false")

    @Log

    public RespResult<Boolean> isBacklist(@RequestBody BacklistReqDTO reqDTO) {
三、Prometheus 采集 Spring Boot 指标数据
# my global config
global:
scrape_interval: 15s # Set the scrape interval to every seconds. Default is every minute.
evaluation_interval: 15s # Evaluate rules every seconds. The default is every minute.
# scrape_timeout is set to the global default (10s). # Alertmanager configuration
alerting:
alertmanagers:
- static_configs:
- targets:
# - alertmanager: # Load rules once and periodically evaluate them according to the global 'evaluation_interval'.
rule_files:
# - "first_rules.yml"
# - "second_rules.yml" # A scrape configuration containing exactly one endpoint to scrape:
# Here it's Prometheus itself.
scrape_configs:
# The job name is added as a label `job=<job_name>` to any timeseries scraped from this config.
- job_name: 'prometheus' # metrics_path defaults to '/metrics'
# scheme defaults to 'http'. static_configs:
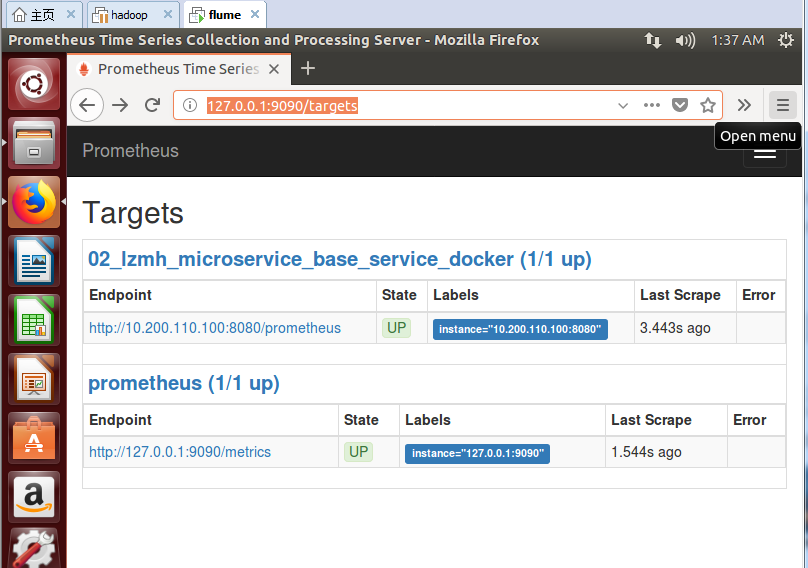
- targets: ['10.200.110.100:8080'] #此处填写 Spring Boot 应用的 IP + 端口号
docker run -d -p : \

-u root \

-v /opt/prometheus/tsdb:/etc/prometheus/tsdb \

-v /opt/prometheus/prometheus.yml:/etc/prometheus/prometheus.yml \

--privileged=true prom/prometheus \

--storage.tsdb.path=/etc/prometheus/tsdb \

--storage.tsdb.retention=7d \

--config.file=/etc/prometheus/prometheus.yml
./prometheus --config.file=prometheus2.yml
结果:
duanxz@ubuntu:~/Downloads/prometheus-2.0.0.linux-amd64$ ./prometheus --config.file=prometheus2.yml

level=info ts=2018-06-19T08:27:47.222527495Z caller=main.go:215 msg="Starting Prometheus" version="(version=2.0.0, branch=HEAD, revision=0a74f98628a0463dddc90528220c94de5032d1a0)"

level=info ts=2018-06-19T08:27:47.222895906Z caller=main.go:216 build_context="(go=go1.9.2, user=root@615b82cb36b6, date=20171108-07:11:59)"

level=info ts=2018-06-19T08:27:47.223110655Z caller=main.go:217 host_details="(Linux 4.4.0-128-generic #154~14.04.1-Ubuntu SMP Fri May 25 14:58:51 UTC 2018 x86_64 ubuntu (none))"

level=info ts=2018-06-19T08:27:47.227443134Z caller=web.go:380 component=web msg="Start listening for connections" address=0.0.0.0:9090

level=info ts=2018-06-19T08:27:47.234616341Z caller=main.go:314 msg="Starting TSDB"

level=info ts=2018-06-19T08:27:47.244932582Z caller=targetmanager.go:71 component="target manager" msg="Starting target manager..."

level=info ts=2018-06-19T08:27:47.24608357Z caller=main.go:326 msg="TSDB started"

level=info ts=2018-06-19T08:27:47.246514727Z caller=main.go:394 msg="Loading configuration file" filename=prometheus2.yml

level=info ts=2018-06-19T08:27:47.247799187Z caller=main.go:371 msg="Server is ready to receive requests."
四、Grafana 可视化监控数据
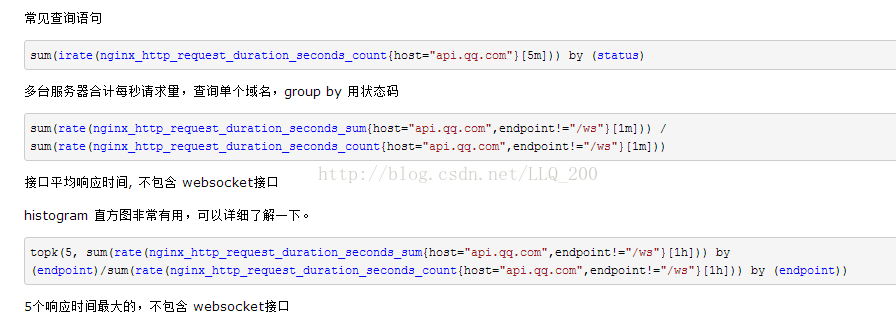
五、常用Prometheus 表达式
参考:http://www.spring4all.com/article/265
微服务监控之三:Prometheus + Grafana Spring Boot 应用可视化监控的更多相关文章
- Spring Boot 微服务应用集成Prometheus + Grafana 实现监控告警
Spring Boot 微服务应用集成Prometheus + Grafana 实现监控告警 一.添加依赖 1.1 Actuator 的 /prometheus端点 二.Prometheus 配置 部 ...
- 拒绝黑盒应用-Spring Boot 应用可视化监控
图文简介 逻辑关系 效果演示 快速开始 1.Spring Boot 应用暴露监控指标[版本 1.5.7.RELEASE] 首先,添加依赖如下依赖: <dependency> <gro ...
- 【微框架】之一:从零开始,轻松搞定SpringCloud微服务系列--开山篇(spring boot 小demo)
Spring顶级框架有众多,那么接下的篇幅,我将重点讲解SpringCloud微框架的实现 Spring 顶级项目,包含众多,我们重点学习一下,SpringCloud项目以及SpringBoot项目 ...
- 谁才是微服务赢家:Quarkus 与 Spring Boot
在容器时代("Docker 时代")Java 仍然处于领先地位,但哪个更好?Spring Boot 还是 Quarkus? 谁会最先进的?Spring Boot 或 Quarkus ...
- Spring Boot 2.x监控数据可视化(Actuator + Prometheus + Grafana手把手)
TIPS 本文基于Spring Boot 2.1.4,理论支持Spring Boot 2.x所有版本 众所周知,Spring Boot有个子项目Spring Boot Actuator,它为应用提供了 ...
- 从实践出发:微服务布道师告诉你Spring Cloud与Spring Boot他如何选择
背景 随着公司业务量的飞速发展,平台面临的挑战已经远远大于业务,需求量不断增加,技术人员数量增加,面临的复杂度也大大增加.在这个背景下,平台的技术架构也完成了从传统的单体应用到微服务化的演进. 系统架 ...
- Springboot监控之二:Spring Boot Admin对Springboot服务进行监控
概述 Spring Boot 监控核心是 spring-boot-starter-actuator 依赖,增加依赖后, Spring Boot 会默认配置一些通用的监控,比如 jvm 监控.类加载.健 ...
- 从实践出发:微服务布道师告诉你Spring Cloud与Boot他如何选择
背景 随着公司业务量的飞速发展,平台面临的挑战已经远远大于业务,需求量不断增加,技术人员数量增加,面临的复杂度也大大增加.在这个背景下,平台的技术架构也完成了从传统的单体应用到微服务化的演进. 系统架 ...
- Spring Boot Admin2.X监控的服务context-path问题
在使用Spring Boot Admin进行监控时,如果被监控的服务没有加context-path的话是不会有任何问题的,一旦服务加了context-path的配置,监控就会失败. 下图是正常情况的显 ...
随机推荐
- hdu2426
题解: KM模板题 如果n>m,输出-1 如果a[match[i]][i]==-1输出-1 负的边不用考虑 初始都赋值为-1 代码: #include<cstdio> #includ ...
- 决定整理一下canvas的基础学习
好久没有用过canvas,都要忘完了.还是决定复习一下以前的笔记,以及整理一下笔记,以后好查阅
- 将django的admin后台界面改为中文
很简单,直接修改settings配置文件的以下3项(django==1.9). LANGUAGE_CODE = 'zh-hans' TIME_ZONE = 'Asia/Shanghai' USE_TZ ...
- DLL声明导出函数的两种方式
DLL中导出函数的声明有两种方式:一种为在函数声明中加上__declspec(dllexport):另外一种方式是采用模块定义(.def) 文件声明,.def文件为链接器提供了有关被链接程序的导出.属 ...
- L155
Wireless Festival has been given permission to remain in London's Finsbury Park, provided performers ...
- linux配置PHP环境!!(云服务器架设)
首先去阿里云或腾讯云购买主机(腾讯云现在有免费30天的云主机...) 购买好之后选择安装: 点登陆 就可以到linux的操作界面了 进入操作界面 输入root账号密码取得权限之后就可以开始配置环境了 ...
- spinlock变量没有初始化
http://blog.csdn.net/longwang155069/article/details/52224284
- 脚本操作zk
使用[root@localhost bin]# ./zkCli.sh连接本地zk 创建 create [-s] [-e] path data acl 其中,-s是创建顺序或临时结点.默认情况下,不添加 ...
- Sqlalchemy 设置表编码及引擎
1. 设置引擎编码方式为utf8. engine = create_engine("mysql+pymysql://root:123456@127.0.0.1:3306/sqldb01?ch ...
- vue-one_demo_music
简单的音乐盒子 利用计算属性(监听数据),解决上一首,下一首,点击切换 <!DOCTYPE html> <html lang="en"> <head& ...