
MSChart使用之双Y轴使用
        protected void SearchChart()

        {

            Chart1.ChartAreas.Clear();

            Chart1.Series.Clear();

                    ChartArea _ChartArea = null;

                    Series _SeriesJRATE = null;

                    Series _SeriesDRATE = null;

                    Series _SeriesDCL = null;

                    #region 循环添加 ChartArea

                    _ChartArea = new ChartArea();

                    //主X轴样式设置

                    _ChartArea.AxisX.MajorGrid.LineColor = System.Drawing.Color.FromArgb(, , ); //主X轴主网格线颜色

                    _ChartArea.AxisX.MajorGrid.LineDashStyle = ChartDashStyle.Dash;//主X轴主网格线虚线

                    _ChartArea.Position.Auto = true;

                    _ChartArea.Name = "ChartName";//设定ChartName

                    _ChartArea.AxisX.Title = "";//主X轴坐标标题

                    _ChartArea.AxisX.TitleAlignment = StringAlignment.Far;//主X轴坐标标题位置

                    _ChartArea.AxisX.Interval = ;//间隔

                    _ChartArea.AxisX.IntervalType = DateTimeIntervalType.Number;//间隔类型指定

            //_ChartArea.AxisX.LabelStyle

                    //主Y轴样式设置

                    _ChartArea.AxisY.Title = "Commit";

                    _ChartArea.AxisY.TitleAlignment = StringAlignment.Far;

                    _ChartArea.AxisY.MajorGrid.LineColor = System.Drawing.Color.FromArgb(, , );

                    _ChartArea.AxisY.MajorGrid.LineDashStyle = ChartDashStyle.Dash;

                    //副Y轴样式设置

                    _ChartArea.AxisY2.Title = "达成率";

                    _ChartArea.AxisY2.TitleAlignment = StringAlignment.Near;

                    _ChartArea.AxisY2.MajorGrid.LineColor = System.Drawing.Color.FromArgb(, , );

                    _ChartArea.AxisY2.MajorGrid.LineDashStyle = ChartDashStyle.Dash;

                    //_ChartArea.AxisX.LabelStyle.Interval = 1; //X文本间隔

                    //_ChartArea.AxisX.LabelStyle.Font = new System.Drawing.Font("隶书", 12);

                    //_ChartArea.AxisX.MajorGrid.Interval = 1;  //X主要辅助线间隔

                    //_ChartArea.AxisX.MinorGrid.Interval = 1;//X次要辅助线间隔

                    //_ChartArea.AxisX.MinorTickMark.Interval = 1;//X次要刻度线间隔

                    //_ChartArea.AxisX.MajorTickMark.Interval = 1;//X主要刻度线间隔

                    //_ChartArea.AxisY.MinorGrid.Interval = 1;//Y次要辅助线间隔

                    //_ChartArea.AxisY.MajorGrid.Interval = 5;//Y主要辅助线间隔

                    //_ChartArea.AxisY.LabelStyle.Interval = 0.5;

                    Chart1.ChartAreas.Add(_ChartArea);

                    System.Drawing.Font F=new Font("宋体",);

                    Title title = new Title("过程总体统计", Docking.Top,F,Color.Black);

                    Chart1.Titles.Add(title);

                    title.DockedToChartArea = _ChartArea.Name;

                    title.IsDockedInsideChartArea = false;

                    title.Alignment = ContentAlignment.TopCenter;

                    _SeriesJRATE = new Series();

                    _SeriesJRATE.ChartType = SeriesChartType.Column;

                    _SeriesJRATE.Name = "Commit";

                    _SeriesJRATE.ChartArea = _ChartArea.Name;

                    //_SeriesJRATE.BorderColor = System.Drawing.Color.Blue;

                    _SeriesJRATE.Color = Color.Blue;

                    _SeriesJRATE.BorderWidth = ;

                    _SeriesJRATE.ShadowOffset = ;

                    _SeriesJRATE.IsValueShownAsLabel = true;

                    _SeriesJRATE.MarkerStyle = MarkerStyle.Triangle;

                    _SeriesJRATE.LegendText = "Commit";

                    _SeriesJRATE.YAxisType = AxisType.Primary;//设为主Y轴

                    Chart1.Series.Add(_SeriesJRATE); //加入Series

                    _SeriesDRATE = new Series();

                    _SeriesDRATE.ChartType = SeriesChartType.Column;

                    _SeriesDRATE.Name = "AvgDate";

                    _SeriesDRATE.ChartArea = _ChartArea.Name;

                    //_SeriesDRATE.BorderColor = System.Drawing.Color.Green;

                    _SeriesDRATE.Color = Color.Green;

                    _SeriesDRATE.BorderWidth = ;

                    _SeriesDRATE.ShadowOffset = ;

                    _SeriesDRATE.IsValueShownAsLabel = true;

                    _SeriesDRATE.MarkerStyle = MarkerStyle.Square;

                    _SeriesDRATE.LegendText = "平均工作日";

                    _SeriesDRATE.XAxisType = AxisType.Primary;//设为主X轴

                    Chart1.Series.Add(_SeriesDRATE); //加入Series

                    _SeriesDCL = new Series();

                    _SeriesDCL.ChartType = SeriesChartType.Spline;

                    _SeriesDCL.Name = "Rate";

                    _SeriesDCL.ChartArea = _ChartArea.Name;

                    //_SeriesDRATE.BorderColor = System.Drawing.Color.Green;

                    _SeriesDCL.Color = Color.Yellow;

                    _SeriesDCL.BorderWidth = ;

                    _SeriesDCL.ShadowOffset = ;

                    _SeriesDCL.IsValueShownAsLabel = true;

                    _SeriesDCL.MarkerStyle = MarkerStyle.Square;

                    _SeriesDCL.LegendText = "达成率";

                    _SeriesDCL.YAxisType = AxisType.Secondary;//设为副Y轴

                    Chart1.Series.Add(_SeriesDCL); //加入Series

                    #endregion

                    Chart1.Legends[].Docking = Docking.Top;

                    Chart1.Legends[].DockedToChartArea = "ChartName";

                    Chart1.Legends[].Alignment = StringAlignment.Center;

                    Chart1.Legends[].IsDockedInsideChartArea = false;

                    //1 序号,'一月' 月份,15.00 Commit,9.69 平均工作日,92.98 达成率

                    DataTable dtChart = this.Getdt();

                    if (dtChart != null && dtChart.Rows.Count > )

                    {

                        for (int j = ; j < dtChart.Rows.Count; j++)

                        {

                            string YF = dtChart.Rows[j]["月份"].ToString();

                            double dC = double.Parse(dtChart.Rows[j]["Commit"].ToString());

                            double dA = double.Parse(dtChart.Rows[j]["平均工作日"].ToString());

                            double dD = double.Parse(dtChart.Rows[j]["达成率"].ToString());

                            Chart1.Series["Commit"].Points.AddXY(YF, dC);

                            Chart1.Series["AvgDate"].Points.AddXY(YF, dA);

                            Chart1.Series["Rate"].Points.AddXY(YF, dD);

                        }

                    }

        }

        protected DataTable Getdt()

        {

            StringBuilder sb = new StringBuilder();

            sb.Append(@"select 1 序号,'一月' 月份,15.00 Commit,9.69 平均工作日,92.98 达成率 from dual

union

select 2 序号,'二月' 月份,15.00 Commit,11.69 平均工作日,86.62 达成率 from dual

union

select 3 序号,'三月' 月份,15.00 Commit,9.77 平均工作日,95.71 达成率 from dual

union

select 4 序号,'四月' 月份,15.00 Commit,10.53 平均工作日,90.06 达成率 from dual

union

select 5 序号,'五月' 月份,15.00 Commit,12.17 平均工作日,90.06 达成率 from dual

union

select 6 序号,'六月' 月份,15.00 Commit,10.14 平均工作日,100.00 达成率 from dual

union

select 7 序号,'七月' 月份,15.00 Commit,0.00 平均工作日,0.00 达成率 from dual

union

select 8 序号,'八月' 月份,15.00 Commit,0.00 平均工作日,0.00 达成率 from dual

union

select 9 序号,'九月' 月份,15.00 Commit,0.00 平均工作日,0.00 达成率 from dual

union

select 10 序号,'十月' 月份,15.00 Commit,0.00 平均工作日,0.00 达成率 from dual

union

select 11 序号,'十一月' 月份,15.00 Commit,0.00 平均工作日,0.00 达成率 from dual

union

select 12 序号,'十二月' 月份,15.00 Commit,0.00 平均工作日,0.00 达成率 from dual

union

select 13 序号,'平均值' 月份,15.00 Commit,9.14 平均工作日,93.85 达成率 from dual ");

            DataSet ds = OraHelper.GetDateDS(sb.ToString());

            if (ds != null && ds.Tables.Count > )

            {

                DataTable dtChart = ds.Tables[];

                return dtChart;

            }

            else return null;

        }
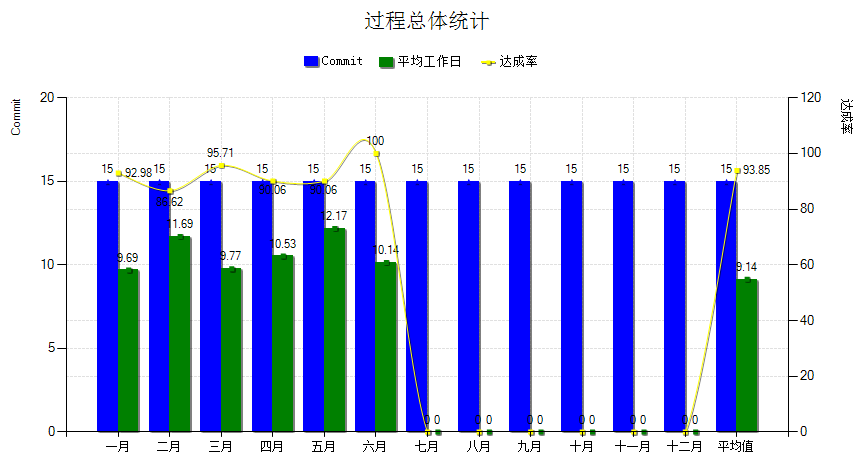
MSChart使用之双Y轴使用:效果如图:
MSChart使用之双Y轴使用的更多相关文章
- highchart 设置双Y轴坐标 双x轴坐标方法
我们的图表一旦引入了两种不同单位或者数量级相差很大的数据以后,这时候需要两种坐标对其进行计量. 下面以设置双Y轴为例, y轴坐标的参数设置成: yAxis: [{ title: { text: '坐标 ...
- 绘制复数图形和双y轴图形
clearclct=0:0.1:2*pi;x=sin(t);y=cos(t);z=x+i*y;subplot(1,3,1)plot(t,z,'r') %注:这种方式下,不论参数t,z哪个是复数,都将忽 ...
- Jqplot使用总结之二(双Y轴)
最近需要用Jqplot做双Y轴的Chart图,首先我找到了文档上的例子并对数据做了一些调整: 1.例子展示: var s1 = [["2002-01-01", 112000], [ ...
- echarts使用笔记四:双Y轴
1.双Y轴显示数量和占比 app.title = '坐标轴刻度与标签对齐'; option = { title : { //标题 x : 'center', y : 5, text : '数量和占比图 ...
- Python科学计算技巧积累四——双y轴图像绘制
双y轴图像具有单y轴图像没有的对比效果,在MATLAB中有plotyy函数可以实现,Python的实现方式没有MATLAB那样方便,不过实现效果却也不见得差. 以往我常用的绘图命令是import ma ...
- 【Python】matplotlib 双y轴绘制及合并图例
1.双y轴绘制 关键函数:twinx() 问题在于此时图例会有两个. # -*- coding: utf-8 -*- import numpy as np import matplotlib.pypl ...
- matlab画二维直方图以及双y轴坐标如何修改另一边y轴的颜色
1.首先讲一下如何用hist画二维直方图 x=[- - - - - - - - - - - - - - - - - - - - - - - - - - - - - - - - - - - - - - ...
- Python教程:matplotlib 绘制双Y轴曲线图
前言 本文的文字及图片来源于网络,仅供学习.交流使用,不具有任何商业用途,版权归原作者所有,如有问题请及时联系我们以作处理. 作者:数据皮皮侠 双X轴的可以理解为共享y轴 ax1=ax.twiny() ...
- Python实现双X轴双Y轴绘图
诈尸人口回归.这一年忙着灌水忙到头都掉了,最近在女朋友的提醒下终于想起来博客的账号密码,正好今天灌水的时候需要画一个双X轴双Y轴的图,研究了两小时终于用Py实现了.找资料的过程中没有发现有系统的文章, ...
随机推荐
- js singleton
方案一:利用闭包的两个作用,可以变通地读到内部的变量. 方案二: 是可以让这些变量始终在内存中. 方案一 var SingletonTester = (function () { //单例方法 fun ...
- MVC---Case 1
<!DOCTYPE html> <html lang="en"> <head> <title>Backbone.js, Requir ...
- 【Linux】鸟哥的Linux私房菜基础学习篇整理(三)
1. gzip [-cdtv#] filename:压缩.参数:-c:将压缩的数据输出到屏幕上,可通过数据重定向进行处理:-d:解压缩的参数:-t:可以用来检验一个压缩文件的一致性,查看文件有无错误: ...
- BZOJ 1072 [SCOI2007]排列perm
1072: [SCOI2007]排列perm Time Limit: 10 Sec Memory Limit: 162 MBSubmit: 1268 Solved: 782[Submit][Sta ...
- CentOS 6.3上搭建PPTP VPN
系统版本:CentOS 6.3_x86_64 eth0:172.16.10.72(实验环境当公网IP使用) eth1:192.168.100.50 1.检测是否支持ppp模块 # cat /dev/p ...
- POJ Countries in War 3114
题目大意: 给定一些城市,然后再给一些寄信的路信,A,B,H代表把信从A城市寄到B城市需要H小时. 如果没有直接可以寄达的,可以先通过另外一个城市到达,比如A,B可以寄信,B,C可以寄信,那么,A,C ...
- 贪心(数据结构):COGS 468. [NOI2010]超级钢琴
★★★☆ 输入文件:piano.in 输出文件:piano.out 简单对比 时间限制:2 s 内存限制:512 MB 超级钢琴 [问题描述] 小Z是一个小有名气的钢琴家,最近C博士送 ...
- 【动态规划】Vijos P1680 距离
题目链接: https://vijos.org/p/1680 题目大意: 设有字符串X,我们称在X的头尾及中间插入任意多个空格后构成的新字符串为X的扩展串,如字符串X为”abcbcd”,则字符串“ab ...
- expresscalculate
//本程序接受任意含有+.-.*./和()的数值表达式,数值允许带小数,输入以#结束.如:((2.4+3.5)*2-(2+3.5)/2)*(2+3)# #include <stdio.h> ...
- (组合数学3.1.1.2)UVA 10098 Generating Fast(使用字典序思想产生所有序列)
/* * UVA_10098.cpp * * Created on: 2013年10月8日 * Author: Administrator */ #include <iostream> # ...