intermediate-python-for-data-science
当前的学习也是调参的过程
matplotlib
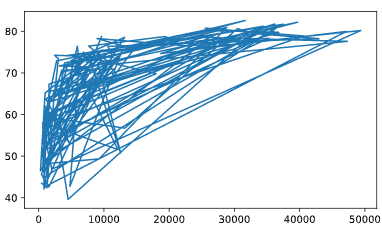
plot
# Print the last item of gdp_cap and life_exp

print(gdp_cap)

print(life_exp)

# Make a line plot, gdp_cap on the x-axis, life_exp on the y-axis

plt.plot(gdp_cap,life_exp)

# Display the plot

plt.show()
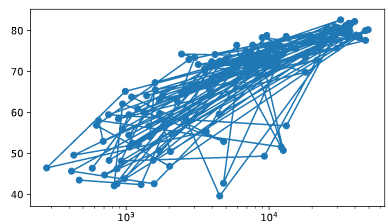
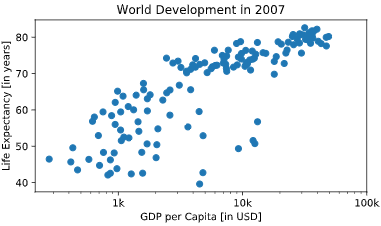
Scatter Plot
# Change the line plot below to a scatter plot

plt.plot(gdp_cap, life_exp)

# Put the x-axis on a logarithmic scale

plt.scatter(gdp_cap, life_exp)

plt.xscale('log')

# Show plot

plt.show()
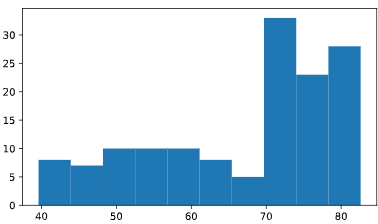
histogram
# Create histogram of life_exp data

plt.hist(life_exp)

# Display histogram

plt.show()

# Build histogram with 5 bins

plt.hist(life_exp,bins=5)

# Show and clean up plot

plt.show()

plt.clf()
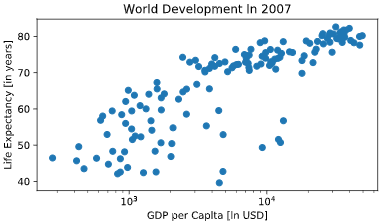
Customization
自定义绘图
# Basic scatter plot, log scale

plt.scatter(gdp_cap, life_exp)

plt.xscale('log')

# Strings

xlab = 'GDP per Capita [in USD]'

ylab = 'Life Expectancy [in years]'

title = 'World Development in 2007'

# Add axis labels

plt.xlabel(xlab )

plt.ylabel(ylab)

# Add title

plt.title(title)

# After customizing, display the plot

plt.show()
plt.xticks
# Scatter plot

plt.scatter(gdp_cap, life_exp)

# Previous customizations

plt.xscale('log')

plt.xlabel('GDP per Capita [in USD]')

plt.ylabel('Life Expectancy [in years]')

plt.title('World Development in 2007')

# Definition of tick_val and tick_lab

tick_val = [1000, 10000, 100000]

tick_lab = ['1k', '10k', '100k']

# Adapt the ticks on the x-axis

plt.xticks(tick_val, tick_lab)

# After customizing, display the plot

plt.show()
# Specify c and alpha inside plt.scatter()

plt.scatter(x = gdp_cap, y = life_exp, s = np.array(pop) * 2,c=col,alpha=0.8)

# Previous customizations

plt.xscale('log')

plt.xlabel('GDP per Capita [in USD]')

plt.ylabel('Life Expectancy [in years]')

plt.title('World Development in 2007')

plt.xticks([1000,10000,100000], ['1k','10k','100k'])

# Show the plot

plt.show()

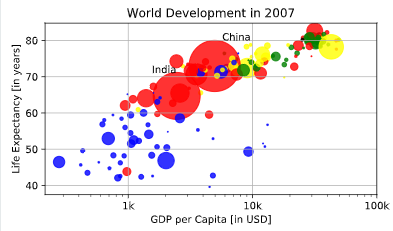
plt.test
# Scatter plot

plt.scatter(x = gdp_cap, y = life_exp, s = np.array(pop) * 2, c = col, alpha = 0.8)

# Previous customizations

plt.xscale('log')

plt.xlabel('GDP per Capita [in USD]')

plt.ylabel('Life Expectancy [in years]')

plt.title('World Development in 2007')

plt.xticks([1000,10000,100000], ['1k','10k','100k'])

# Additional customizations

plt.text(1550, 71, 'India')

plt.text(5700, 80, 'China')

# Add grid() call

plt.grid(True)

# Show the plot

plt.show()
Dictionaries, Part 1
# Definition of countries and capital

countries = ['spain', 'france', 'germany', 'norway']

capitals = ['madrid', 'paris', 'berlin', 'oslo']

# Get index of 'germany': ind_ger

ind_ger=countries.index('germany')

# Use ind_ger to print out capital of Germany

print(capitals[ind_ger])
Create dictionary
# Definition of countries and capital

countries = ['spain', 'france', 'germany', 'norway']

capitals = ['madrid', 'paris', 'berlin', 'oslo']

# From string in countries and capitals, create dictionary europe

europe = { 'spain':'madrid','france':'paris', 'germany':'berlin', 'norway':'oslo' }

# Print europe

print(europe)
dictionary keys
可以直接用[]来取出key所对应的值
# Definition of dictionary

europe = {'spain':'madrid', 'france':'paris', 'germany':'berlin', 'norway':'oslo' }

# Print out the keys in europe

#直接调用keys方法

print(europe.keys())

# Print out value that belongs to key 'norway'

print(europe['norway'])
给已经存在的字典中继续增加元素
# Definition of dictionary

europe = {'spain':'madrid', 'france':'paris', 'germany':'berlin', 'norway':'oslo' }

# Add italy to europe

europe['italy']='rome'

# Print out italy in europe

print('italy' in europe)

# Add poland to europe

europe['poland']='warsaw'

# Print europe

print(europe)
添加删除键值对
使用del删除
# Definition of dictionary

europe = {'spain':'madrid', 'france':'paris', 'germany':'bonn',

          'norway':'oslo', 'italy':'rome', 'poland':'warsaw',

          'australia':'vienna' }

# Update capital of germany

europe['germany']='berlin'

# Remove australia

#使用del函数直接删

del(europe['australia'])

# Print europe

print(europe)
筛选字典中的值
# Dictionary of dictionaries

europe = { 'spain': { 'capital':'madrid', 'population':46.77 },

           'france': { 'capital':'paris', 'population':66.03 },

           'germany': { 'capital':'berlin', 'population':80.62 },

           'norway': { 'capital':'oslo', 'population':5.084 } }

# Print out the capital of France

print(europe['france']['capital'])

# Create sub-dictionary data

data = { 'capital':'rome', 'population':59.83 }

# Add data to europe under key 'italy'

europe['italy'] = data

# Print europe

print(europe)
pandas学习
dataframe
# Pre-defined lists

names = ['United States', 'Australia', 'Japan', 'India', 'Russia', 'Morocco', 'Egypt']

dr =  [True, False, False, False, True, True, True]

cpc = [809, 731, 588, 18, 200, 70, 45]

# Import pandas as pd

import pandas as pd

# Create dictionary my_dict with three key:value pairs: my_dict

my_dict = { 'country':names, 'drives_right':dr, 'cars_per_cap':cpc }

# Build a DataFrame cars from my_dict: cars

cars = pd.DataFrame(my_dict)

# Print cars

print(cars)

<script.py> output:

       cars_per_cap        country  drives_right

    0           809  United States          True

    1           731      Australia         False

    2           588          Japan         False

    3            18          India         False

    4           200         Russia          True

    5            70        Morocco          True

    6            45          Egypt          True
index
在python中index是指数据框的行名
import pandas as pd

# Build cars DataFrame

names = ['United States', 'Australia', 'Japan', 'India', 'Russia', 'Morocco', 'Egypt']

dr =  [True, False, False, False, True, True, True]

cpc = [809, 731, 588, 18, 200, 70, 45]

cars_dict = { 'country':names, 'drives_right':dr, 'cars_per_cap':cpc }

cars = pd.DataFrame(cars_dict)

print(cars)

# Definition of row_labels

row_labels = ['US', 'AUS', 'JPN', 'IN', 'RU', 'MOR', 'EG']

# Specify row labels of cars

cars.index=row_labels

# Print cars again

print(cars)
pd.read_csv
# Import pandas as pd

import pandas as pd

# Import the cars.csv data: cars

cars=pd.read_csv("cars.csv")

# Fix import by including index_col

cars = pd.read_csv('cars.csv',index_col=0)

# Print out cars

print(cars)
loc
根据行名取行值
iloc
根据行的索引值
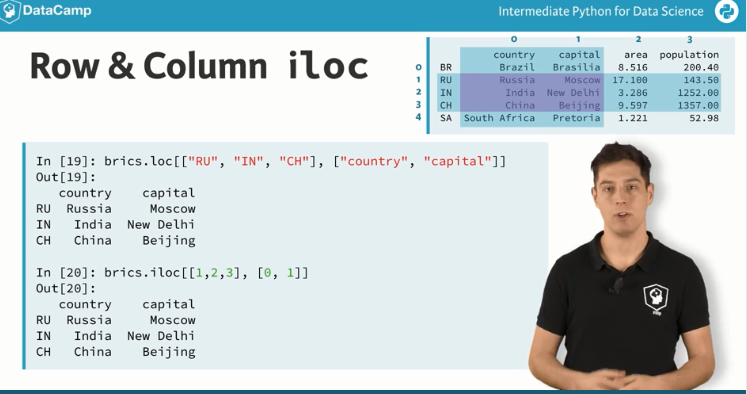
# Import cars data

import pandas as pd

cars = pd.read_csv('cars.csv', index_col = 0)

# Print out observation for Japan

print(cars.iloc[2])

#两种表示方法

# Print out observations for Australia and Egypt

print(cars.loc[['AUS', 'EG']])
# Import cars data

import pandas as pd

cars = pd.read_csv('cars.csv', index_col = 0)

# Print out drives_right value of Morocco

print(cars.iloc[5,2])

# Print sub-DataFrame

print(cars.iloc[[4,5],[1,2]])
[]&[[]]
# Import cars data

import pandas as pd

cars = pd.read_csv('cars.csv', index_col = 0)

# Print out country column as Pandas Series

print(cars["country"])

# Print out country column as Pandas DataFrame

print(cars[['country']])

# Print out DataFrame with country and drives_right columns

print(cars[['country','drives_right']])
# Import cars data

import pandas as pd

cars = pd.read_csv('cars.csv', index_col = 0)

# Print out first 3 observations

print(cars[0:3])

# Print out fourth, fifth and sixth observation

print(cars[3:6])

<script.py> output:

         cars_per_cap        country  drives_right

    US            809  United States          True

    AUS           731      Australia         False

    JPN           588          Japan         False

         cars_per_cap  country  drives_right

    IN             18    India         False

    RU            200   Russia          True

    MOR            70  Morocco          True
提取数据框中的某一列
# Import cars data

import pandas as pd

cars = pd.read_csv('cars.csv', index_col = 0)

# Print out drives_right column as Series

print(cars.iloc[:, 2])

# Print out drives_right column as DataFrame

print(cars.iloc[:, [2]])

# Print out cars_per_cap and drives_right as DataFrame

print(cars.loc[:, ['cars_per_cap', 'drives_right']])

<script.py> output:

    US      True

    AUS    False

    JPN    False

    IN     False

    RU      True

    MOR     True

    EG      True

    Name: drives_right, dtype: bool

         drives_right

    US           True

    AUS         False

    JPN         False

    IN          False

    RU           True

    MOR          True

    EG           True

         cars_per_cap  drives_right

    US            809          True

    AUS           731         False

    JPN           588         False

    IN             18         False

    RU            200          True

    MOR            70          True

    EG             45          True
Comparison Operators
NUMPY中的逻辑运算符
# Create arrays

import numpy as np

my_house = np.array([18.0, 20.0, 10.75, 9.50])

your_house = np.array([14.0, 24.0, 14.25, 9.0])

# my_house greater than 18.5 or smaller than 10

print(np.logical_or(my_house > 18.5, my_house < 10))

# Both my_house and your_house smaller than 11

print(np.logical_and(my_house < 11, your_house < 11))
Filtering Pandas DataFrame
while循环语句
# Initialize offset

offset = -6

# Code the while loop

while offset != 0 :

    print("correcting...")

    if offset > 0 :

      offset=offset-1

    else :

      offset=offset+1

    print(offset)
for loop
# areas list

areas = [11.25, 18.0, 20.0, 10.75, 9.50]

# Change for loop to use enumerate() and update print()

for index, area in enumerate(areas) :

    print("room " + str(index) + ": " + str(area))

<script.py> output:

    room 0: 11.25

    room 1: 18.0

    room 2: 20.0

    room 3: 10.75

    room 4: 9.5
遍历list
# house list of lists

house = [["hallway", 11.25],

         ["kitchen", 18.0],

         ["living room", 20.0],

         ["bedroom", 10.75],

         ["bathroom", 9.50]]

# Build a for loop from scratch

for x in house:

    print("the " + x[0] + " is " + str(x[1]) + " sqm")
遍历数据框的每一行
Iterating over a Pandas DataFrame is typically done with the iterrows() method. Used in a for loop, every observation is iterated over and on every iteration the row label and actual row contents are available:
# Import cars data

import pandas as pd

cars = pd.read_csv('cars.csv', index_col = 0)

# Iterate over rows of cars

for lab, row in cars.iterrows() :

    print(lab)

    print(row)

<script.py> output:

    US

    cars_per_cap              809

    country         United States

    drives_right             True

    Name: US, dtype: object

    AUS

    cars_per_cap          731

    country         Australia

    drives_right        False

    Name: AUS, dtype: object

    JPN

    cars_per_cap      588

    country         Japan

    drives_right    False

    Name: JPN, dtype: object

    IN

    cars_per_cap       18

    country         India

    drives_right    False

    Name: IN, dtype: object

    RU

    cars_per_cap       200

    country         Russia

    drives_right      True

    Name: RU, dtype: object

    MOR

    cars_per_cap         70

    country         Morocco

    drives_right       True

    Name: MOR, dtype: object

    EG

    cars_per_cap       45

    country         Egypt

    drives_right     True

    Name: EG, dtype: object
增加列
可以直接增加,也可以使用apply函数
# Import cars data

import pandas as pd

cars = pd.read_csv('cars.csv', index_col = 0)

# Use .apply(str.upper)

cars["COUNTRY"] = cars["country"].apply(str.upper)
# Import cars data

import pandas as pd

cars = pd.read_csv('cars.csv', index_col = 0)

# Use .apply(str.upper)

for lab, row in cars.iterrows() :

    cars.loc[lab, "COUNTRY"] = row["country"].upper()
Random float
随机数问题
Randomness has many uses in science, art, statistics, cryptography, gaming, gambling, and other fields. You're going to use randomness to simulate a game.
All the functionality you need is contained in the random package, a sub-package of numpy. In this exercise, you'll be using two functions from this package:
- seed(): sets the random seed, so that your results are reproducible between simulations. As an argument, it takes an integer of your choosing. If you call the function, no output will be generated.
- rand(): if you don't specify any arguments, it generates a random float between zero and one.
# Import numpy as np

import numpy as np

# Set the seed

np.random.seed(123)

# Generate and print random float

print(np.random.rand())
random_walk
# Numpy is imported, seed is set

# Initialize random_walk

random_walk = [0]

# Complete the ___

for x in range(100) :

    # Set step: last element in random_walk

    step = random_walk[-1]

    # Roll the dice

    dice = np.random.randint(1,7)

    # Determine next step

    if dice <= 2:

        step = step - 1

    elif dice <= 5:

        step = step + 1

    else:

        step = step + np.random.randint(1,7)

    # append next_step to random_walk

    random_walk.append(step)

# Print random_walk

print(random_walk)

<script.py> output:

    [0, 3, 4, 5, 4, 5, 6, 7, 6, 5, 4, 3, 2, 1, 0, -1, 0, 5, 4, 3, 4, 3, 4, 5, 6, 7, 8, 7, 8, 7, 8, 9, 10, 11, 10, 14, 15, 14, 15, 14, 15, 16, 17, 18, 19, 20, 21, 24, 25, 26, 27, 32, 33, 37, 38, 37, 38, 39, 38, 39, 40, 42, 43, 44, 43, 42, 43, 44, 43, 42, 43, 44, 46, 45, 44, 45, 44, 45, 46, 47, 49, 48, 49, 50, 51, 52, 53, 52, 51, 52, 51, 52, 53, 52, 55, 56, 57, 58, 57, 58, 59]
distrubition
transpose()
转置函数
np.random.randint()
可以指定生成随机数组的维度
参考
看一个小的demo
# numpy and matplotlib imported, seed set

# Simulate random walk 250 times

all_walks = []

for i in range(250) :

    random_walk = [0]

    for x in range(100) :

        step = random_walk[-1]

        dice = np.random.randint(1,7)

        if dice <= 2:

            step = max(0, step - 1)

        elif dice <= 5:

            step = step + 1

        else:

            step = step + np.random.randint(1,7)

        # Implement clumsiness

        if np.random.rand() <= 0.001 :

            step = 0

        random_walk.append(step)

    all_walks.append(random_walk)

# Create and plot np_aw_t

np_aw_t = np.transpose(np.array(all_walks))

plt.plot(np_aw_t)

plt.show()
intermediate-python-for-data-science的更多相关文章
- 学习笔记之Intermediate Python for Data Science | DataCamp
Intermediate Python for Data Science | DataCamp https://www.datacamp.com/courses/intermediate-python ...
- Intermediate Python for Data Science learning 2 - Histograms
Histograms from:https://campus.datacamp.com/courses/intermediate-python-for-data-science/matplotlib? ...
- Intermediate Python for Data Science learning 1 - Basic plots with matplotlib
Basic plots with matplotlib from:https://campus.datacamp.com/courses/intermediate-python-for-data-sc ...
- Intermediate Python for Data Science learning 3 - Customization
Customization from:https://campus.datacamp.com/courses/intermediate-python-for-data-science/matplotl ...
- 40 Questions to test your skill in Python for Data Science
Comes from: https://www.analyticsvidhya.com/blog/2017/05/questions-python-for-data-science/ Python i ...
- Intro to Python for Data Science Learning 8 - NumPy: Basic Statistics
NumPy: Basic Statistics from:https://campus.datacamp.com/courses/intro-to-python-for-data-science/ch ...
- Intro to Python for Data Science Learning 7 - 2D NumPy Arrays
2D NumPy Arrays from:https://campus.datacamp.com/courses/intro-to-python-for-data-science/chapter-4- ...
- Intro to Python for Data Science Learning 5 - Packages
Packages From:https://campus.datacamp.com/courses/intro-to-python-for-data-science/chapter-3-functio ...
- Intro to Python for Data Science Learning 2 - List
List from:https://campus.datacamp.com/courses/intro-to-python-for-data-science/chapter-2-python-list ...
- Intro to Python for Data Science Learning 6 - NumPy
NumPy From:https://campus.datacamp.com/courses/intro-to-python-for-data-science/chapter-4-numpy?ex=1 ...
随机推荐
- 浅谈 vue-loader---合格前端
什么是 vue-loader? vue-loader 是一个 webpack 的 loader,它允许你以一种名为单文件组件的格式撰写 Vue 组件. 如何使用? 1. 安装 npm install ...
- 《手把手教你构建自己的 Linux 系统》学习笔记(5)
交叉编译是什么? 交叉编译就是在一个系统上,编译生成另外一个系统运行的程序文件. 「硬件体系结构」和「操作系统」的关系是什么? 硬件体系结构也可以称为架构,主要是通过 CPU 的指令集来进行区分的,操 ...
- jsx中的路径拼接
<img style={{height:80,width:80}} src={"/images/"+index+ ".jpg"}/>其中 index ...
- Vue组件库读取自定义配置文件
有这样一个场景,在组件库中新增一个配置文件,后续只修改一下配置文件中的配置项就可以实现不同的需求,下面就让我们I一起来实现吧. (一)在在项目的根目录(package.json所在目录)中创建一个vu ...
- 基于AccessToken方式设计API
目录 数据库设计 实现方案 应用场景:公司A有一平台需要对外提供接口给其他商户使用,考虑到安全性问题,此时可考虑采用AccessToken方案.商户在公司A平台注册一app,平台分配appId.app ...
- MacOs使用CleanMyMac X清除可清除空间
写在前面 本文介绍如何使用CleanMyMac X清除可清除的空间 可以看到,可清除的空间达到了125.79GB,虽然说不影响系统的使用,但是在使用时间机器进行备份的时候,仍然会将可清除空间当成备份的 ...
- .net mvc 使用 aspose.cells导出数据
public class AsposeCellsHelper { public Workbook workBook; public Worksheet worksheet; Style style; ...
- gulp常用插件之gulp-htmlmin使用
更多gulp常用插件使用请访问:gulp常用插件汇总 gulp-htmlmin这是一款HTML文件压缩插件. 更多使用文档请点击访问gulp-htmlmin工具官网. 安装 一键安装不多解释 npm ...
- Parity game POJ - 1733 带权并查集
#include<iostream> #include<algorithm> #include<cstdio> using namespace std; <& ...
- 简单记账本APP开发二
今天主要是进行了适配器的编写,数据库的创建以及对完善了业务逻辑,简单的APP到此已经通过测试可以使用.