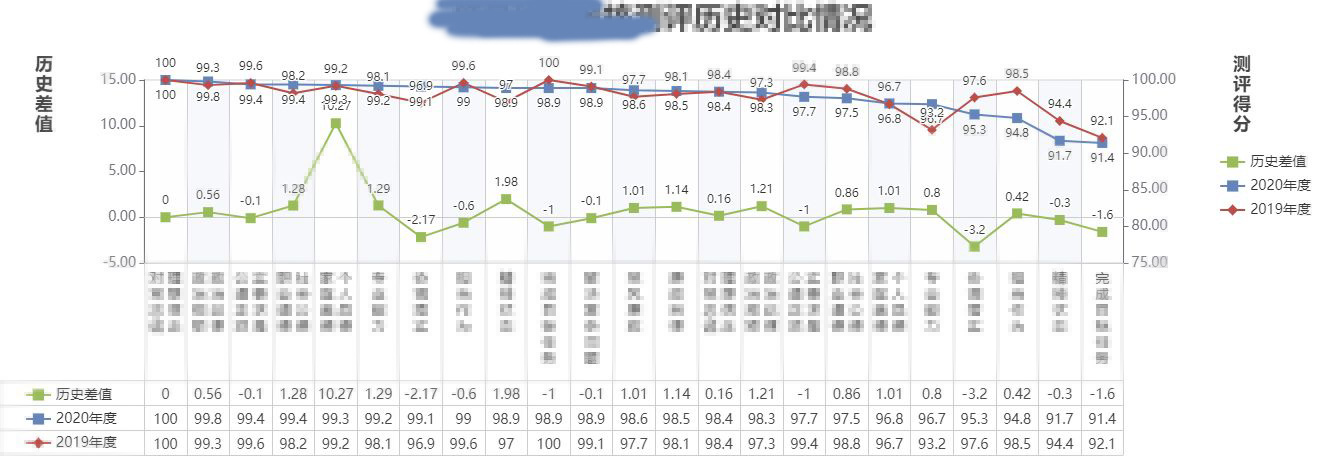
echart 带表格
"echarts": "^5.2.2",
ChartSituation1
<template>

  <div>

    <EChartTemplate1 ref="eChartTemplate1Ref"></EChartTemplate1>

  </div>

</template>

<script>

import EChartTemplate1 from '../EChartTemplate1'

import mock from '../mockData'

export default {

  name: 'ChartSituation1',

  components: {

    EChartTemplate1

  },

  props: {},

  data () {

    return {}

  },

  watch: {},

  computed: {},

  methods: {},

  created () { },

  activated () { },

  mounted () {

    const optionBusiness = {

      title: '111',

      legendData: ['历史差值', '2020年度', '2019年度'],

      dataDiff: mock.lishichazhi,

      data1: mock.year2020,

      data2: mock.year2019,

      xAxisData: mock.xAxisData

    }

    this.$refs.eChartTemplate1Ref.open(optionBusiness)

  },

  beforeDestroy () { }

}

</script>

<style>

</style>
EChartTemplate1
<template>

  <div>

    <EChartComponent ref="eChartCompnentRef"></EChartComponent>

  </div>

</template>

<script>

import EChartComponent from '../EChartComponent'

export default {

  name: 'EChartTemplate1',

  components: {

    EChartComponent

  },

  props: {},

  data () {

    return {}

  },

  watch: {},

  computed: {},

  methods: {

    open (optionB) {

      const lineList = this.getTableLine(4)

      const option = {

        color: ['#99bb5c', '#6585b8', '#b84f4b'],

        grid: {

          show: true,

          containLabel: true,

          height: 'auto' - 0,

          top: 80,

          left: 100,

          right: 150,

          bottom: 10,

        },

        title: [

          {

            textStyle: { fontSize: 30 },

            left: 'center',

            text: optionB.title

          },

          {

            top: 50,

            left: 30,

            textStyle: { lineHeight: 20 },

            text: '历\n史\n差\n值'

          },

          {

            top: 50,

            right: 70,

            textStyle: { lineHeight: 20 },

            text: '测\n评\n得\n分'

          },

        ],

        xAxis: [

          {

            axisLine: {

              lineStyle: { color: '#ccc' },

              onZero: false,

            },

            position: 'bottom',

            axisTick: {

              show: true,

              length: this.getxAxisTickLength(optionB.xAxisData) // 193,

            },

            axisLabel: {

              color: '#464646',

              show: true,

              fontSize: 14,

              lineHeight: 16,

              interval: 0, // 全部显示

              rotate: 0,

              formatter: function (value, index) {

                return '{tableup|' + value + '\n}'

                  + '\n{table|' + optionB.dataDiff[index] + '}'

                  + '\n{table|' + optionB.data1[index] + '}'

                  + '\n{table|' + optionB.data2[index] + '}'

              },

              rich: {

                tableup: {

                  color: '#464646',

                  fontSize: 14,

                  lineHeight: 16,

                },

                table: {

                  color: '#464646',

                  fontSize: 14,

                  lineHeight: 25,

                }

              }

            },

            splitLine: { // 竖线

              show: true,

              lineStyle: { color: '#cccccc' }

            },

            splitArea: {

              show: true

            },

            type: 'category', // 类别

            data: this.xAxisData(optionB.xAxisData),

          },

          {

            axisLine: {

              lineStyle: {

                color: '#ccc'

              }

            }

          },

        ],

        yAxis: [

          { // 左边

            axisLabel: {

              formatter: function (value, index) {

                return value.toFixed(2)

              },

              fontSize: 14,

            },

            axisTick: {

              show: true,

            },

            splitLine: { // 横线

              show: false

            },

            min: this.getMinLeft(optionB.dataDiff, -5),

            max: this.getMaxLeft(optionB.dataDiff, 15),

            position: 'left',

            name: '',

            offset: 0,

            type: 'value'

          },

          { // 右边

            axisLabel: {

              formatter: function (value, index) {

                return value.toFixed(2)

              },

              fontSize: 14,

            },

            axisTick: {

              show: true,

            },

            splitLine: {

              show: false

            },

            min: this.getMinRight([...optionB.data1, ...optionB.data2], 75.00),

            max: this.getMaxRight([...optionB.data1, ...optionB.data2], 100.00),

            position: 'right',

            name: '',

            type: 'value'

          }

        ],

        legend: [

          {

            textStyle: { fontSize: 14 },

            orient: 'vertical',

            right: 10,

            top: 150,

            data: optionB.legendData

          },

          {

            textStyle: { fontSize: 14 },

            orient: 'vertical',

            left: 20,

            bottom: 13,

            data: optionB.legendData

          }

        ],

        series: [

          {

            label: {

              show: true,

              position: 'top'

            },

            symbol: 'rect',

            symbolSize: 10,

            yAxisIndex: 0,

            type: 'line',

            name: optionB.legendData[0],

            data: optionB.dataDiff,

          },

          {

            label: {

              show: true,

              position: 'bottom'

            },

            symbol: 'rect',

            symbolSize: 10,

            type: 'line',

            name: optionB.legendData[1],

            yAxisIndex: 1,

            data: optionB.data1,

          },

          {

            label: {

              show: true,

              position: 'top'

            },

            symbolSize: 10,

            type: 'line',

            symbol: 'diamond',

            name: '2019年度',

            yAxisIndex: 1,

            data: optionB.data2,

          },

        ],

        graphic: lineList

      }

      this.$refs.eChartCompnentRef.open(option)

    },

    getxAxisTickLength (data) {

      const arr = this.xAxisData(data)

      const getEnterNumber = str => {

        return str.split('\n').length

      }

      const numArr = arr.map(item => {

        return getEnterNumber(item)

      })

      const maxNum = Math.max(...numArr)

      // 16 是 lineHeight 多补了个回车 再加16 上面的padding是5

      // 25 是数据的 lineHeight 3行

      return maxNum * 16 + 16 + 5 + 25 * 3

    },

    getMinLeft (arr, defaultValue) { // 左侧轴 最小值计算

      const min = Math.min(...arr)

      if (min > defaultValue) {

        return defaultValue

      } else {

        return parseInt(min - 2)

      }

    },

    getMaxLeft (arr, defaultValue) { // 左侧轴 最大值计算

      const max = Math.max(...arr)

      if (max < defaultValue) {

        return defaultValue

      } else {

        return parseInt(max + 2)

      }

    },

    getMinRight (arr, defaultValue) { // 右侧轴 最小值计算

      const min = Math.min(...arr)

      if (min > defaultValue) {

        return defaultValue

      } else {

        if (min <= 2) {

          return 0

        }

        return parseInt(min - 2)

      }

    },

    getMaxRight (arr, defaultValue) { // 右侧轴 最大值计算

      const max = Math.max(...arr)

      if (max < defaultValue) {

        return defaultValue

      } else {

        if (max >= 98) {

          return 100

        }

        return parseInt(max + 2)

      }

    },

    getTableLine (num) {

      let list = []

      let bottom = 85

      let height = 25

      for (let i = 0; i < num; i++) {

        list.push({

          silent: true,

          type: 'line',

          bottom: bottom - i * height,

          // left: 50,

          right: 150 + 50,

          style: {

            stroke: 'inherit'

          },

          shape: {

            x1: 0,

            y1: 0,

            x2: 3000,

            y2: 0

          }

        })

      }

      list.push({

        style: {

          stroke: 'inherit'

        },

        bottom: 10,

        silent: true,

        type: 'line',

        shape: {

          x1: 0,

          y1: 0,

          x2: 0,

          y2: 75

        }

      })

      return list

    },

    xAxisData (data) {

      const ret = data.map(item => {

        if (item.indexOf(' ') > -1) {

          const t2 = item.split(' ')

          const a = t2[0].split('')

          const b = t2[1].split('')

          let k

          if (a.length > b.length) {

            k = a

          } else {

            k = b

          }

          const ret = k.map((item1, index) => {

            const a1 = a[index] ? a[index] : ' '

            const b1 = b[index] ? b[index] : ' '

            return a1 + ' ' + b1 + '\n'

          }).join('')

          return ret

        }

        return item.split('').join('\n')

      })

      const getEnterNumber = str => {

        return str.split('\n').length

      }

      const getMaxNumber = arr => {

        return Math.max(...arr)

      }

      const repeat = (src, n) => {

        let k = ''

        for (let i = 0; i < n; i++) {

          k = k + src

        }

        return k

      }

      const supplementEnter = (str, maxNumber) => { // 补上回车

        const enterLen = getEnterNumber(str)

        const needNumber = maxNumber - enterLen

        const n = repeat('\n', needNumber)

        return str + n

      }

      const maxNumber = getMaxNumber(ret.map(item => {

        return getEnterNumber(item)

      }))

      const ret1 = ret.map(item => {

        return supplementEnter(item, maxNumber)

      })

      return ret1

    }

  },

  created () { },

  activated () { },

  mounted () {

  },

  beforeDestroy () { }

}

</script>

<style>

</style>
EChartComponent
<template>

  <div v-if="chartVif">

    <ResizeZen @on-change="chartHeightSet"></ResizeZen>

    <div ref="dom"

         :style="{height: chartHeight + 'px'}"

         style="width: 100%;"></div>

  </div>

</template>

<script>

import * as echarts from 'echarts'

export default {

  name: 'EChartComponent',

  components: {},

  props: {},

  data () {

    return {

      chartVif: false,

      chartHeight: '550',

      myChart: null

    }

  },

  watch: {},

  computed: {},

  methods: {

    chartHeightSet () {

      this.chartHeight = window.innerHeight - 300

      this.$nextTick(() => {

        this.myChart.resize()

      })

    },

    openChartVifSet (ctx, next) {

      this.chartVif = false

      this.$nextTick(() => {

        this.chartVif = true

        this.$nextTick(() => {

          next()

        })

      })

    },

    openExe (ctx, next) {

      this.myChart = echarts.init(this.$refs.dom)

      this.myChart.setOption(ctx.option)

      this.chartHeightSet()

    },

    open (option) {

      const ac = this.$getAc()

      ac.ctx.option = option

      ac.use(this.openChartVifSet)

      ac.use(this.openExe)

      ac.run()

    }

  },

  created () { },

  activated () { },

  mounted () { },

  beforeDestroy () { }

}

</script>

<style>

</style>
ResizeZen
<template>

  <span></span>

</template>

<script>

// window.innerHeight

export default {

  name: 'ResizeZen',

  components: {},

  props: {},

  data () {

    return {}

  },

  watch: {},

  computed: {},

  methods: {

    resize () {

      this.$emit('on-change')

    }

  },

  created () { },

  activated () { },

  mounted () {

    window.addEventListener('resize', this.resize)

  },

  beforeDestroy () {

    window.removeEventListener('resize', this.resize)

  }

}

</script>

<style>

</style>
echart 带表格的更多相关文章
- Bootstrap历练实例:带表格的面板
带表格的面板 为了在面板中创建一个无边框的表格,我们可以在面板中使用 class .table.假设有个 <div> 包含 .panel-body,我们可以向表格的顶部添加额外的边框用来分 ...
- vue项目前台带表格的页面,让表格根据屏幕大小自适应高度,小屏幕时不出现多个滚动条
参见馆藏库房系统, 右侧整体结构一般如下 <el-container class="ml10 mr10 br7 bgw"> <el-main> // el- ...
- bootsrtap带表格面板内容居中
css中,添加 .table th, .table td { text-align: center; vertical-align: middle!important;}
- Silverlight项目笔记5:Oracle归档模式引起的异常&&表格控件绑定按钮
1.Oracle归档模式产生日志文件引起数据库异常 连接数据库失败,提示监听错误,各种检查监听配置文件,删除再添加监听,无果. sqlplus下重启数据库数据库依然无果,期间碰到多个错误提示: ORA ...
- python提取网页表格并保存为csv
0. 1.参考 W3C HTML 表格 表格标签 表格 描述 <table> 定义表格 <caption> 定义表格标题. <th> 定义表格的表头. <tr ...
- 如何用BarTender 2016字处理器完成表格设计
很多时候,需要应客户要求,用BarTender 2016设计带表格的标签.在BarTender 2016中字处理器文本对象可以使用字处理中的诸多格式功能(如项目符号.编号列表.表格.混合字体以及RTF ...
- LigerUI ligerComboBox 下拉框 表格 多选无效
$("#txt1").ligerComboBox({ width: 250, slide: false, selectBoxWidth: 500, selectBoxHeight: ...
- Css解决表格超出部分用省略号显示
小伙伴们有没有的遇到页面显示时,因为数据太长导致显示的表格某一列过长,从而导致页面的不美观,下面我们来看一看如何用Css样式解决表格超出部分用省略号显示的问题. 主要设置两个样式: table{ ta ...
- 开源 iOS 项目分类索引大全 - 待整理
开源 iOS 项目分类索引大全 GitHub 上大概600个开源 iOS 项目的分类和介绍,对于你挑选和使用开源项目应该有帮助 系统基础库 Category/Util sstoolkit 一套Cate ...
- bootstrap 组件
bootstrap 组件 1下拉菜单(dropdown) 下拉菜单切换(dropdown-toggle) 下拉菜单对齐(dropdown-menu-right-右对齐) 下拉菜单分割线(di ...
随机推荐
- C++ 实现的Ping类的封装
Ping 使用 Internet 控制消息协议(ICMP)来测试主机之间的连接.当用户发送一个 ping 请求时,则对应的发送一个 ICMP Echo 请求消息到目标主机,并等待目标主机回复一个 IC ...
- 在Windows下编译Saba
今天写一篇环境配置的博客,感觉这种博客比较好写 Saba是一个用于加载MMD(MikuMikuDance)模型.动作文件的C++库.下面我们在Windows下编译这个库.为了在Windows下 ...
- 沿SVG路径的颜色渐变
原生的渐变方法 在SVG中提供的原生渐变方法有两种,分别为线性渐变linearGradient和径向渐变radialGradient.我们以一个稍微复杂的路径来作为模板,为其添加两种渐变效果: < ...
- Ubuntu安装typecho博客
Ubuntu安装typecho博客 简介 名称的来历 Typecho 是由 type 和 echo 两个词合成的,来自于开发团队的头脑风暴. Type,有打字的意思,博客这个东西,正是一个让我们通过打 ...
- CF1826D Running Miles
题目链接 题解 知识点:贪心,前缀和,枚举. 首先考虑一个贪心结论,选择区间端点一定是两个最大值,因此 \(i_1 = l,i_3 = r\) . 考虑变形式子 \((b_l + l) + b_{i_ ...
- Linux IOS镜像中查看Kernel 版本号
开ISO镜像,到rpm包的目录里面去找到kernel-********.RPM这个包,中间的星号那一段就是内核版本
- 开年!5 款令人惊艳的开源项目「GitHub 热点速览」
朋友们开工大吉啊!我刚从假期模式切换回来,完全无心工作有些不在状态,比如开机密码错了好几次.闲话少叙,下面就让我们一起看看,春节这段时间 GitHub 上又出了什么有趣.好玩的开源项目. 今年上来就是 ...
- Linux下csv转Excel xlsx文件保持身份证号后三位不被省略
在Win下, 可以用Excel 或 WPS Spreadsheet里面的Data->Import, 将csv内容正确导入. 但是在Linux下, WPS的Spreadsheet不提供Data-& ...
- 【OpenGL ES】MVP矩阵变换
1 前言 本文主要介绍 MVP 矩阵变换,其本质是线性变换,应用见→绘制立方体. Model:模型变换,施加在模型上的空间变换,包含平移变换(translateM).旋转变换(rotateM).对 ...
- springboot项目读取自定义的properties文件
现在我们要在某个地方读取config.properties里的这几个属性值 这里使用三个注解即可读取自定义的配置文件内容(注意这里需要写他的setter和getter方法) @Component #注 ...