
新一代监控神器Prometheus+Grafana介绍及使用
一、介绍
1.什么是Prometheus?
普罗米修斯是一个开源的系统监控及报警工具,在2016年加入了 Cloud Native Computing Foundation,是继Kubernetes之后的第二个托管项目。
2.Prometheus的特征有什么?
- 具有由metric名称和键值对标示的时间序列数据的多位数据模型
- 有一个灵活的查询语言promQL
- 不依赖分布式存储,只和本地磁盘有关
- 通过HTTP来拉取(pull)时间序列数据
- 也支持推送(push)方式添加时间序列数据
- 多种图形和仪表盘支持
3.Prometheus的组件都有哪些?来张官方图:

- Prometheus Server 用于定时抓取数据指标(metrics)、存储时间序列数据(TSDB)
- Jobs/exporte 收集被监控端数据并暴露指标给Prometheus
- Pushgateway 监控端的数据会用push的方式主动传给此组件,随后被Prometheus 服务定时pull此组件数据即可
- Alertmanager 报警组件,可以通过邮箱、微信等方式
- Web UI 用于多样的UI展示,一般为Grafana
- 还有一些例如配置自动发现目标的小组件和后端存储组件
4.什么时候使用Prometheus
- 监控的对象动态可变,无法预先配置的时候
- Prometheus 是专为云环境(k8s/docker)提供的监控工具
- 想要更直观更简单的直接观察某项指标的数据变化时
5.看到一个写的非常不错的关Prometheus存储的文章
https://www.cnblogs.com/zqj-blog/p/12205063.html
二、搭建
1.安装Prometheus
官网下载地址:https://prometheus.io/download/ 选择自己所需版本即可
## 解压安装

tar zxf prometheus-2.22.0.linux-amd64.tar.gz -C /opt/vfan/

mv prometheus-2.22.0.linux-amd64 prometheus-2.22.0

cd prometheus-2.22.0/

## 可以通过--help或--version查看服务启动参数和版本等

./prometheus --help

./prometheus --version

## 启动服务,并指定配置文件

nohup ./prometheus --config.file="prometheus.yml" &> /dev/null &

## 查看端口占用情况(默认9090)

[root@VM-0-10-centos prometheus-2.22.0]# ss -tnlp

State       Recv-Q Send-Q                                  Local Address:Port                                                 Peer Address:Port

LISTEN      0      50                                                  *:3306                                                            *:*                   users:(("mysqld",pid=28673,fd=14))

LISTEN      0      128                                                 *:22                                                              *:*                   users:(("sshd",pid=1306,fd=3))

LISTEN      0      128                                                :::80                                                             :::*                   users:(("httpd",pid=31980,fd=4),("httpd",pid=31851,fd=4),("httpd",pid=30055,fd=4),("httpd",pid=21050,fd=4),("httpd",pid=14509,fd=4),("httpd",pid=12678,fd=4),("httpd",pid=12676,fd=4),("httpd",pid=9731,fd=4),("httpd",pid=9678,fd=4),("httpd",pid=2718,fd=4),("httpd",pid=1430,fd=4))

LISTEN      0      128                                                :::9090                                                           :::*                   users:(("prometheus",pid=11771,fd=10))
docker run \

    -p 9090:9090 \

    -v /path/to/prometheus.yml:/etc/prometheus/prometheus.yml \

    prom/prometheus
查看默认prometheus.yml文件:vim prometheus.yml
# my global config

global:

  scrape_interval:     15s # Set the scrape interval to every 15 seconds. Default is every 1 minute.

  evaluation_interval: 15s # Evaluate rules every 15 seconds. The default is every 1 minute.

  # scrape_timeout is set to the global default (10s).

# Alertmanager configuration

alerting:

  alertmanagers:

  - static_configs:

    - targets:

      # - alertmanager:9093

# Load rules once and periodically evaluate them according to the global 'evaluation_interval'.

rule_files:

  # - "first_rules.yml"

  # - "second_rules.yml"

# A scrape configuration containing exactly one endpoint to scrape:

# Here it's Prometheus itself.

scrape_configs:

  # The job name is added as a label `job=<job_name>` to any timeseries scraped from this config.

  - job_name: 'prometheus'

    # metrics_path defaults to '/metrics'

    # scheme defaults to 'http'.

    static_configs:

    - targets: ['localhost:9090']
目前只在监控Prometheus本机
可以登录普罗米修斯(服务器ip:9090)web界面,Status—>Rules下查看目前正在监控的目标
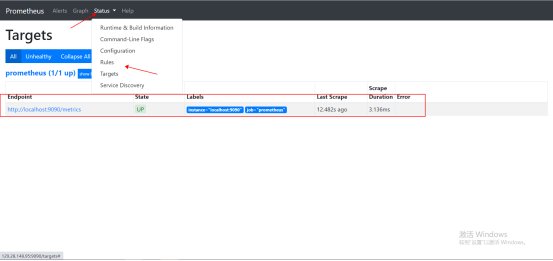
可以看到获取监控信息的终点是 本机ip+端口+/metrics:

也可以查看监控图形:Graph—>选择监控项—>Execute
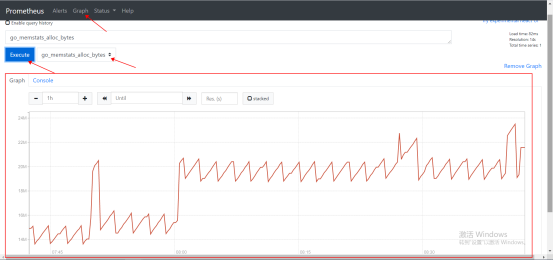
这种图形界面显然不太直观,所以引入Grafana。
2.安装node-exporter插件,添加监控机器
下载链接:https://prometheus.io/download/ 选择自己所需版本即可
## 解压安装

tar zxf node_exporter-1.0.1.linux-amd64.tar.gz -C /opt/vfan/

mv node_exporter-1.0.1.linux-amd64 node_exporter

cd node_exporter/

## 可以查看服务启动参数

./node_exporter --help

    --web.listen-address=":9100"    #可以指定监听端口

    --collector.ntp.server="127.0.0.1"  #可以指定ntp server

## 直接执行即可,--web.listen-address参数可以指定监听端口,默认9100。

nohup ./node_exporter --web.listen-address=":9100" &> /dev/null &

[root@VM-0-10-centos node_exporter]# ss -tnlp

State       Recv-Q Send-Q                                  Local Address:Port                                                 Peer Address:Port

LISTEN      0      50                                                  *:3306                                                            *:*                   users:(("mysqld",pid=28673,fd=14))

LISTEN      0      128                                                 *:22                                                              *:*                   users:(("sshd",pid=1306,fd=3))

LISTEN      0      128                                                :::9100                                                           :::*                   users:(("node_exporter",pid=26134,fd=3))

LISTEN      0      128                                                :::80                                                             :::*                   users:(("httpd",pid=31980,fd=4),("httpd",pid=31851,fd=4),("httpd",pid=30055,fd=4),("httpd",pid=21050,fd=4),("httpd",pid=14509,fd=4),("httpd",pid=12678,fd=4),("httpd",pid=12676,fd=4),("httpd",pid=9731,fd=4),("httpd",pid=9678,fd=4),("httpd",pid=2718,fd=4),("httpd",pid=1430,fd=4))

LISTEN      0      128
prometheus.yaml中添加node_exporter配置
scrape_configs:

  # The job name is added as a label `job=<job_name>` to any timeseries scraped from this config.

  - job_name: 'prometheus'

    # metrics_path defaults to '/metrics'

    # scheme defaults to 'http'.

    static_configs:

    - targets: ['localhost:9090']

  - job_name: 'node_demo1'

    static_configs:

    - targets: ['localhost:9100']
然后重启普罗米修斯服务,重启后再次查看监控目标:
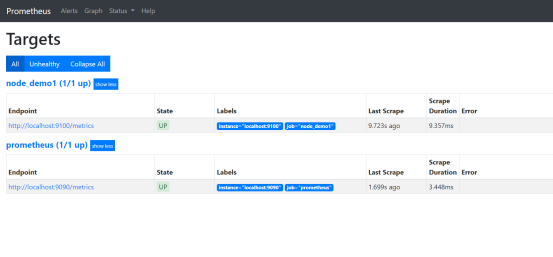
已经开始监控新的node
3.安装Grafana
下载链接:https://grafana.com/grafana/download
wget https://dl.grafana.com/oss/release/grafana-7.2.2.linux-amd64.tar.gz

## 解压安装

tar zxf grafana-7.2.2.linux-amd64.tar.gz -C /opt/vfan/

cd grafana-7.2.2

## 查看启动参数

./grafana-server --help

## 启动服务,默认端口3000

nohup ./grafana-server &> /dev/null &

[root@VM-0-10-centos conf]# ss -tnlp

State       Recv-Q Send-Q                                  Local Address:Port                                                 Peer Address:Port

LISTEN      0      50                                                  *:3306                                                            *:*                   users:(("mysqld",pid=28673,fd=14))

LISTEN      0      128                                                 *:22                                                              *:*                   users:(("sshd",pid=1306,fd=3))

LISTEN      0      128                                                :::9100                                                           :::*                   users:(("node_exporter",pid=26134,fd=3))

LISTEN      0      128                                                :::80                                                             :::*                   users:(("httpd",pid=31980,fd=4),("httpd",pid=31851,fd=4),("httpd",pid=30055,fd=4),("httpd",pid=21050,fd=4),("httpd",pid=14509,fd=4),("httpd",pid=12678,fd=4),("httpd",pid=12676,fd=4),("httpd",pid=9731,fd=4),("httpd",pid=9678,fd=4),("httpd",pid=2718,fd=4),("httpd",pid=1430,fd=4))

LISTEN      0      128                                                :::3000                                                           :::*                   users:(("grafana-server",pid=31050,fd=10))

LISTEN      0      128
Grafana默认的配置文件为:vim grafana-7.2.2/conf/defaults.ini;主要有监听端口、日志路径、默认登录帐号密码等
[server]

# Protocol (http, https, h2, socket)

protocol = http

# The ip address to bind to, empty will bind to all interfaces

http_addr =

# The http port to use

http_port = 3000

# The public facing domain name used to access grafana from a browser

domain = localhost

[security]

# disable creation of admin user on first start of grafana

disable_initial_admin_creation = false

# default admin user, created on startup

admin_user = admin

# default admin password, can be changed before first start of grafana, or in profile settings

admin_password = admin
现在可以通过ip+端口方式来访问Grafana:

第一次登陆会强制性修改密码,修改后即可进入
4.配置Grafana,增加可视化模板
第一步:添加数据源
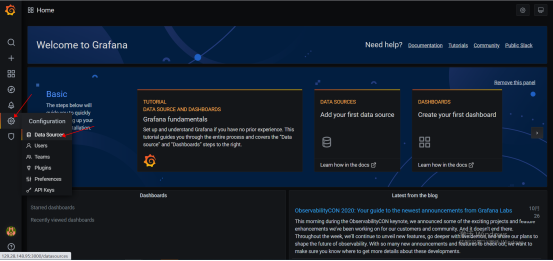
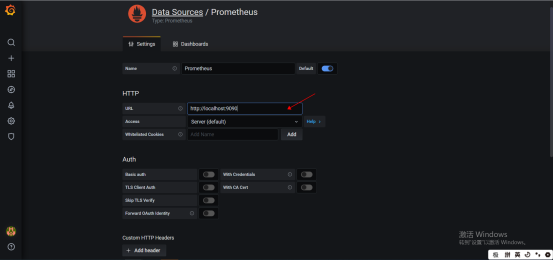
选择Prometheus,只需将URL修改为Prometheus服务地址,其余默认即可(也可自行修改):
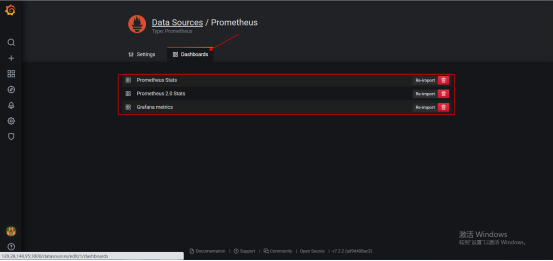
可以将Prometheus服务及Grafana服务的监控模板导入进去:
但要注意,导入Grafana的模板后,要在Prometheus.yml增加Grafana的监控:vim prometheus.yml
scrape_configs:

  - job_name: 'grafana'

    static_configs:

    - targets: ['localhost:3000']
点击保存,保存后查看数据源:

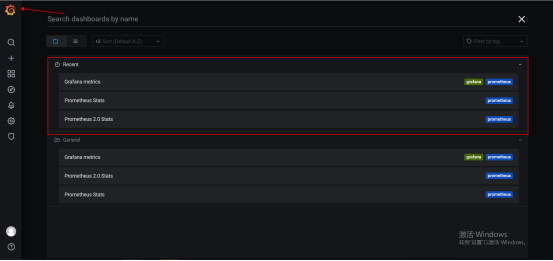
查看刚刚导入的模板,已经形成监控图形:
至此,Prometheus+Grafana基本组件搭建完成。
三、配置Grafana模板,配合Prometheus使用
1、监控系统指标
前提条件:
- 被监控的主机系统上已经安装node_exporter
- Prometheus.yml中已经添加此主机的Job
也就是以上第二步的第2点
前提条件准备完毕后,我们可以找一些实用且直观的模板来直接套用,不仅可以节省时间成本,实际效果也相当不错,如果有什么地方不能满足自己的需求,还可以在此基础上修改:
前往Grafana的官网下载Dashboard模板:https://grafana.com/grafana/dashboards
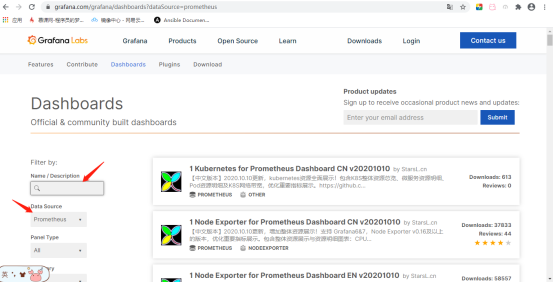
选择Prometheus,再根据关键字搜索
(1).点进去一个node_exporter的模板,可以查看样图,然后直接下载JSON文件

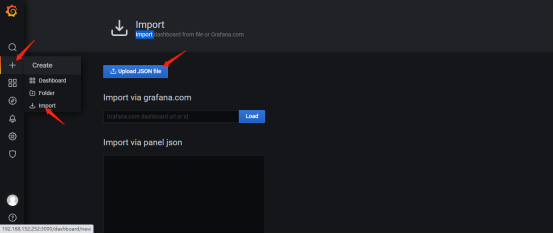
(2).点击加号—>import—>Upload JSON file
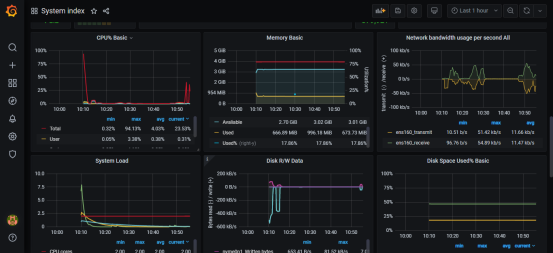
(3).模板导入后,即可进行监控
2、监控mysql服务各项指标
(1).Prometheus官网提供了mysqld的metric指标采集插件,可以直接下载:https://github.com/prometheus/mysqld_exporter/releases/download/v0.12.1/mysqld_exporter-0.12.1.linux-amd64.tar.gz
## 解压即可

tar zxf mysqld_exporter-0.12.1.linux-amd64.tar.gz
(2).下载安装完毕后,启动前,需要在mysql中创建一个Prometheus收集数据的账号:
mysql> create user 'promethues'@'localhost' IDENTIFIED BY 'promethues1';

Query OK, 0 rows affected (0.00 sec)

mysql> grant select,replication client,process on *.* to 'promethues'@'localhost';

Query OK, 0 rows affected (0.00 sec)

mysql> flush privileges;

Query OK, 0 rows affected (0.00 sec)
注意:这里的的localhost不是指mysqld服务的ip,是指mysqld_exporter的ip,因为promethues服务来找mysqld获取数据时,是先找到mysqld_exporter,然后mysqld_exporter再去mysqld获取数据。所以要保证mysqld_exporter的ip可以连接mysqld服务。
(3).在mysqld_exporter组件中配置mysql信息
创建一个保存mysql用户名密码的文件:vim mysqld_exporter/.my.cnf
[client]

user=promethues

password=promethues1
(4).启动mysqld_exporter组件,配置promethues.yml,并指定mysql账号信息文件
## 可以查看一些启动信息

./mysqld_exporter --help

## 启动,指定端口号,默认9104,指定连接mysql的用户文件

nohup ./mysqld_exporter --web.listen-address=":9104" --config.my-cnf=".my.cnf" &> /dev/null  &
## 添加以下配置:vim prometheus.yml

- job_name: 'mysqld'

    static_configs:

    - targets: ['localhost:9104']
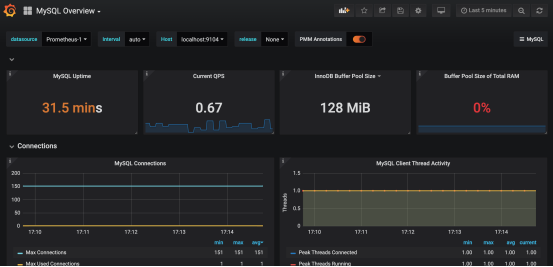
(5).并在Grafana添加mysqld模板
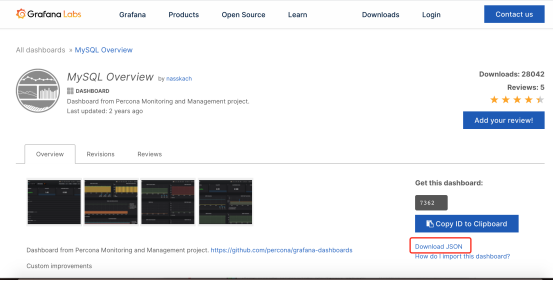
然后还是前往Grafana查找自己喜欢的模板:
以上只是简单演示了两个比较常用的插件,普罗米修斯官方还有许多插件可供使用。大家可慢慢研究。下文也将介绍Prometheus监控K8S集群的手段。
新一代监控神器Prometheus+Grafana介绍及使用的更多相关文章
- 微服务监控神器Prometheus的安装部署
本文涉及:如何在k8s下搭建Prometheus+grafana的监控环境 基本概念 Prometheus提供了容器和云原生领域数据搜集.存储.处理.可视化和告警一套完整的解决方案,最初时是由Soun ...
- Spring Boot Metrics监控之Prometheus&Grafana(转)
欢迎来到Spring Boot Actuator教程系列的第二部分.在第一部分中,你学习到了spring-boot-actuator模块做了什么,如何配置spring boot应用以及如何与各样的ac ...
- 监控平台prometheus+grafana+snmp_explorer+blackbox_exporter+alertmanager
一.背景介绍 公司需要监控交换机和IP设备,能够放在展示屏幕,及时发出告警信息.网上有很多监控软件,prometheus系列已经能够满足我们需求.prometheus功能强大,本次只用到一部功能.咱们 ...
- 机房ping监控 smokeping+prometheus+grafana
一.前言 1.本监控方案主要由smokeping+promethues+grafana组成.smokeping主要数据采集,promethues作为数据存储,grafana数据展示 2.其实smoke ...
- 监控实战Prometheus+Grafana
这期的分享是监控实战,其实不想写这篇的,因为网上相关的文章也挺多的,但是出于光说不练都是假把式,而且也想告诉你:当帅气的普罗米修斯(Prometheus)遇到高颜值的格拉法纳(Grafana)究竟会擦 ...
- 机房ping监控 smokeping+prometheus+grafana(续) 自动获取各省省会可用IP
一.前言 1.之前的文章中介绍了如何使用smokeping监控全国各省的网络情况:https://www.cnblogs.com/MrVolleyball/p/10062231.html 2.由于之前 ...
- 服务器性能监控神器nmon使用介绍
介绍 Nmon (Nigel's Monitor)是由IBM 提供.免费监控 AIX 系统与 Linux 系统资源的工具.该工具可将服务器系统资源耗用情况收集起来并输出一个特定的文件,并可利用 exc ...
- 【k8s 硬盘监控】prometheus grafana
设置监控哪块盘: https://www.bountysource.com/issues/50160777-disk-space-usage-depcited-in-grafana-correct h ...
- Rancher2.x 一键式部署 Prometheus + Grafana 监控 Kubernetes 集群
目录 1.Prometheus & Grafana 介绍 2.环境.软件准备 3.Rancher 2.x 应用商店 4.一键式部署 Prometheus 5.验证 Prometheus + G ...
- 初试 Prometheus + Grafana 监控系统搭建并监控 Mysql
转载自:https://cloud.tencent.com/developer/article/1433280 文章目录1.Prometheus & Grafana 介绍1.1.Prometh ...
随机推荐
- 嵌入式必看!全志T113-i+玄铁HiFi4核心板硬件说明资料分享
目 录 1 硬件资源 2 引脚说明(篇幅问题,暂不提供详细内容) 3 电气特性 4 机械尺寸 5 底板设计注意事项 硬件资源 SOM-TLT113核心板板载CPU.ROM.RAM.晶振.电源.LED等 ...
- Unity中创建多边形并计算面积
问题背景: 我这边最近需要实现动态去画多边形(不规则的),类似于高德地图中那种面积测量工具一般. 方案: "割耳"算法实现三角化平面. 具体实现: 割耳算法类: /* ****** ...
- [oeasy]python0 113_字符编码_VT100控制码_iso_8859_1_拉丁字符_latin
拉丁字符 回忆上次内容 上次回顾了字型编码的进化过程 7-bit 的 点阵字库 终于让 字母.数字.标点 明确了字型 但是 7-bit 的 ascii中 没有法文字符的位置 添加图 ...
- 巧用 QLineF 从 QTransform 提取角度
我们在对 QGraphicsItem 进行变换时,QT 提供了很多便捷的方法.但当我们想获取当前变换的角度时却有些困难,因为 QTransform 没有提供获取角度的方法.在文章Qt 从 QTrans ...
- scratch编程作品-龙年发大财
作品介绍: 龙年欢歌而来,带着满满的希望与勃勃生机.愿小虎鲸Scratch资源站激发您编程之路的无限灵感,让每一天都充满探索与创造的喜悦.在这吉祥如意的年份里,愿您的每一份耕耘都换来丰收的喜悦,每一个 ...
- 基于Hive的大数据分析系统
1.概述 在构建大数据分析系统的过程中,我们面对着海量.多源的数据挑战,如何有效地解决这些零散数据的分析问题一直是大数据领域研究的核心关注点.大数据分析处理平台作为应对这一挑战的利器,致力于整合当前主 ...
- ComfyUI插件:ComfyUI Impact 节点(二)
前言: 学习ComfyUI是一场持久战,而 ComfyUI Impact 是一个庞大的模块节点库,内置许多非常实用且强大的功能节点 ,例如检测器.细节强化器.预览桥.通配符.Hook.图片发送器.图片 ...
- ansible 001 ansible介绍 原理 主机清单 定义变量 提权与连接
ansible 自动化运维 ansible 部署应用程序 (在操作系统层面之上) 系统初始化过程 主机名,yun源,网络,服务,时间同步,内核参数 (可以在pxe这里完成) ansible可以方便10 ...
- 【Node】下载安装(Linux)
不要使用源码包安装!!!编译时间太长!! 不要使用源码包安装!!!编译时间太长!! 不要使用源码包安装!!!编译时间太长!! 使用Node源码包安装 这里使用的是源码包安装 Node官网地址:也不是官 ...
- git submodule子模块操作
背景 为什么使用子模块,因为需要使用其他人维护的公共组件,但这些组件并不是以包或库的形式使用的.所以采用子模块的形式,无论是自己修改还是拉取也很方便. 子模块操作 增加子模块 git submodul ...