Automatically generating nice graphs at end of your Load Test with Apache JMeter and JMeter-Plugins
Update as of November 2017:
Since JMeter 3.0, last version being 3.3, JMeter provides Out Of The Box a dynamic Web report with tons of information.
You can read an up to date blog (15th january 2019) described here.
We highly advise you to use it instead of what is described below which is no more necessary.
Report contains more sexy graphs, tables (Errors synthesis, Top 5 errors by sampler, APDEX…) that will help you analyze your load test more easily and open it in a Browser.
Creating it is just a matter of adding 2 more command-line options in NON GUI load test.
We are the proud implementers and contributors of this web-report that was partly sponsored by Decathlon (a great French and worldwide sports company).
Context
You are using Apache JMeter for your Load Tests.
Once test has ended, you would like your favorite tool to automatically generate for you nice and meaningful graphs so that you can faster analyze your test results and include them in your report.
Apache JMeter is great in many ways but its core lacks this built-in feature, but it’s plugin Architecture will let us add it easily.
Hopefully a great must have Open Source and free third-party library called JMeter-Plugins comes to the rescue.
Before version 1.1.3 of JMeter-Plugins, you could use JMeterPluginsCMD Command Line Tool to generate your graphs in a shell, but this was not optimal.
As users of both Apache JMeter and JMeter-Plugins, we decided to contribute this new feature to JMeter-Plugins.
Our philosophy is :
- “If you use an Open-Source and free project, be grateful, always contribute in a way”
About author:
Philippe Mouawad works as an Architect and technical expert for Ubik-Ingenierie where he leads among other things the development of UbikLoadPack a set of Commercial Plugins for Apache JMeter allowing to load test different protocols like HLS, GWT, Flex.
Philippe is a committer on the Apache JMeter project and member of the PMC since October 2011.
Finally he is a co-author of a french book on JMeter called Maîriser JMeter: Du test de charge à Devops.
Feature Overview
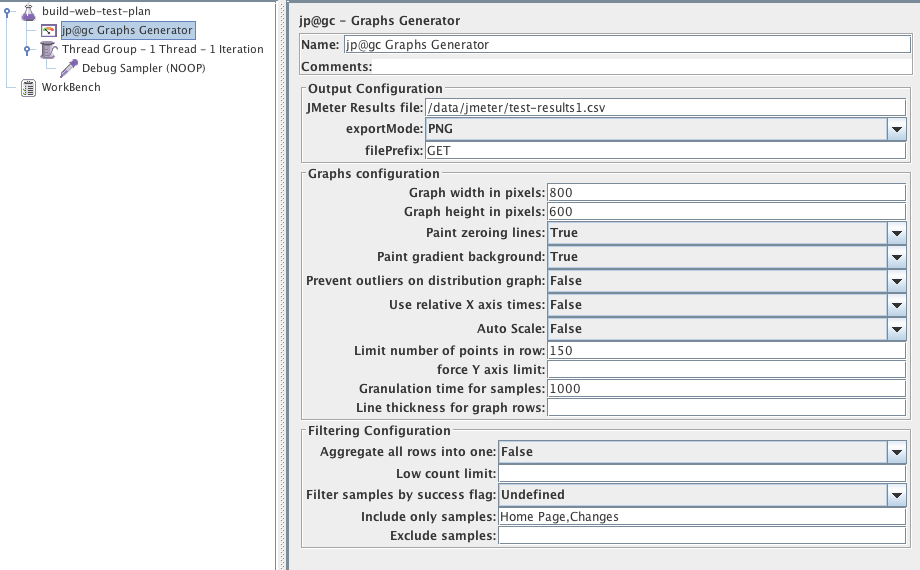
To automatically generate your reports just add a new Listener called “jp@gc Graphs Generator“.
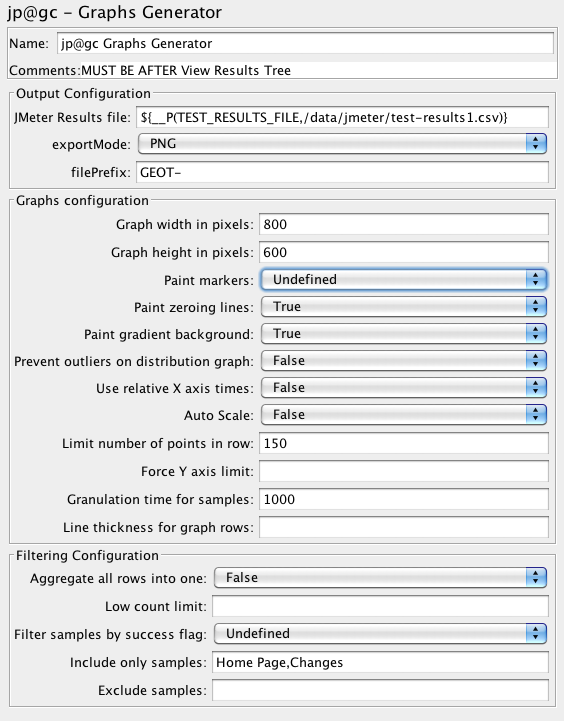
You can define the following properties:
| Property | Description/Possible Values |
| Graph width in pixels | for PNG only – width of the image, default is 800 |
| Graph height in pixels | for PNG only – height of the image, default is 600 |
| granulation time for samples | granulation time for samples |
| relative-times <true/false> | use relative X axis times, no will set absolute times |
| Aggregate all Rows into one | True/False |
| Paint gradient background | True/False |
| Paint markers | paint markers |
| Paint zeroing lines | paint zeroing lines |
| paint-markers <yes/no> | paint markers on data points (since 1.1.3) |
| prevent-outliers <yes/no> | prevent outliers on distribution graph |
| Limit number of points in row | limit number of points in row |
| Force Y axis limit | Force input value as Y axis limit |
| Low count limit | hide points with sample count below input limit |
| success-filter <true/false/Undefined> | filter samples by success flag (since 0.5.6), possible values are:
|
| Include only samples | Comma-separated list of samples to be graphed |
| Exclude samples | Exclude from report samples with specified labels, comma-separated |
| Auto-Scale | enable/disable auto-scale multipliers for perfmon/composite graph |
| line thickness for graph rows | line thickness for graph rows |
JMeter Setup:
JMeter-Plugin installation:
- Use JMeter version >= 2.10
- Download extras bundle and unzip it, copy lib/ext/JMeterPlugins-Extras.jar to <jmeter home>/lib/ext.
- Restart jmeter.
JMeter Configuration:
Edit <jmeter home>/bin/user.properties and ensure you set these properties:
jmeter.save.saveservice.output_format=csv

jmeter.save.saveservice.data_type=false

jmeter.save.saveservice.label=true

jmeter.save.saveservice.response_code=true

jmeter.save.saveservice.response_data.on_error=false

jmeter.save.saveservice.response_message=false

jmeter.save.saveservice.assertion_results_failure_message=false

jmeter.save.saveservice.successful=true

jmeter.save.saveservice.thread_name=true

jmeter.save.saveservice.time=true

jmeter.save.saveservice.subresults=false

jmeter.save.saveservice.assertions=true

jmeter.save.saveservice.latency=true

jmeter.save.saveservice.bytes=true

jmeter.save.saveservice.hostname=true

# This will enable correct graphs display

# which deal with threads after reloading the results file.

jmeter.save.saveservice.thread_counts=true

jmeter.save.saveservice.sample_count=true

jmeter.save.saveservice.timestamp_format=HH:mm:ss

jmeter.save.saveservice.default_delimiter=;

jmeter.save.saveservice.print_field_names=true

# This is needed to ensure all results are

# available when Listener runs

jmeter.save.saveservice.autoflush=true
Test Plan setup:
If using distributed testing, ensure you add to your Thread Group names:
${__machineName()}_My Threadgroup name
Test Plan example:
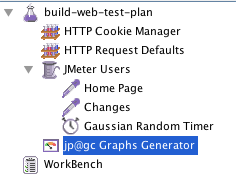
We will use a test plan you can easily create with Templates…> Building a Web Test Plan
We just added an Http Cookie Manager and removed Graph Results listener.
We end up with this, the only listener is the new jp@gc Graphs Generator
Let’s run plan:
Now run this plan in NON-GUI mode as per JMeter Best-Practices using following command-line:
./jmeter -t GraphsReportListener-GenerationAtEndOfTestNonGUI.jmx -n

  -l /data/jmeter/test-results.csv

 -JTEST_RESULTS_FILE=/data/jmeter/test-results.csv
Notice the following:
- -t GraphsReportListener-GenerationAtEndOfTestNonGUI.jmx : Means use following jmx file GraphsReportListener-GenerationAtEndOfTestNonGUI.jmx
- -n : Means NON GUI
- -l /data/jmeter/test-results.csv : Means output results in following file
- -JTEST_RESULTS_FILE=/data/jmeter/test-results.csv : Notice we set the same value as output file in 3). We set this because in “jp@gc Graphs Generator” we have used __P function in JMeter to replace TEST_RESULTS_FILE by the value we input in -J:
- ${__P(TEST_RESULTS_FILE,/data/jmeter/test-results.csv)}

In this configuration, notice we have decided to only include 2 samples:
- Home Page
- Changes
In a real worl scenario, you would use Transaction Controller for meaningful transaction names and only include those in your report.
Results:
At end of test JMeter automatically generated in <jmeter home>/bin folder the following files:
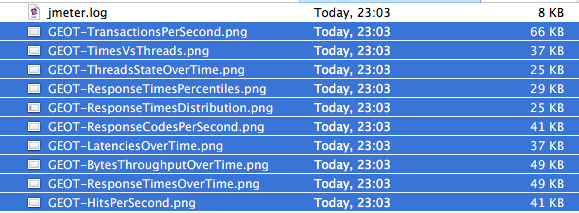
Graphs:
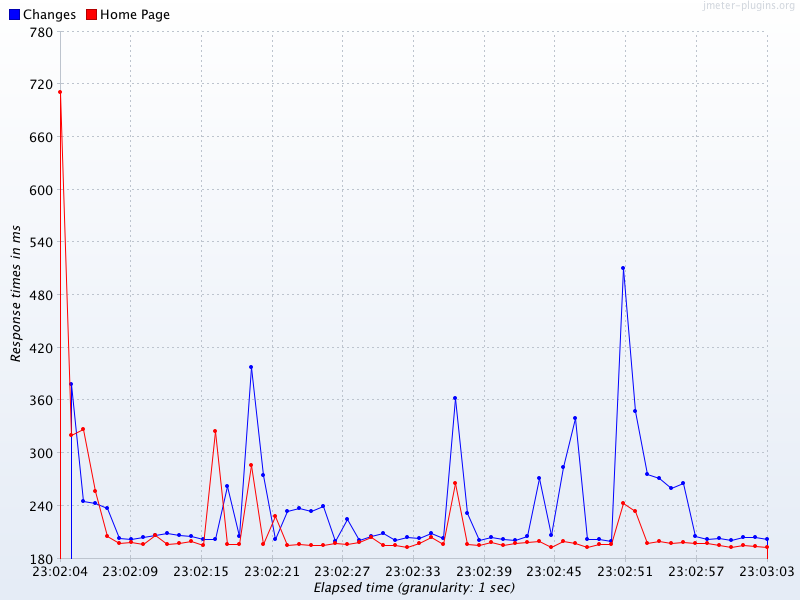
Response Times over time:
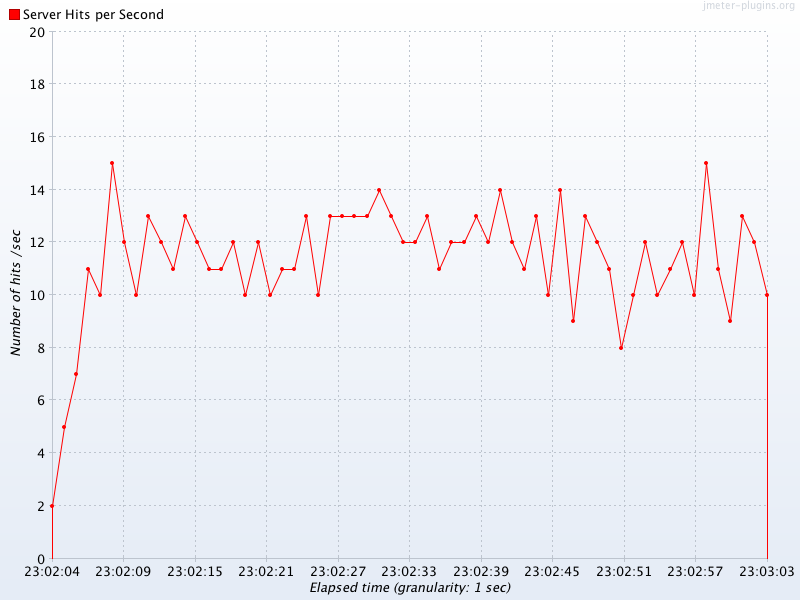
Hits Per Second:
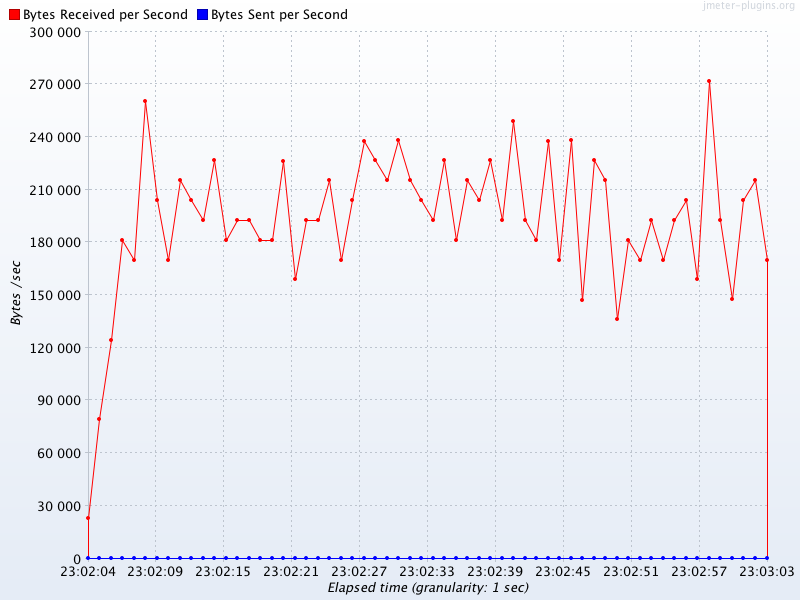
Bytes throughput over time:
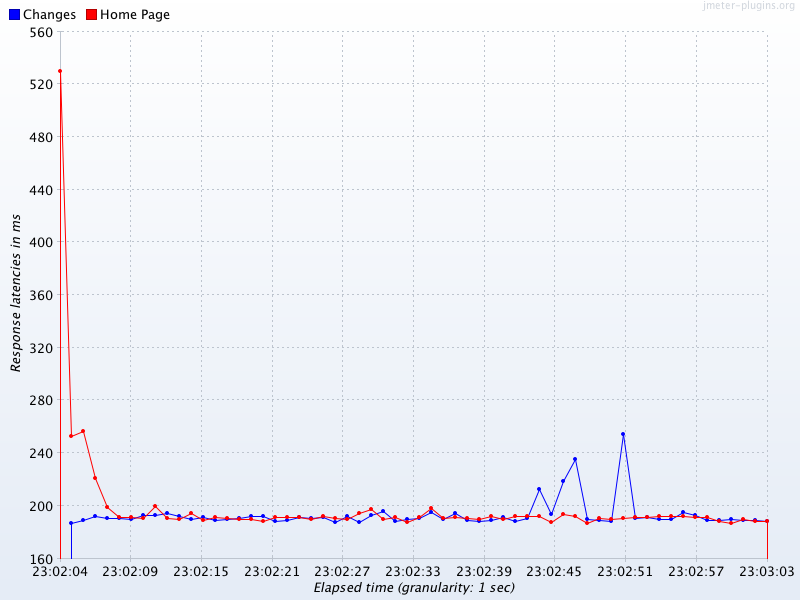
Latencies over time:
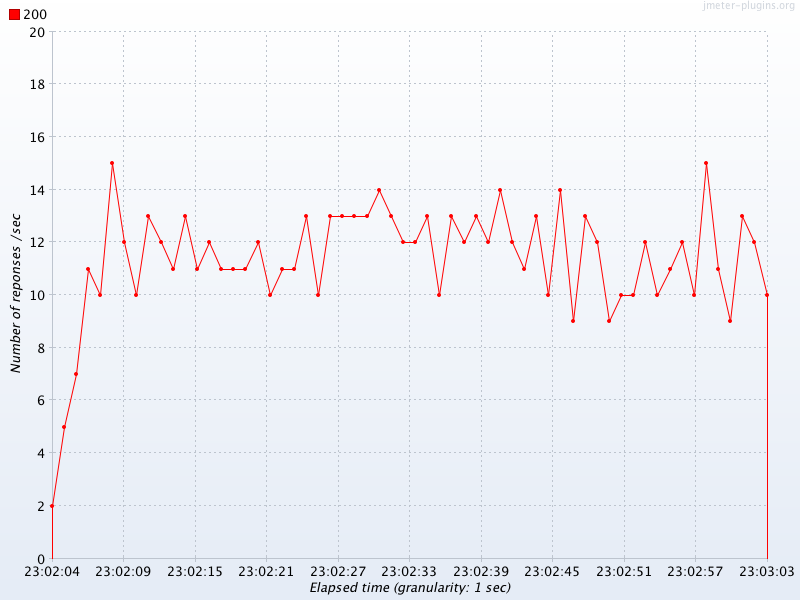
Response codes per second:
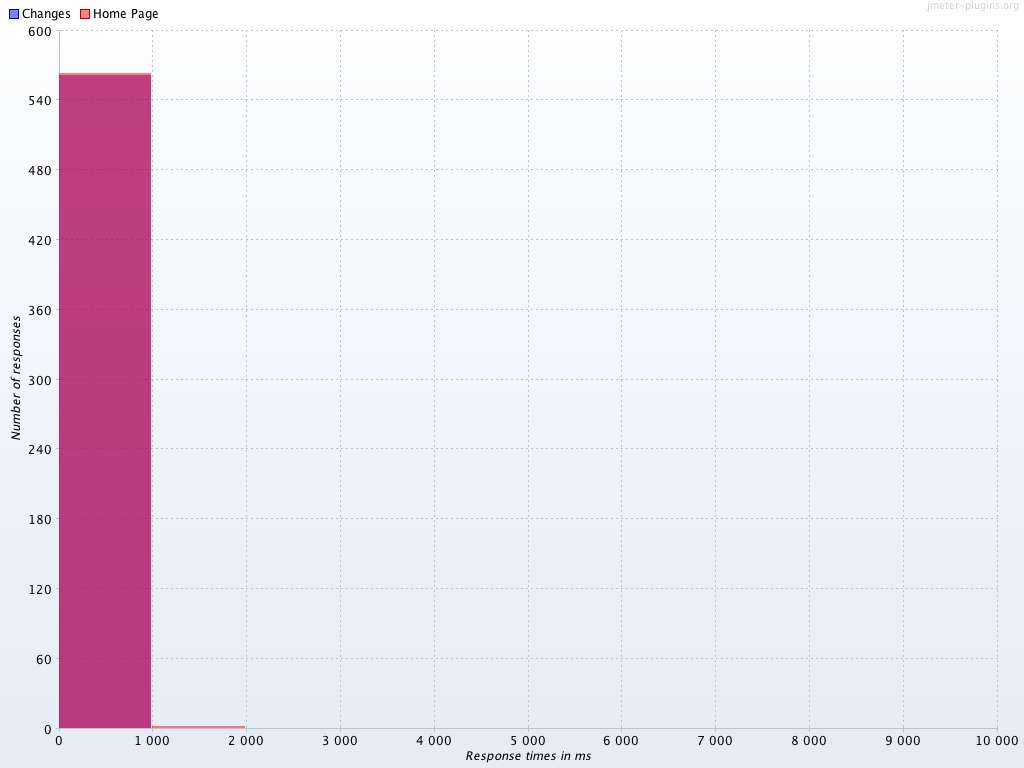
Response times distribution:
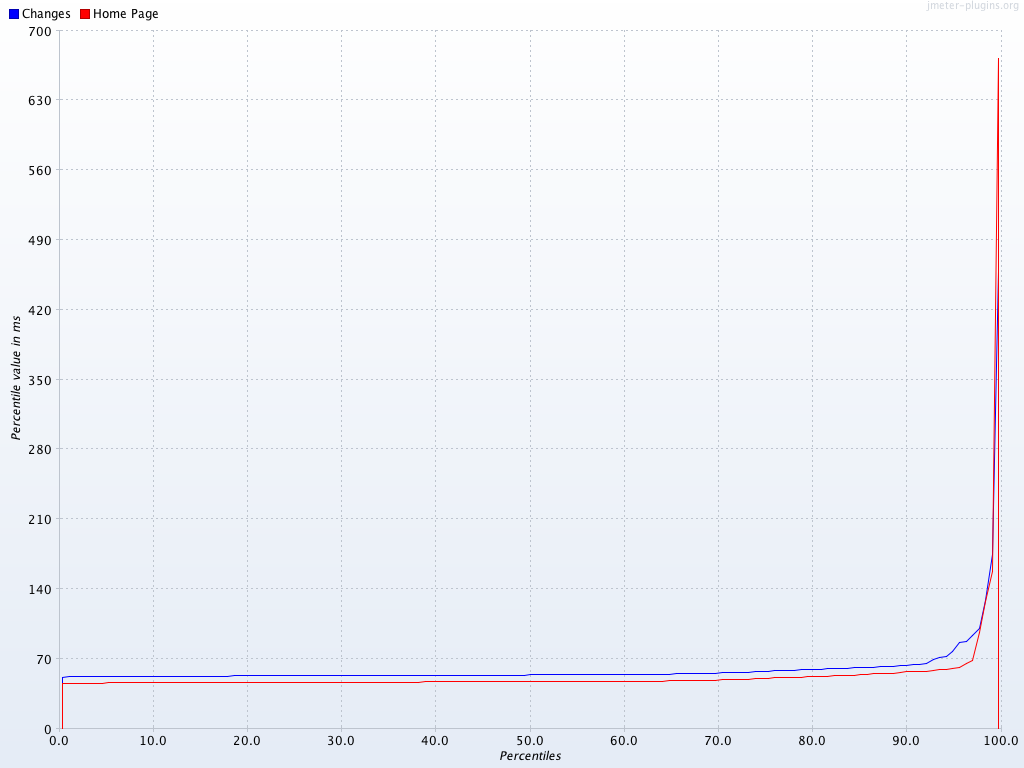
Response times percentiles:
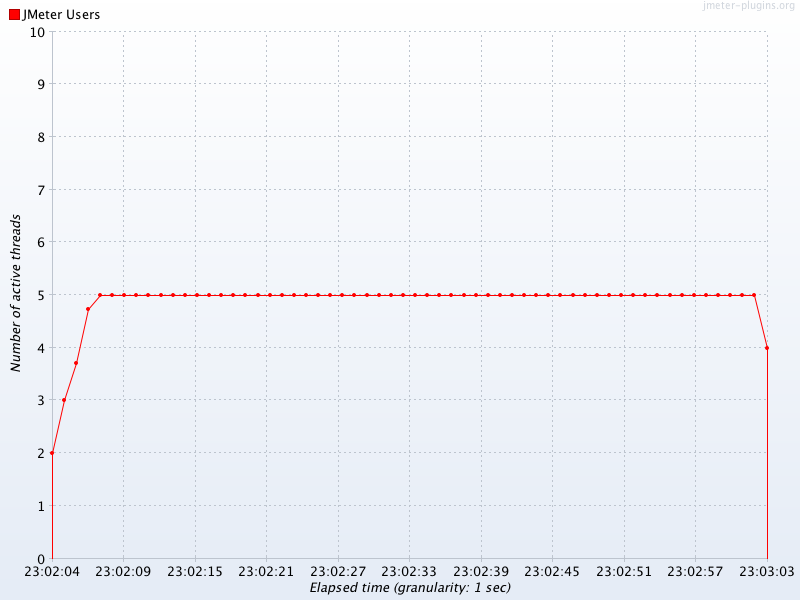
Threads state over time:
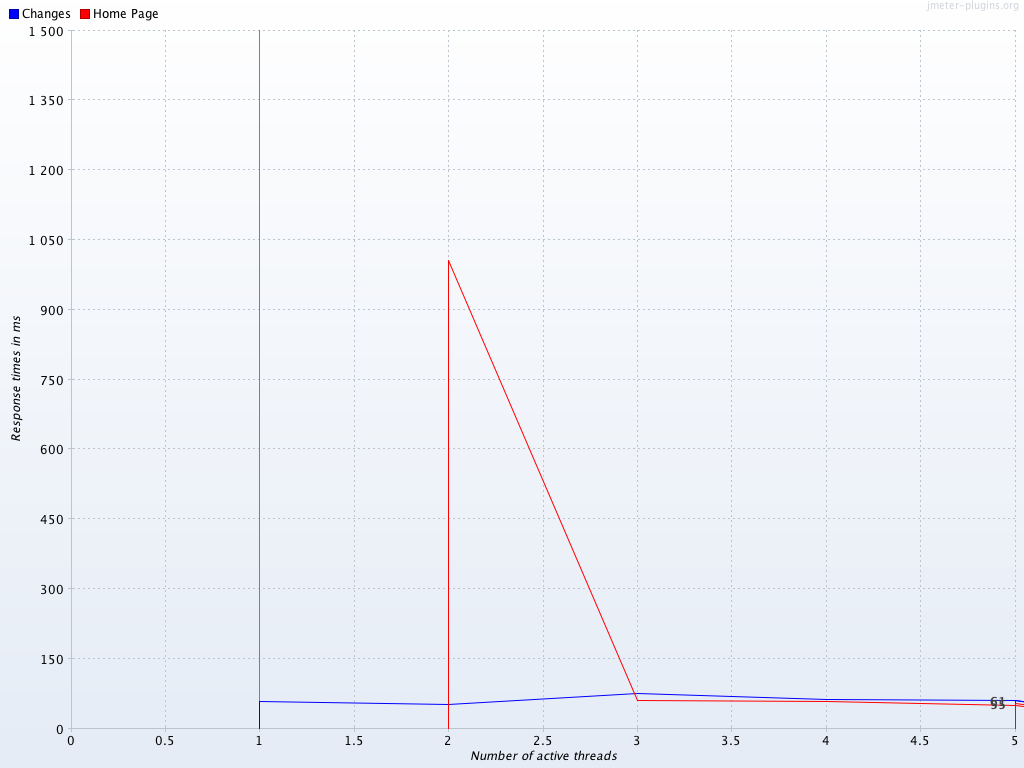
Time vs Threads:
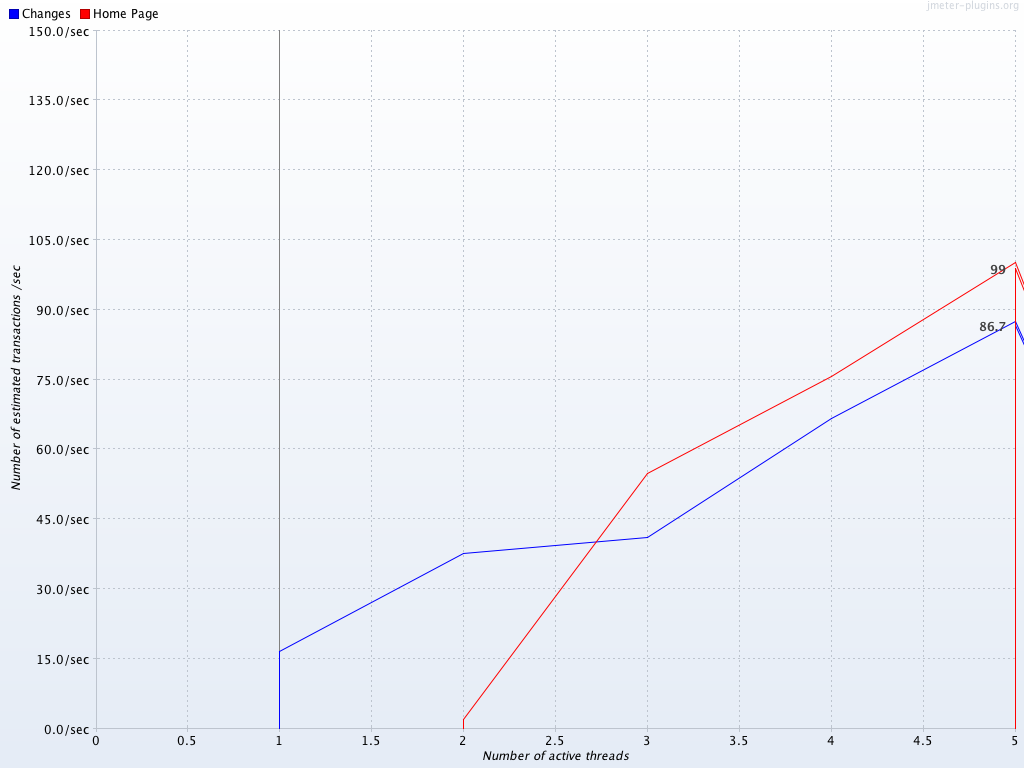
Transactions per second:
Throughput vs Threads:
Other Features
Graphs Generator Listener can also generate CSV files besides PNG files.
Graph Generator Listener can even generate graphs for existing results, to do so, create a fake plan like the following:
Run it in GUI or NON-GUI mode, the graphs will be generated.
Ensure you use the same properties configuration you used during the test that generated the results you are graphing.
NDLR:
With this new Graphs Generator Listener , you can now easily:
- Generate meaningful and sexy graphs at the end of your test
- Generate meaningful and sexy graphs for existing results any time you want
- Output CSVs with computed datas at end of your test if you want to use custom graphs
- Output CSVs with computed datas for existing results any time you want if you want to use custom graphs
About author:
Philippe Mouawad is a developer, committer and member of the JMeter Project Management Committee at Apache.
He is also the co-author of the book Master JMeter : from load testing to DevOps
Automatically generating nice graphs at end of your Load Test with Apache JMeter and JMeter-Plugins的更多相关文章
- Jmeter3.0新特性
2016-5-19昨日,Jmeter又更新了新版本. 那么新版本有哪些新特性呢? Changes This page details the changes made in the current ...
- ARTIFICIAL INTELLIGENCE FOR GAMES (Ian Millington / John Funge 著)
相关网站:http://www.ai4g.com PART I AI AND GAMESCHAPTER1 INTRODUCTIONCHAPTER2 GAME AIPART II TECHNIQUESC ...
- Python equivalent of D3.js
http://brandonrose.org/ Python equivalent of D3.js Ask Question Asked 7 years, 1 month ago Act ...
- P6 Professional Installation and Configuration Guide (Microsoft SQL Server Database) 16 R1
P6 Professional Installation and Configuration Guide (Microsoft SQL Server Database) 16 R1 May ...
- Free Slideshow, Gallery And Lightboxes Scripts
http://bootstraphelpers.codeplex.com/SourceControl/list/changesets https://github.com/gordon-matt/Bo ...
- windows 下使用 zip安装包安装MySQL 5.7
以下内容参考官方文档:http://dev.mysql.com/doc/refman/5.7/en/windows-start-command-line.html 解压缩zip到D:\mysql-5. ...
- Ubuntu环境下Hadoop1.2.1, HBase0.94.25, nutch2.2.1各个配置文件一览
/×××××××××××××××××××××××××××××××××××××××××/ Author:xxx0624 HomePage:http://www.cnblogs.com/xxx0624/ ...
- yarn源代码
Modules-------YARN consists of multiple modules. The modules are listed below as per the directory s ...
- springboot 注册dao层 service 层
可以使用三种注解来引入DAO层的接口到spring容器中.1.@Mapper,写在每一个DAO层接口上,如下: 2.@MapperScan和@ComponentScan两者之一.前者的意义是将指定包中 ...
随机推荐
- 用junit Test Suite来组合测试
在测试过程中,有时可能想一次性运行所有的测试类,或是选择性的运行某些测试类.这样的话我们就可以用TestSuite来统一管理我们的测试类. 比如说我现在有三个测试类:junitTest4,TestCa ...
- Tips on Python
python是一种解释性文件,代码要通过解释器解释运行.python解释器就是python.exe这个程序. pip也是一个pip.exe的程序,是用来管理python的第三方库. 有两种执行方式:脚 ...
- L1434滑雪
一,看题 1,这个长度怎么算的. 从它自己数,可以走下去的位置. 2,这个题的衣服怎么披上去呀. 3,搜索目标,状态. 肯定要用坐标,不然怎么搜索. 4,在前期还是多写把. 5,我靠这个点还是随机的& ...
- MySQL 开启慢查询日志与普通日志
一.开启满查询日志 1.查看慢查询日志 SHOW VARIABLES LIKE '%slow%'; 2.开启慢查询日志 set GLOBAL slow_query_log =on; 3.设置慢查询日志 ...
- java 数组遍历(方法内部的代码)
//数组遍历(依次输出数组中的每一个元素)二维数组: int[][] arr={{1,2},{3,4,5},{6,7}}; for(int i=0;i<arr.length;i++){ for( ...
- 13-ESP8266 SDK开发基础入门篇--上位机串口控制 Wi-Fi输出PWM的占空比,IEEE754规约
https://www.cnblogs.com/yangfengwu/p/11100552.html 这节做个上位机控制Wi-Fi引脚输出的PWM占空比信号,灯的亮度就可以用上位机控制了 大家可以自己 ...
- Cogs 727. [网络流24题] 太空飞行计划(最大权闭合子图)
[网络流24题] 太空飞行计划 ★★☆ 输入文件:shuttle.in 输出文件:shuttle.out 简单对比 时间限制:1 s 内存限制:128 MB [问题描述] W 教授正在为国家航天中心计 ...
- 程序日志-应用程序-特定 权限设置并未向在应用程序容器 不可用 SID (不可用)中运行的地址 LocalHost (使用 LRPC) 中的用户 NT AUTHORITY\SYSTEM SID (S-1-5-18)授予针对 CLSID 为 {D63B10C5-BB46-4990-A94F-E40B9D520
应用程序-特定 权限设置并未向在应用程序容器 不可用 SID (不可用)中运行的地址 LocalHost (使用 LRPC) 中的用户 NT AUTHORITY\SYSTEM SID (S-1-5-1 ...
- OpenFOAM——梯形腔双边驱流
本算例来自<ANSYS Fluid Dynamics Verification Manual>中的VMFL054: Laminar flow in a Trapezoidal Cavity ...
- Java URLDecoder和URLEncoder对中文进行编码和解码
URLDecoder类包含一个decode(String s,String enc)静态方法,它可以将application/x-www-form-urlencoded MIME字符串转成普通字符串: ...