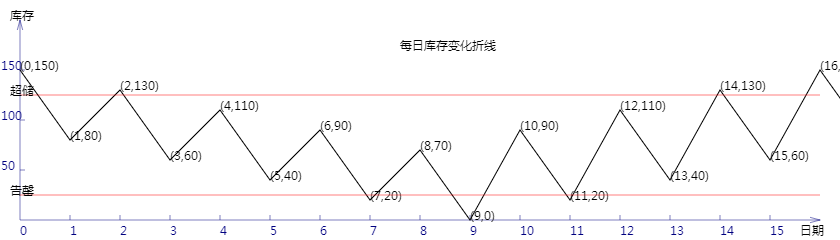
HTML5 Canvas 绘制库存变化折线 增加超储告罄线
<!DOCTYPE html>
<html lang="utf-8">
<meta http-equiv="Content-Type" content="text/html; charset=utf-8"/>
<head>
     <title>库存曲线</title>
    </head>

     <body onload="draw()">
        <canvas id="myCanvus" width="840px" height="240px" style="border:1px dashed black;">
            出现文字表示你的浏览器不支持HTML5
        </canvas>
     </body>
</html>
<script type="text/javascript">
<!--
    function draw(){
        var canvas=document.getElementById("myCanvus");
        var canvasWidth=840;
        var canvasHeight=240;

        var context=canvas.getContext("2d");

        context.fillStyle = "white";
        context.fillRect(0, 0, canvasWidth, canvasHeight);

        context.strokeStyle = "black";
        context.fillStyle = "black";

        context.save();

        // 进行坐标变换:把原点放在左下角,东方为X轴正向,北方为Y轴正向
        var offset=20;// 偏移值,用来画坐标轴

        context.save();
        context.translate(0+offset,canvasHeight-offset);
        context.rotate(getRad(180));
        context.scale(-1,1);

        drawAxisX(context);
        drawAxisY(context);

        var actualStock=100;
        var inbounds=[50,0,50,0,50,0,50,0,50,0,90,0,90,0,90,0,90,0,];
        var outbounds=[0,70,0,70,0,70,0,70,0,70,0,70,0,70,0,70,0,70,];

        drawStockCurve(context,actualStock,inbounds,outbounds);
        drawBounds(context);

        context.restore();

        context.fillText("每日库存变化折线",400,50);

        context.fillText("库存",10,20);
        context.fillText("日期",800,235);
    }

    function drawBounds(ctx){
        ctx.save();

        ctx.lineWidth=0.5;
        ctx.strokeStyle='red';

        // 画underage
        ctx.beginPath();
        ctx.moveTo(0, 25);
        ctx.lineTo(800, 25);
        ctx.stroke();
        ctx.closePath();

        ctx.save();
        ctx.translate(-10,25);
        ctx.rotate(getRad(180));
        ctx.scale(-1,1);
        ctx.fillText("告罄",0,0);
        ctx.restore();

        ctx.restore();

        ctx.save();

        ctx.lineWidth=0.5;
        ctx.strokeStyle='red';

        // 画underage
        ctx.beginPath();
        ctx.moveTo(0, 125);
        ctx.lineTo(800, 125);
        ctx.stroke();
        ctx.closePath();

        ctx.save();
        ctx.translate(-10,125);
        ctx.rotate(getRad(180));
        ctx.scale(-1,1);
        ctx.fillText("超储",0,0);
        ctx.restore();

        ctx.restore();
    }

    function drawStockCurve(ctx,actualStock,inbounds,outbounds){
        ctx.save();

        ctx.lineWidth=1;
        ctx.strokeStyle='black';
        ctx.fillStyle='black';

        var y=actualStock;
        var x;

        ctx.beginPath();
        for(var i=0;i<inbounds.length;i++){
            y=y+inbounds[i]-outbounds[i];
            x=i*50;
            ctx.lineTo(x, y);

            ctx.save();
            // 因坐标变换会导致文字错位,故采用位移+旋转+缩放的方式恢复
            ctx.translate(x,y);
            ctx.rotate(getRad(180));
            ctx.scale(-1,1);
            ctx.fillText("("+i+","+y+")",0,0);
            ctx.restore();
        }
        ctx.stroke();
        ctx.closePath();

        ctx.restore();
    }

    function drawAxisX(ctx){
        ctx.save();

        ctx.lineWidth=0.5;
        ctx.strokeStyle='navy';
        ctx.fillStyle='navy';

        // 画轴
        ctx.beginPath();
        ctx.moveTo(0, 0);
        ctx.lineTo(800, 0);
        ctx.stroke();
        ctx.closePath();

        ctx.beginPath();
        ctx.moveTo(800-Math.cos(getRad(15))*10, Math.sin(getRad(15))*10);
        ctx.lineTo(800, 0);
        ctx.lineTo(800-Math.cos(getRad(15))*10, -Math.sin(getRad(15))*10);
        ctx.stroke();
        ctx.closePath();

        // 画刻度
        var x,y;
        y=5;
        for(x=50;x<800;x+=50){
            ctx.beginPath();
            ctx.moveTo(x, 0);
            ctx.lineTo(x, y);

            ctx.stroke();
            ctx.closePath();
        }

        // 写文字
        var i=0;
        for(x=0;x<800;x+=50){
            ctx.save();
            ctx.scale(1,-1);
            ctx.fillText(i,x,y+10);
            ctx.restore();

            i++;
        }

        ctx.restore();
    }

    function drawAxisY(ctx){
        ctx.save();

        ctx.lineWidth=0.5;
        ctx.strokeStyle='navy';
        ctx.fillStyle='navy';

        // 画轴
        ctx.beginPath();
        ctx.moveTo(0, 0);
        ctx.lineTo(0, 200);
        ctx.stroke();
        ctx.closePath();

        ctx.beginPath();
        ctx.moveTo(Math.sin(getRad(15))*10, 200-Math.cos(getRad(15))*10);
        ctx.lineTo(0, 200);
        ctx.lineTo(-Math.sin(getRad(15))*10, 200-Math.cos(getRad(15))*10);
        ctx.stroke();
        ctx.closePath();

        // 画刻度
        var x,y;
        x=5;
        for(y=50;y<200;y+=50){
            ctx.beginPath();
            ctx.moveTo(x, y);
            ctx.lineTo(0, y);

            ctx.stroke();
            ctx.closePath();
        }

        // 写文字
        x=-19;
        for(y=50;y<200;y+=50){
            ctx.save();

            ctx.scale(1,-1);
            ctx.translate(0,-200);

            ctx.fillText(200-y,x,y);
            ctx.restore();
        }

        ctx.restore();
    }

    function getRad(degree){
        return degree/180*Math.PI;
    }
//-->
</script>
HTML5 Canvas 绘制库存变化折线 增加超储告罄线的更多相关文章
- HTML5 Canvas 绘制库存变化折线 画入库出库柱状图
代码: <!DOCTYPE html> <html lang="utf-8"> <meta http-equiv="Content-Type ...
- HTML5 Canvas 绘制库存变化折线 计算出库存周转率
<!DOCTYPE html> <html lang="utf-8"> <meta http-equiv="Content-Type&quo ...
- HTML5 Canvas 绘制库存变化折线 计算出最高最低库存
<!DOCTYPE html> <html lang="utf-8"> <meta http-equiv="Content-Type&quo ...
- HTML5 Canvas 绘制库存变化折线
<!DOCTYPE html> <html lang="utf-8"> <meta http-equiv="Content-Type&quo ...
- 使用html5 Canvas绘制线条(直线、折线等)
使用html5 Canvas绘制直线所需的CanvasRenderingContext2D对象的主要属性和方法(有"()"者为方法)如下: 属性或方法 基本描述 strokeSty ...
- html5 Canvas绘制图形入门详解
html5,这个应该就不需要多作介绍了,只要是开发人员应该都不会陌生.html5是「新兴」的网页技术标准,目前,除IE8及其以下版本的IE浏览器之外,几乎所有主流浏览器(FireFox.Chrome. ...
- 怎样用JavaScript和HTML5 Canvas绘制图表
原文:https://code.tutsplus.com/zh-...原作:John Negoita翻译:Stypstive 在这篇教程中,我将展示用JavaScript和canvas作为手段,在饼状 ...
- 学习笔记:HTML5 Canvas绘制简单图形
HTML5 Canvas绘制简单图形 1.添加Canvas标签,添加id供js操作. <canvas id="mycanvas" height="700" ...
- 使用 HTML5 Canvas 绘制出惊艳的水滴效果
HTML5 在不久前正式成为推荐标准,标志着全新的 Web 时代已经来临.在众多 HTML5 特性中,Canvas 元素用于在网页上绘制图形,该元素标签强大之处在于可以直接在 HTML 上进行图形操作 ...
随机推荐
- 8.read读取控制台输入
read(选项)(参数)选项:-p:指定读取值时的提示符-t:指定读取时等待的时间(秒),如果没有在指定的时间内输入,就不再等待了参数:变量:指定读取时的变量名
- [ Mongodb ] 问题总汇
1. Mongodb备份 [root@localhost ~]# mongodump -h /users 2. Mongodb恢复 [root@localhost ~]# mongorestore - ...
- centos 查看 arp
yum install tcpdump -y tcpdump arp :: :: :: :: :: :: :: :: :: :: :: :: :: :: :: :: :: :: :: :: :: :: ...
- RESTful 接口实现简明指南
REST 简介 REST 是一个术语的缩写,REpresentational State Transfer,中文直译「表征状态转移」,这是个很拗口的词.我的建议是先不要强行理解,直接看怎么做,等对实施 ...
- hdu5081
题意有点绕,不过读懂了之后并不难 以Si结尾容易想到ac自动机,建好ac自动机并将fail指针反向即可得到一棵树 那么操作1就是将若干个子树的并中的节点全部权值+1 操作2就是将求若干个节点到根的路径 ...
- Manacher【SP7586】NUMOFPAL - Number of Palindromes
Description 求一个串中包含几个回文串. Input 输入一个字符串\(S\) Output 包含的回文串的个数. 看到题解里面有人人写回文自动机. 有必要那么麻烦嘛 emmm 我们直接跑\ ...
- 二维树状数组+差分【p4514】上帝造题的七分钟
Description "第一分钟,X说,要有矩阵,于是便有了一个里面写满了\(0\)的\(n\times m\)矩阵. 第二分钟,L说,要能修改,于是便有了将左上角为\((a,b)\),右 ...
- 洛谷——P1586 四方定理
P1586 四方定理 题目描述 四方定理是众所周知的:任意一个正整数nn,可以分解为不超过四个整数的平方和.例如:25=1^{2}+2^{2}+2^{2}+4^{2}25=12+22+22+42,当然 ...
- hiho一下第134周 1468 : 2-SAT·hihoCoder新春晚会
1468 : 2-SAT·hihoCoder新春晚会 时间限制:10000ms 单点时限:1000ms 内存限制:256MB 描述 hihoCoder新春晚会正在紧张地筹备中.晚会分为上半场和下半场, ...
- 20、Django实战第20天:课程详情页
1.把course-detail.html复制到templates目录下 2.编辑course-detail.html,分析页面,继承base.html 3.编辑courses.views .... ...