python3二元Logistics Regression 回归分析(LogisticRegression)
纲要
boss说增加项目平台分析方法:
T检验(独立样本T检验)、线性回归、二元Logistics回归、因子分析、可靠性分析
根本不懂,一脸懵逼状态,分析部确实有人才,反正我是一脸懵
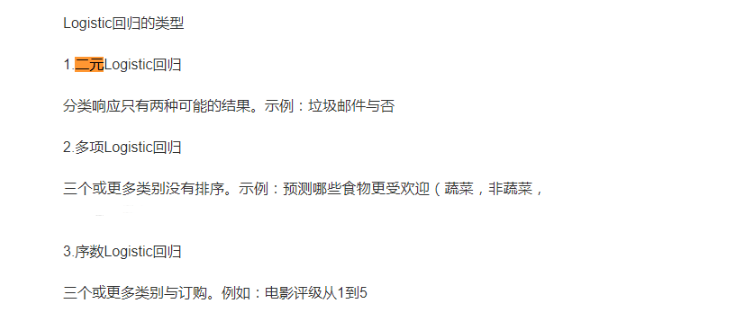
首先解释什么是二元Logistic回归分析吧
官方简介:
链接:https://pythonfordatascience.org/logistic-regression-python/

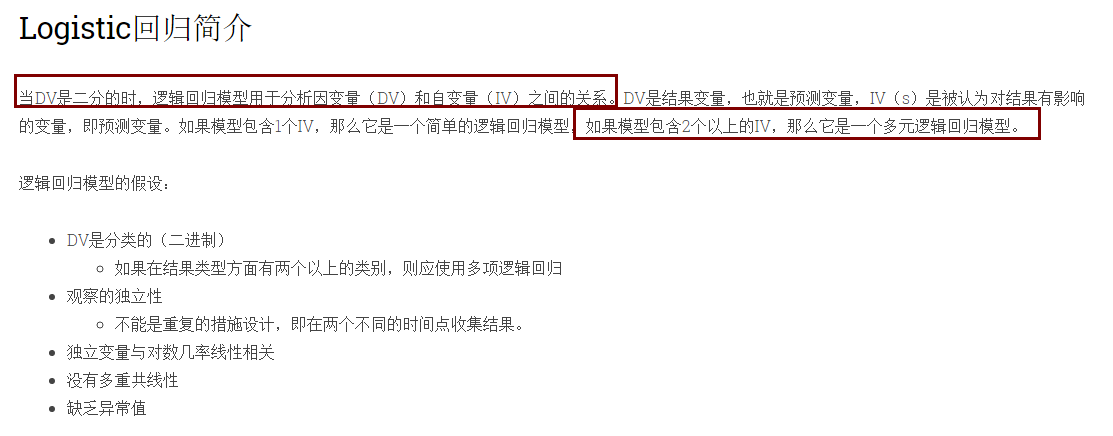
Logistic regression models are used to analyze the relationship between a dependent variable (DV) and independent variable(s) (IV) when the DV is dichotomous. The DV is the outcome variable, a.k.a. the predicted variable, and the IV(s) are the variables that are believed to have an influence on the outcome, a.k.a. predictor variables. If the model contains  IV, then it is a simple logistic regression model, and if the model contains + IVs, then it is a multiple logistic regression model.

Assumptions for logistic regression models:

The DV is categorical (binary)

If there are more than  categories in terms of types of outcome, a multinomial logistic regression should be used

Independence of observations

Cannot be a repeated measures design, i.e. collecting outcomes at two different time points.

Independent variables are linearly related to the log odds

Absence of multicollinearity

Lack of outliers
原文
理解了什么是二元以后,开始找库
需要用的包
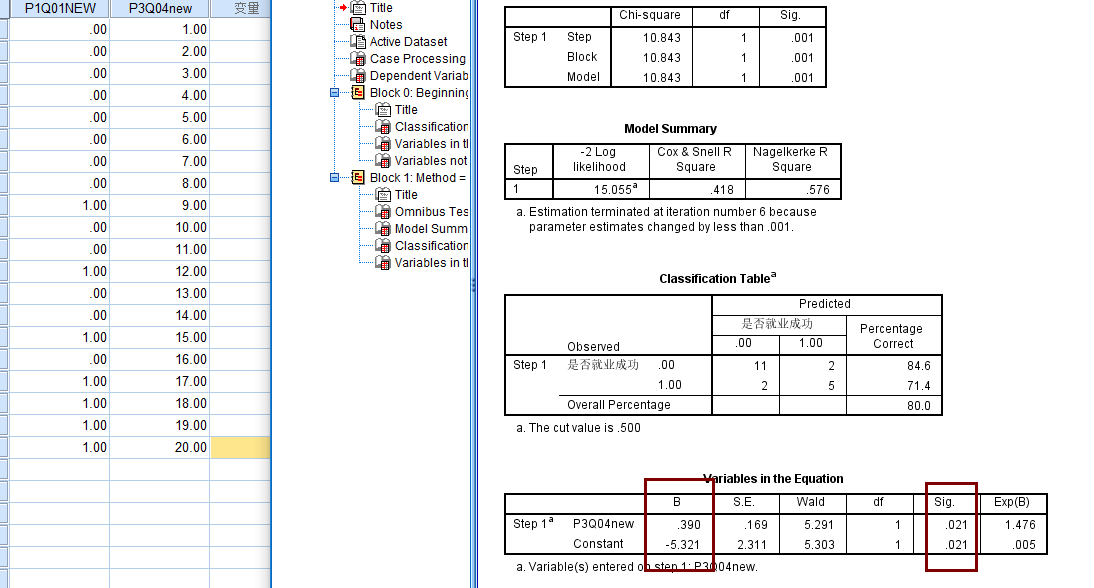
这里需要特别说一下,第一天晚上我就用的logit,但结果不对,然后用机器学习搞,发现结果还不对,用spss比对的值
奇怪,最后没办法,只能抱大腿了,因为他们纠结Logit和Logistic的区别,然后有在群里问了下,有大佬给解惑了
而且也有下面文章给解惑
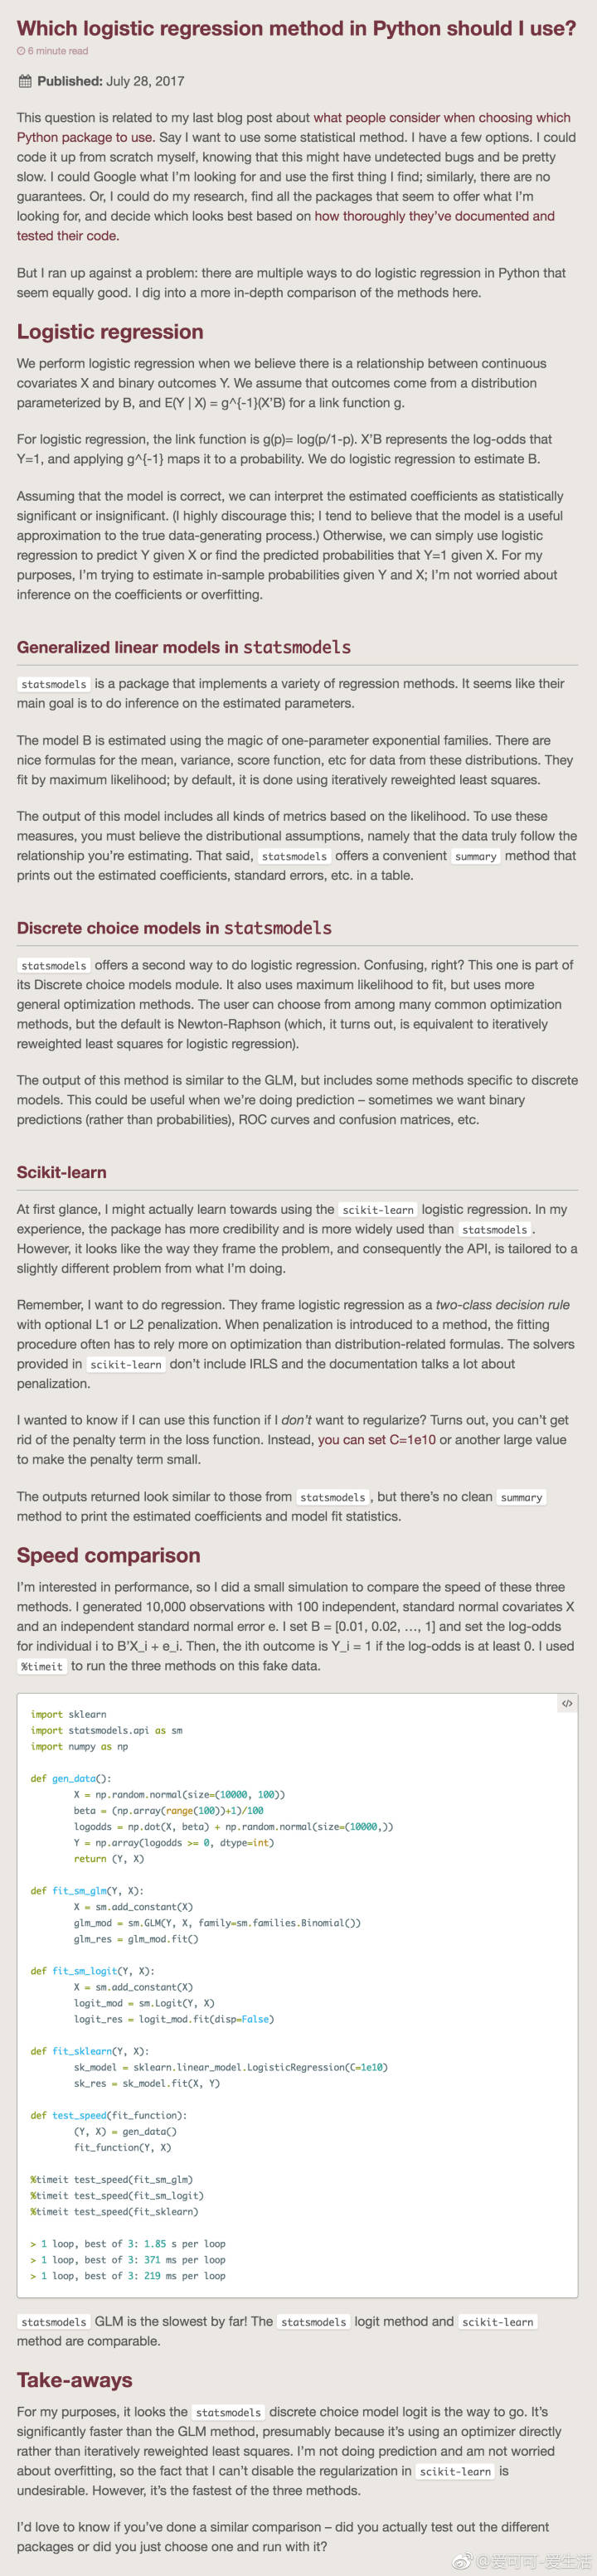
1. 是 statsmodels 的logit模块
2. 是 sklearn.linear_model 的 LogisticRegression模块
先说第一种方法
首先借鉴文章链接:https://blog.csdn.net/zj360202/article/details/78688070?utm_source=blogxgwz0
解释的比较清楚,但是一定要注意一点就是,截距项,我就是在这个地方出的问题,因为我觉得不重要,就没加
#!/usr/bin/env

# -*- coding:utf-8 -*-

import pandas as pd

import statsmodels.api as sm

import pylab as pl

import numpy as np

from pandas import DataFrame, Series

from sklearn.cross_validation import train_test_split

from sklearn.linear_model import LogisticRegression

from sklearn import metrics

from collections import OrderedDict

data = {

    'y': [0, 0, 0, 0, 0, 0, 0, 0, 1, 0, 0, 1, 0, 0, 1, 0, 1, 1, 1, 1],

    'x': [i for i in range(1, 21)],

}

df = DataFrame(OrderedDict(data))

df["intercept"] = 1.0  # 截距项,很重要的呦,我就错在这里了

print(df)

print("==================")

print(len(df))

print(df.columns.values)

print(df[df.columns[1:]])

logit = sm.Logit(df['y'],  df[df.columns[1:]])

#

result = logit.fit()

#

res = result.summary2()

print(res)
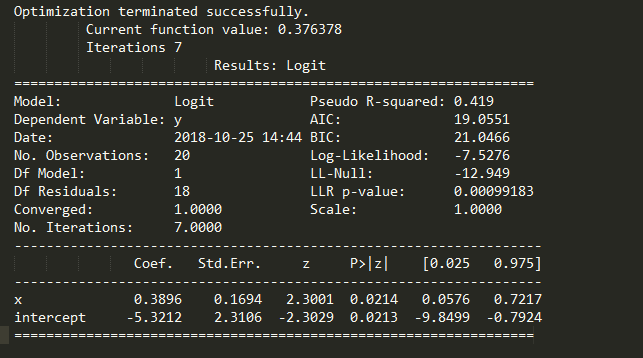
这么写我觉得更好,因为上面那么写执行第二遍的时候总是报错:
statsmodels.tools.sm_exceptions.PerfectSeparationError: Perfect separation detected, results not available
我改成x, y变量自己是自己的,就莫名其妙的好了
    obj = TwoDimensionalLogisticRegressionModel()

    data_x = obj.SelectVariableSql( UserID, ProjID, QuesID, xVariable, DatabaseName, TableName, CasesCondition)

    data_y = obj.SelectVariableSql( UserID, ProjID, QuesID, yVariable, DatabaseName, TableName, CasesCondition)

    if len(data_x) != len(data_y):

        raise MyCustomError(retcode=4011)

    obj.close()

    df_X = DataFrame(OrderedDict(data_x))

    df_Y = DataFrame(OrderedDict(data_y))

    df_X["intercept"] = 1.0  # 截距项,很重要的呦,我就错在这里了

    logit = sm.Logit(df_Y, df_X)

    result = logit.fit()

    res = result.summary()

    data = [j for j in [i for i in str(res).split('\n')][-3].split(' ') if j != ''][1:]

    return data
允许二分数值虚拟变量的使用,修改后
obj = TwoDimensionalLogisticRegressionModel()

data_x = obj.SelectVariableSql( UserID, ProjID, QuesID, xVariable, DatabaseName, TableName, CasesCondition)

data_y = obj.SelectVariableSql( UserID, ProjID, QuesID, yVariable, DatabaseName, TableName, CasesCondition)

if len(data_x) != len(data_y):

    raise MyCustomError(retcode=)

obj.close()

df_X = DataFrame(data_x)

df_Y = DataFrame(data_y) # 因变量,,

df_X["intercept"] = 1.0  # 截距项,很重要的呦,我就错在这里了

YColumnList = list(df_Y[yVariable].values)

setYColumnList = list(set(YColumnList))

if len(setYColumnList) >  or len(setYColumnList) < :

    raise MyCustomError(retcode=)

else:

    if len(setYColumnList) ==  and [,] != [int(i) for i in setYColumnList]:

        newYcolumnsList = []

        for i in YColumnList:

            if i == setYColumnList[]:

                newYcolumnsList.append()

            else:

                newYcolumnsList.append()

        df_Y = DataFrame({yVariable:newYcolumnsList})

logit = sm.Logit(df_Y, df_X)

result = logit.fit()

res = result.summary()

data = [j for j in [i for i in str(res).split('\n')][-].split(' ') if j != '']

return data[:]
再次更新后
def TwoDimensionalLogisticRegressionDetail(UserID, ProjID, QuesID, xVariableID, yVariableID, CasesCondition):

    two_obj = TwoDimensionalLogisticModel()

    sql_data, xVarName, yVarName = two_obj.showdatas(UserID, ProjID, QuesID, xVariableID, yVariableID, CasesCondition)

    two_obj.close()

    df_dropna = DataFrame(sql_data).dropna()

    df_X = DataFrame()

    df_Y = DataFrame()  # 因变量,0, 1

    df_X[xVarName] = df_dropna[xVarName]

    df_Y[yVarName] = df_dropna[yVarName]

    df_X["intercept"] = 1.0  # 截距项,很重要的呦,我就错在这里了

    YColumnList = list(df_Y[yVarName].values)

    setYColumnList = list(set(YColumnList))

    # print(setYColumnList)

    if len(setYColumnList) > 2 or len(setYColumnList) < 2:

        raise MyCustomError(retcode=4015)

    # else:

    if len(setYColumnList) == 2 and [0, 1] != [int(i) for i in setYColumnList]:

        newYcolumnsList = []

        for i in YColumnList:

            if i == setYColumnList[0]:

                newYcolumnsList.append(0)

            else:

                newYcolumnsList.append(1)

        df_Y = DataFrame({yVarName: newYcolumnsList})

    logit = sm.Logit(df_Y, df_X)

    res = logit.fit()

    res_all = res.summary()

    LogLikelihood = [i.strip() for i in str(res_all).split("\n")[6].split("   ") if i][3]

    # 没找到具体参数, 只能这么分割

    index_var = [i.strip() for i in str(res_all).split("\n")[12].split("   ") if i]

    intercept = [i.strip() for i in str(res_all).split("\n")[13].split("   ") if i]

    std_err = [index_var[2], intercept[2]]

    z = [index_var[3], intercept[3]]

    P_z = [index_var[4], intercept[4]] # 显著性

    interval_25 = [index_var[5], intercept[5]]

    interval_975 = [index_var[6], intercept[6]]

    Odds_Ratio = [math.e ** i for i in list(res.params)]

    return {

        "No_Observations": res.nobs,#No. Observations

        "Pseudo_R": res.prsquared,# Pseudo R^2

        "Log_Likelihood": LogLikelihood, # LogLikelihood

        "LLNull": res.llnull,

        "llr_pvalue": res.llr_pvalue, #llr显著性

        "coef": list(res.params), # 系数

        "std_err": std_err,

        "Odds_Ratio": Odds_Ratio,

        "z": z,

        "P": P_z, #显著性

        "interval_25": interval_25, # 区间0.025

        "interval_975": interval_975

    }
第二种方法,机器学习
参考链接:https://zhuanlan.zhihu.com/p/34217858
#!/usr/bin/env python
# -*- coding:utf-8 -*- from collections import OrderedDict
import pandas as pd examDict = {
'学习时间': [i for i in range(1, 20)],
'通过考试': [0, 0, 0, 0, 0, 0, 0, 0, 1, 0, 0, 1, 0, 0, 1, 0, 1, 1, 1]
} examOrderDict = OrderedDict(examDict)
examDF = pd.DataFrame(examOrderDict)
# print(examDF.head()) exam_X = examDF.loc[:, "学习时间"]
exam_Y = examDF.loc[:, "通过考试"] print(exam_X)
# print(exam_Y) from sklearn.cross_validation import train_test_split X_train,X_test,y_train, y_test = train_test_split(exam_X,exam_Y, train_size=0.8) # print(X_train.values)
print(len(X_train.values))
X_train = X_train.values.reshape(-1, 1)
print(len(X_train))
print(X_train)
X_test = X_test.values.reshape(-1, 1) from sklearn.linear_model import LogisticRegression module_1 = LogisticRegression()
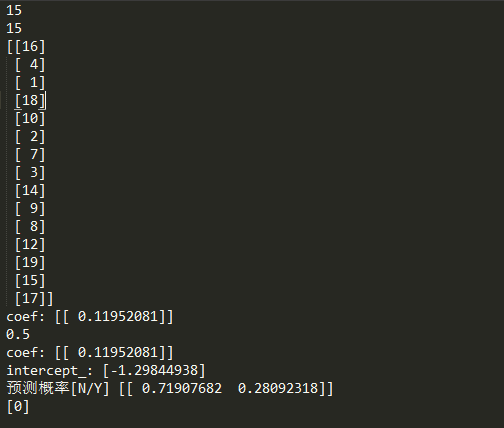
module_1.fit(X_train, y_train) print("coef:", module_1.coef_) front = module_1.score(X_test,y_test)
print(front) print("coef:", module_1.coef_)
print("intercept_:", module_1.intercept_) # 预测
pred1 = module_1.predict_proba(3)
print("预测概率[N/Y]", pred1) pred2 = module_1.predict(5)
print(pred2)
但是,机器学习的这个有问题,就是只抽取了15个值
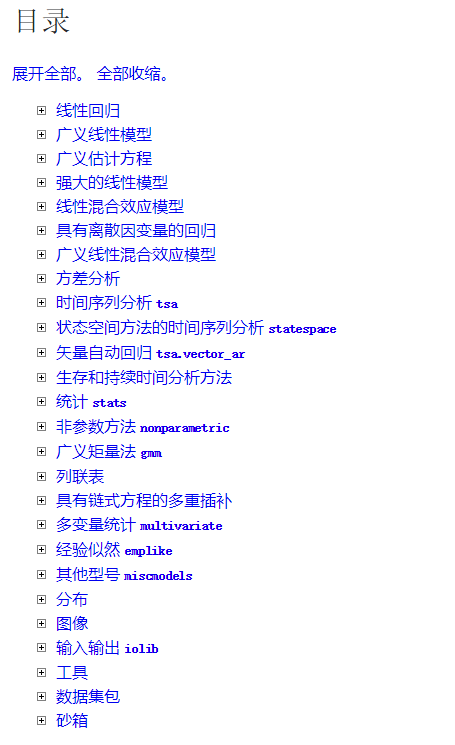
statsmodels的库链接
Statsmodels:http://www.statsmodels.org/stable/index.html
python3二元Logistics Regression 回归分析(LogisticRegression)的更多相关文章
- 1.2、Logistics Regression算法实践
1.1.Logistics Regression算法实践 有了上篇博客的理论准备后,接下来,我们用以及完成的函数,构建Logistics Regression分类器.我们利用线性可分的数据作为训练样 ...
- 1.1、Logistics Regression模型
1.线性可分VS线性不可分 对于一个分类问题,通常可以分为线性可分与线性不可分两种 .如果一个分类问题可以使用线性判别函数正确的分类,则称该问题为线性可分.如图所示为线性可分,否则为线性不可分: 下图 ...
- logistics regression
logistics regression用于解决一些二分类问题.比如(纯假设)网上购物时,网站会判断一个人退货的可能性有多大,如果该用户退货的可能性很大,那么网站就不会推荐改用户购买退费险.反之,如果 ...
- Popular generalized linear models|GLMM| Zero-truncated Models|Zero-Inflated Models|matched case–control studies|多重logistics回归|ordered logistics regression
============================================================== Popular generalized linear models 将不同 ...
- python进行数据分析
1. python进行数据分析----线性回归 2. python进行数据分析------相关分析 3. python进行数据分析---python3卡方 4. 多重响应分析,多选题二分法思路 5. ...
- Logistic Regression Vs Decision Trees Vs SVM: Part I
Classification is one of the major problems that we solve while working on standard business problem ...
- logistics回归简单应用(二)
警告:本文为小白入门学习笔记 网上下载的数据集链接:https://pan.baidu.com/s/1NwSXJOCzgihPFZfw3NfnfA 密码: jmwz 不知道这个数据集干什么用的,根据直 ...
- 2.1、Softmax Regression模型
Softmax Regression模型 由于Logistics Regression算法复杂度低,容易实现等特点,在工业中的到广泛的使用,但是Logistics Regression算法主要用于处理 ...
- 【R语言进行数据挖掘】回归分析
1.线性回归 线性回归就是使用下面的预测函数预测未来观测量: 其中,x1,x2,...,xk都是预测变量(影响预测的因素),y是需要预测的目标变量(被预测变量). 线性回归模型的数据来源于澳大利亚的C ...
随机推荐
- AGC 018E.Sightseeing Plan(组合 DP)
题目链接 \(Description\) 给定三个不相交的矩形\(A(X1,Y1)-(X2,Y2),B(X3,Y3)-(X4,Y4),C(X5,Y5)-(X6,Y6)\),求 从第一个矩形中某点\(a ...
- C语言中常用的字符串操作函数
程序开头要声明 #include <string.h> 函数名: stpcpy 功 能: 拷贝一个字符串到另一个 用 法: char *stpcpy(char *destin, char ...
- 在Editplus直接运行程序的步骤
https://www.cnblogs.com/myitroad/p/4841875.html
- [原创]PostMan接口测试神器
[原创]PostMan接口测试神器 1 PostMan是什么? Postman是一款功能强大的网页调试与发送网页HTTP请求的Chrome插件. 2 Postman工具下载及安装 官方网站: htt ...
- Hessian学习总结(二)——使用hessian上传文件
hessian较早版本通过 byte[] 进行文件传输:4.0之后支持 InputStream 作为参数或返回值进行传输. 注意:hessian会读取整个文件,如果文件过大,会导致JVM内存溢出.可以 ...
- sqlite 一条记录判断一个字段是否like另一个字段
sql: select * from test where col2 like '%'||col1||'%';
- iOS:NSFileHandle和NSFileManger的使用
一.介绍 利用NSFilehandle类提供的方法,允许更有效地使用文件. 一般而言,处理文件时都要经历以下三个步骤: 1.打开文件,并获取一个NSFileHandle对象,以便在后面的I/O操作中引 ...
- 关于Python ,requests的小技巧
版权声明:本文为博主原创文章,未经博主允许不得转载. https://blog.csdn.net/xie_0723/article/details/52790786 关于 Python Request ...
- Win-Sshfs无法连ubuntu1404原因
ubunbtu 默认不允许root远程访问,设置为允许就可以了 1)vi /etc/ssh/sshd_config,将PermitRootLogin的值改成yes,并保存 PermitRootLogi ...
- WinDbg下载符号文件
设置添加系统环境变量_NT_SYMBOL_PATH 的值为:srv*c:\symbols*http://msdl.microsoft.com/download/symbols 这样启动WinDbg的时 ...