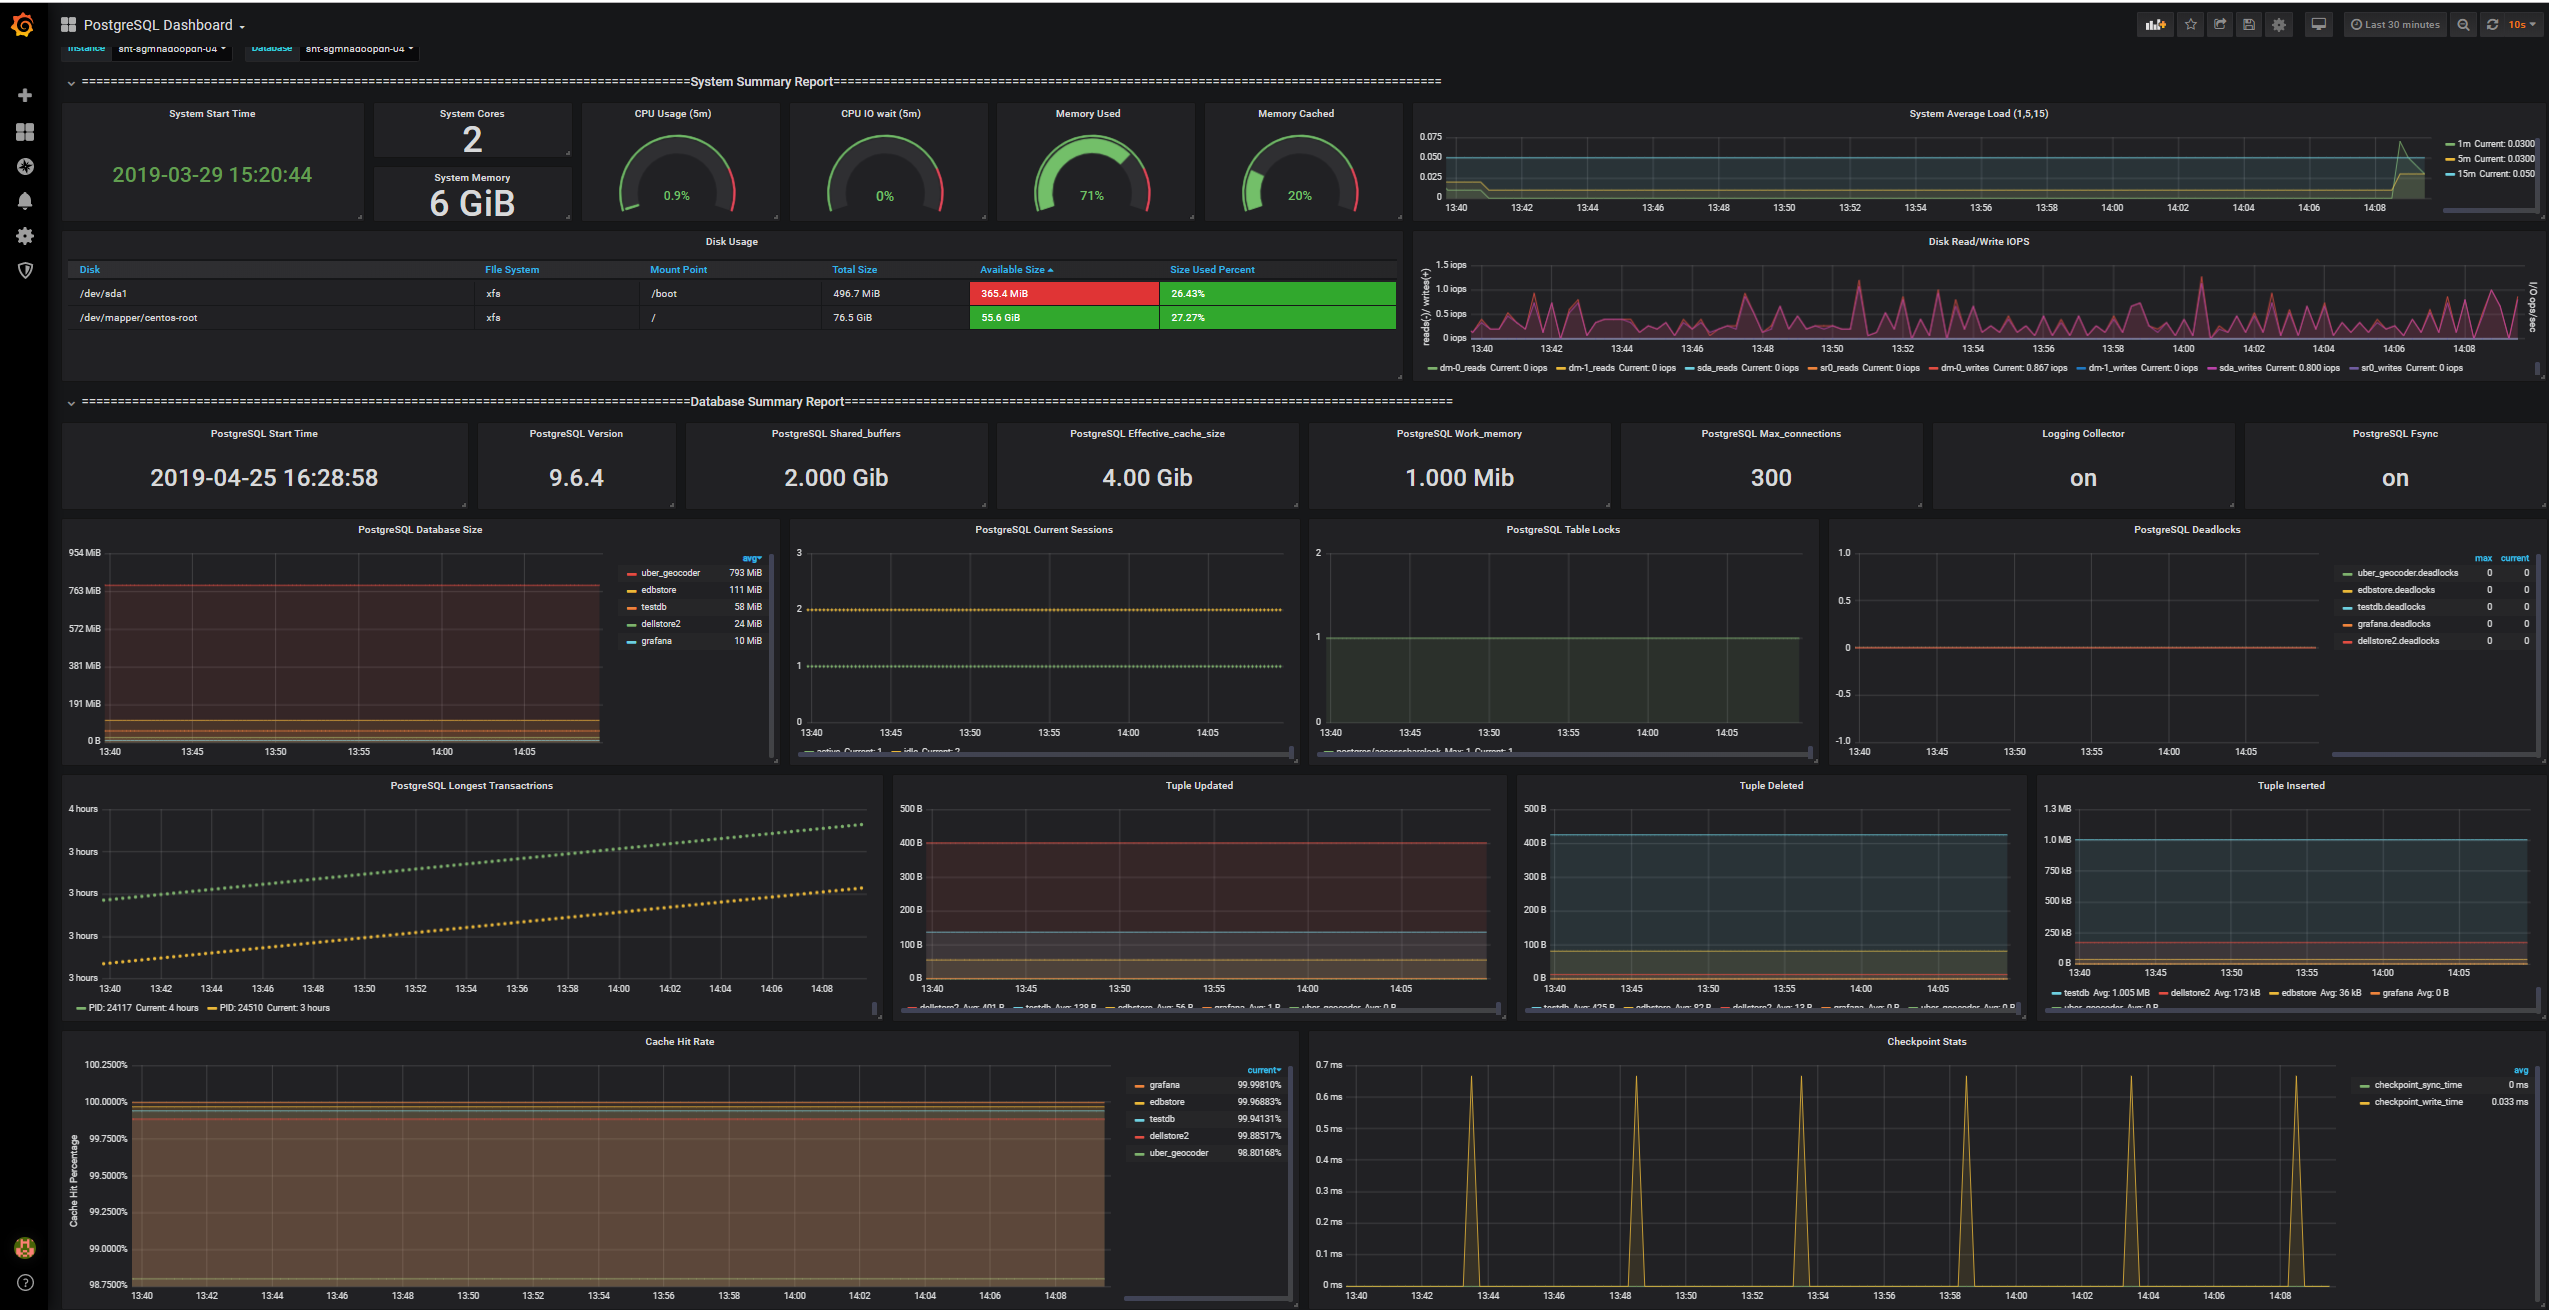
Grafana + Prometheus 监控PostgreSQL
效果图
部署环境
| 服务器名称 | IP地址 | 监控指标 | 部署agent | 备注 |
| sht-sgmhadoopcm-01 | 172.16.101.54 |
OS |
node_exporter | 监控服务器、被监控服务器 |
| sht-sgmhadoopnn-01 | 172.16.101.55 |
OS |
node_exporter | 被监控服务器 |
| sht-sgmhadoopnn-02 | 172.16.101.56 | OS | node_exporter | 被监控服务器 |
| sht-sgmhadoopdn-01 | 172.16.101.58 | OS | node_exporter | 被监控服务器 |
| sht-sgmhadoopdn-02 | 172.16.101.59 | OS | node_exporter | 被监控服务器 |
| sht-sgmhadoopdn-03 | 172.16.101.60 |
OS PostgreSQL |
node_exporter postgres_exporter |
被监控服务器 |
| sht-sgmhadoopdn-04 | 172.16.101.66 |
OS PostgreSQL |
node_exporter postgres_exporter |
被监控服务器 |
安装目录
grafana /usr/local/grafana
prometheus /usr/local/prometheus
node_exporter /usr/local/prometheus/plugin
postgres_exporter /usr/local/prometheus/plugin/postgres_exporter
软件准备
- grafana
https://dl.grafana.com/oss/release/grafana-6.0.1.linux-amd64.tar.gz
- Prometheus
- Prometheus agent
node_exporter
postgres_exporter
https://github.com/wrouesnel/postgres_exporter
https://github.com/wrouesnel/postgres_exporter/releases
一 安装步骤
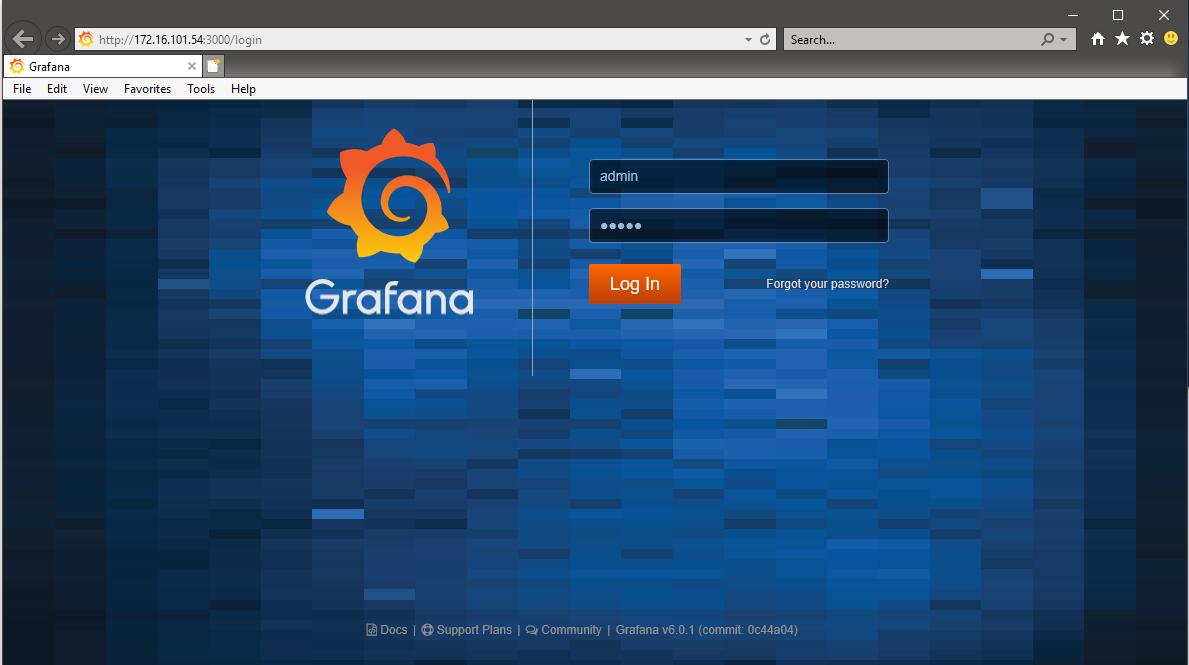
1.监控服务器安装Grafana
# tar -zxf grafana-6.0..linux-amd64.tar.gz

# mv grafana-6.0./* .

# rm -rf grafana-6.0.1*
修改conf/defaults.ini文件部分参数如下
data = /usr/local/grafana/data

logs = /usr/local/grafana/data/log

plugins = /usr/local/grafana/data/plugins

provisioning = /usr/local/grafana/conf/provisioning
启动grafana
# bin/grafana-server &
登录查看
默认账号密码admin/admin
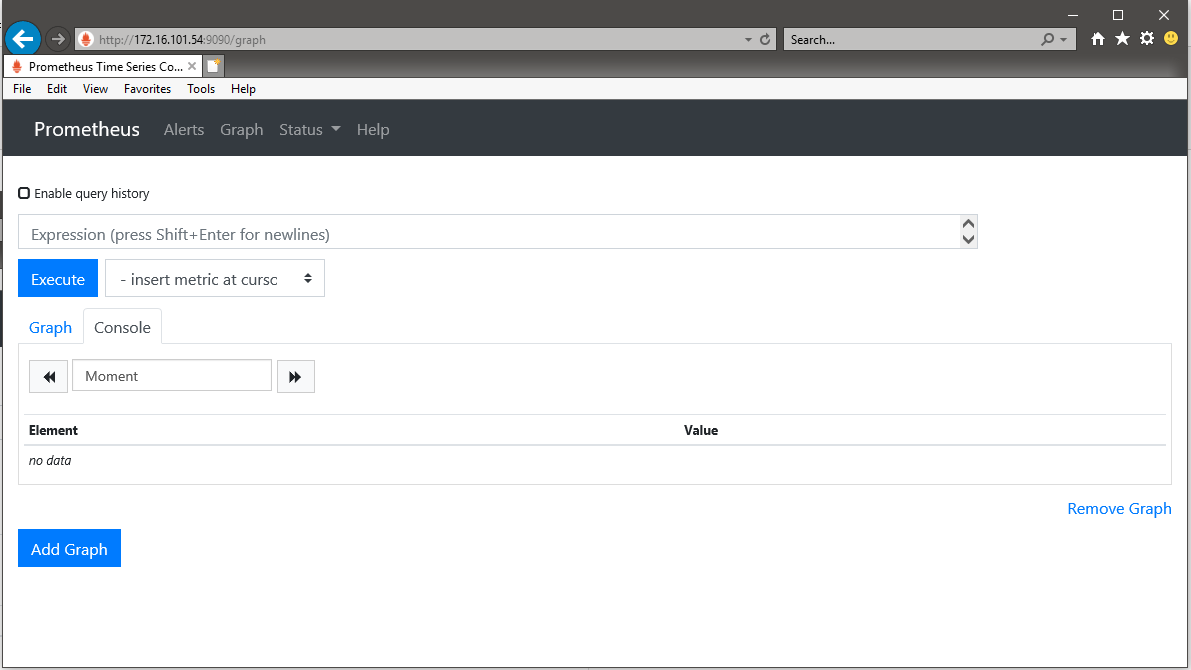
2.监控服务器安装prometheus
--web.enable-lifecycle
作用:后期修改参数文件时不需要重启服务,可以通过api重新读取参数文件。
# tar -zxf prometheus-2.8..linux-amd64.tar.gz

# mv prometheus-2.8..linux-amd64/* .

# rm -rf prometheus-2.8.0.linux-amd64*

# ./prometheus --web.enable-lifecycle --web.enable-admin-api &
登录查看
3. 各节点安装agent
node_exporter
# tar -zxf node_exporter-0.17..linux-amd64.tar.gz

# mv node_exporter-0.17..linux-amd64 node_exporter

# rm -rf node_exporter-0.17..linux-amd64.tar.gz

# node_exporter/node_exporter &
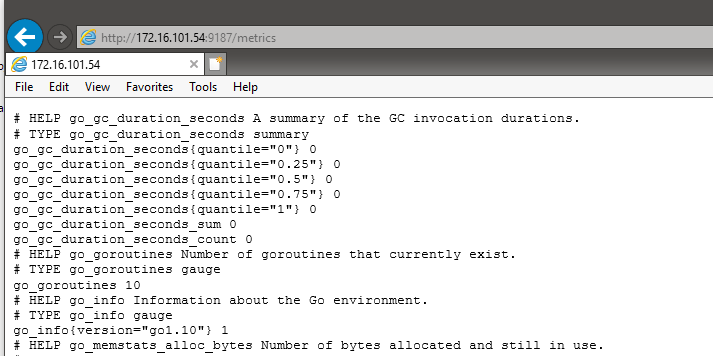
postgres_exporter
该插件还未集成prometheus官网,需要从github下载.,分别下载源码文件,注意postgres_exporter二进制执行文件并不在该源码包里,需要单独下载。
源码 https://github.com/wrouesnel/postgres_exporter
二进制执行文件https://github.com/wrouesnel/postgres_exporter/releases
加入我自己定义的部分sql到custom.yaml文件
# cp queries.yaml custom.yaml
pg_stat_connetion:

  query: "select state,count(*) from pg_stat_activity group by state"

  metrics:

    - state:

        usage: "LABEL"

        description: "type of session state"

    - num:

        usage: "GAUGE"

        description: "type of session state"

pg_stat_long:

   query: "SELECT pid, runtime from (select usename, pid, EXTRACT(EPOCH FROM (now() - query_start))::INT as runtime FROM pg_stat_activity) as ss where runtime > 180 order by runtime desc limit 5"

   metrics:

     - pid:

         usage: "LABEL"

         description: "Pid of the client"

     - runtime:

         usage: "GAUGE"

         description: "current transactrion start time"
启动postgres_exporter
# export DATA_SOURCE_NAME="postgresql://dbadmin:1qax2wse@172.16.101.54:5432/postgres?sslmode=disable"

# export PG_EXPORTER_EXTEND_QUERY_PATH="/usr/local/prometheus/plugin/postgres_exporter/custom.yaml"

# ./postgres_exporter &
查看postgre_exporter
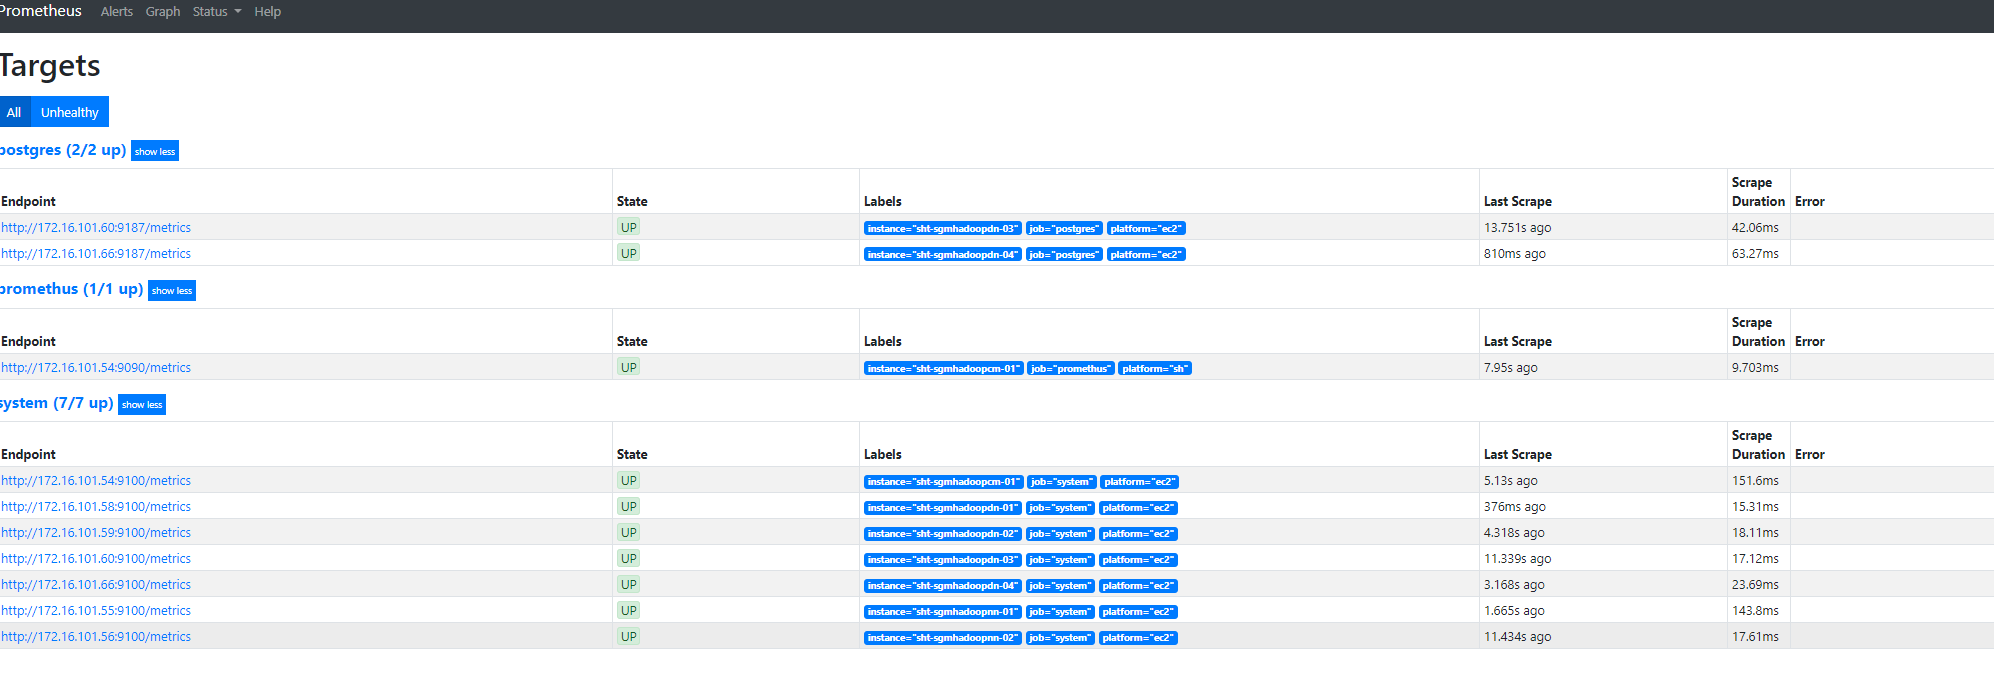
4. prometheus添加agent节点
prometheus.yml
# my global config

global:

  scrape_interval:     15s # Set the scrape interval to every 15 seconds. Default is every 1 minute.

  evaluation_interval: 15s # Evaluate rules every 15 seconds. The default is every 1 minute.

  # scrape_timeout is set to the global default (10s).

# Alertmanager configuration

alerting:

  alertmanagers:

  - static_configs:

    - targets:

      # - alertmanager:9093

# Load rules once and periodically evaluate them according to the global 'evaluation_interval'.

rule_files:

  # - "first_rules.yml"

  # - "second_rules.yml"

# A scrape configuration containing exactly one endpoint to scrape:

# Here it's Prometheus itself.

scrape_configs:

  # The job name is added as a label `job=<job_name>` to any timeseries scraped from this config.

- job_name: 'promethus'

  static_configs:

     - targets: ['172.16.101.54:9090']

       labels:

        instance: 'sht-sgmhadoopcm-01'

        platform: 'sh'

- job_name: 'system'

  static_configs:

     - targets: ['172.16.101.54:9100']

       labels:

        instance: 'sht-sgmhadoopcm-01'

        platform: 'ec2'

     - targets: ['172.16.101.55:9100']

       labels:

        instance: 'sht-sgmhadoopnn-01'

        platform: 'ec2'

     - targets: ['172.16.101.56:9100']

       labels:

        instance: 'sht-sgmhadoopnn-02'

        platform: 'ec2'

     - targets: ['172.16.101.58:9100']

       labels:

        instance: 'sht-sgmhadoopdn-01'

        platform: 'ec2'

     - targets: ['172.16.101.59:9100']

       labels:

        instance: 'sht-sgmhadoopdn-02'

        platform: 'ec2'

     - targets: ['172.16.101.60:9100']

       labels:

        instance: 'sht-sgmhadoopdn-03'

        platform: 'ec2'

     - targets: ['172.16.101.66:9100']

       labels:

        instance: 'sht-sgmhadoopdn-04'

        platform: 'ec2'

- job_name: 'postgres'

  static_configs:

     - targets: ['172.16.101.66:9187']

       labels:

        instance: 'sht-sgmhadoopdn-04'

        platform: 'ec2'

     - targets: ['172.16.101.60:9187']

       labels:

        instance: 'sht-sgmhadoopdn-03'

        platform: 'ec2'
重新载入配置文件
# curl -X POST http://172.16.101.54:9090/-/reload

level=info ts=--16T15::.149076153Z caller=main.go: msg="Loading configuration file" filename=prometheus.yml

level=info ts=--16T15::.152481657Z caller=main.go: msg="Completed loading of configuration file" filename=prometheus.yml
登录prometheus验证
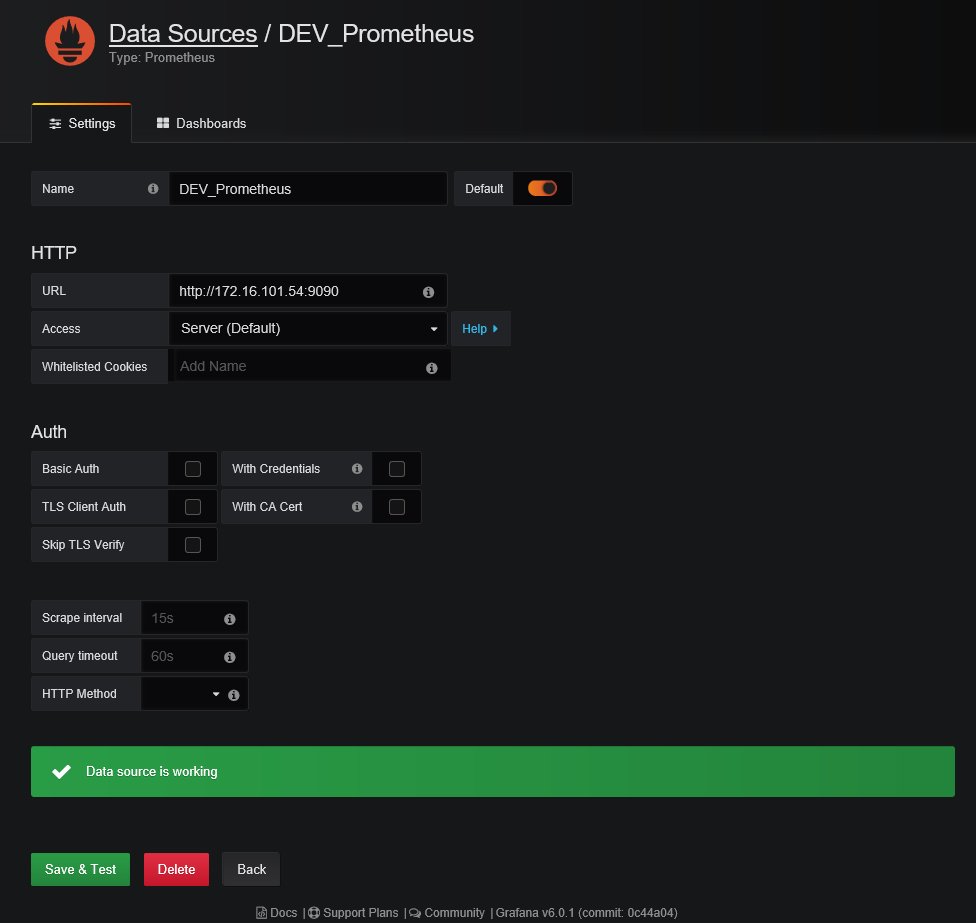
二. 部署grafana
1. 添加prometheus数据源
2.建立dashboard
dashbord名称
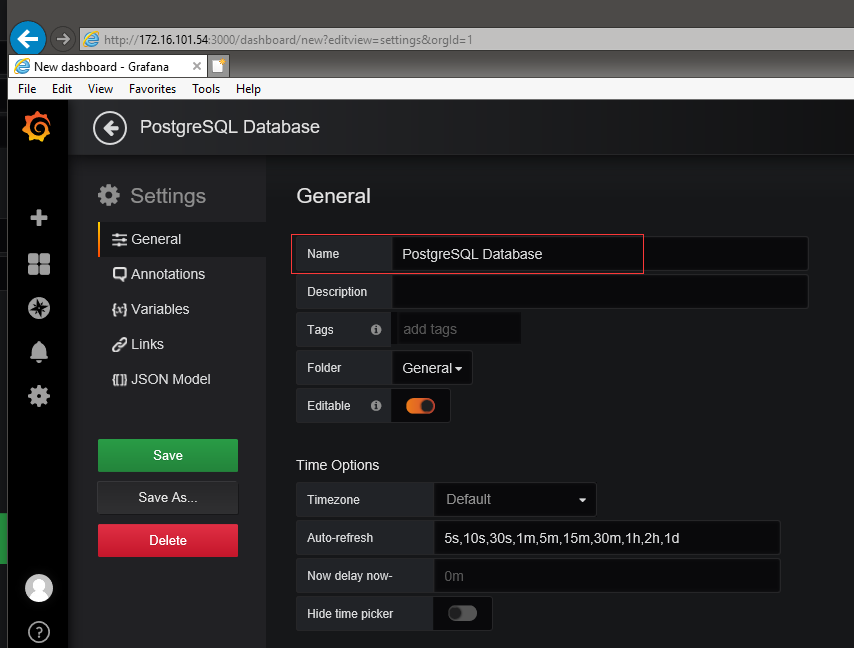
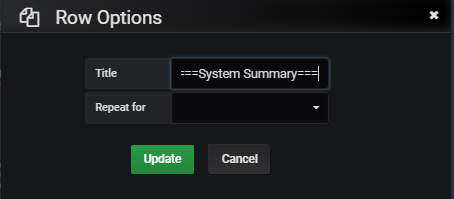
添加变量,把改dashborad作为模板使用
变量instance,获得server的node_exporter
变量database,获得server的postgres_exporter

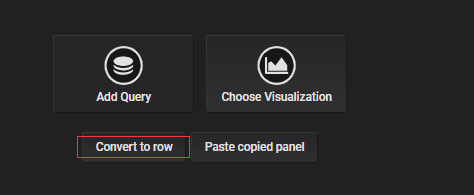
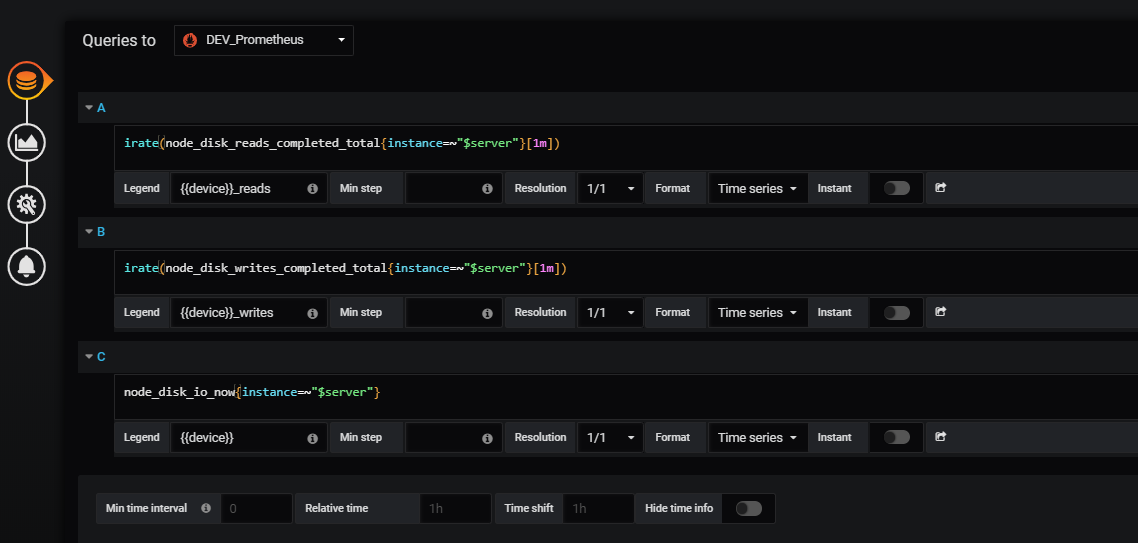
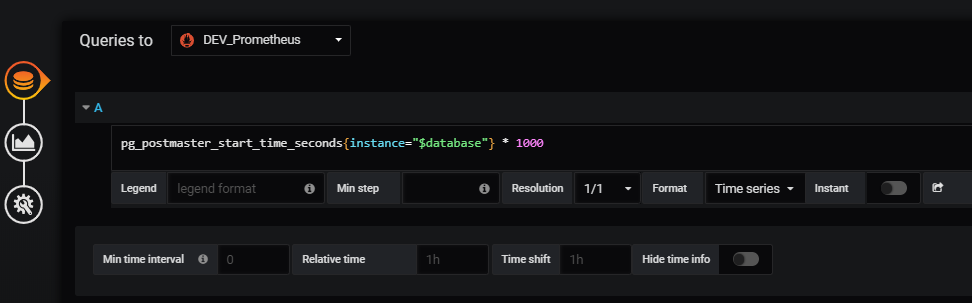
3.添加查询
系统监控
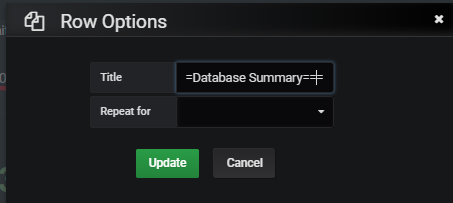
添加row
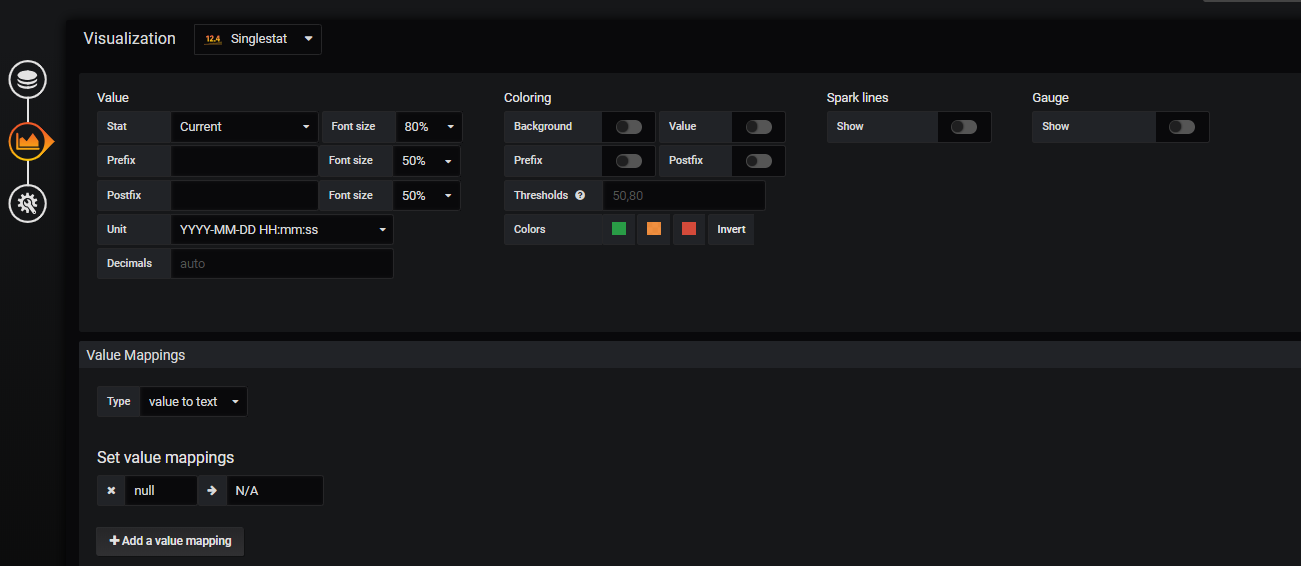
1)system start time

2)CPU Cores


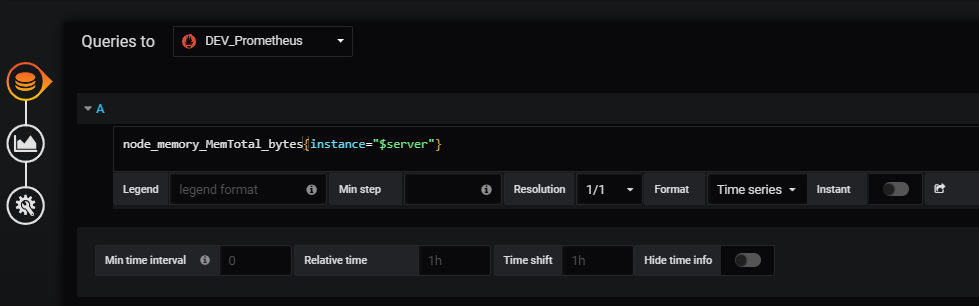
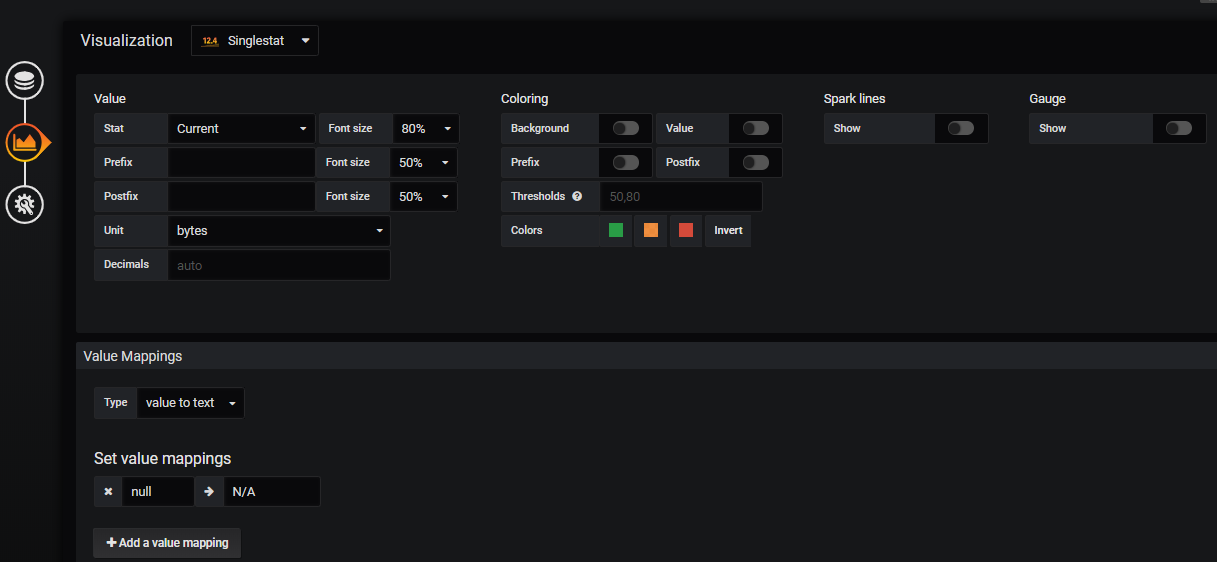
3)Memory Size
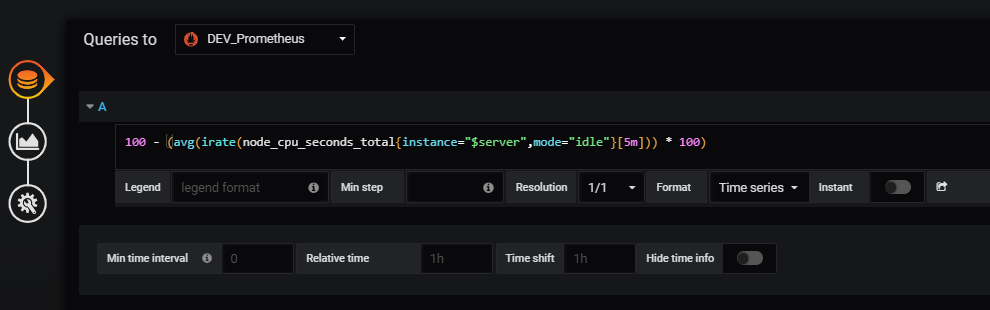
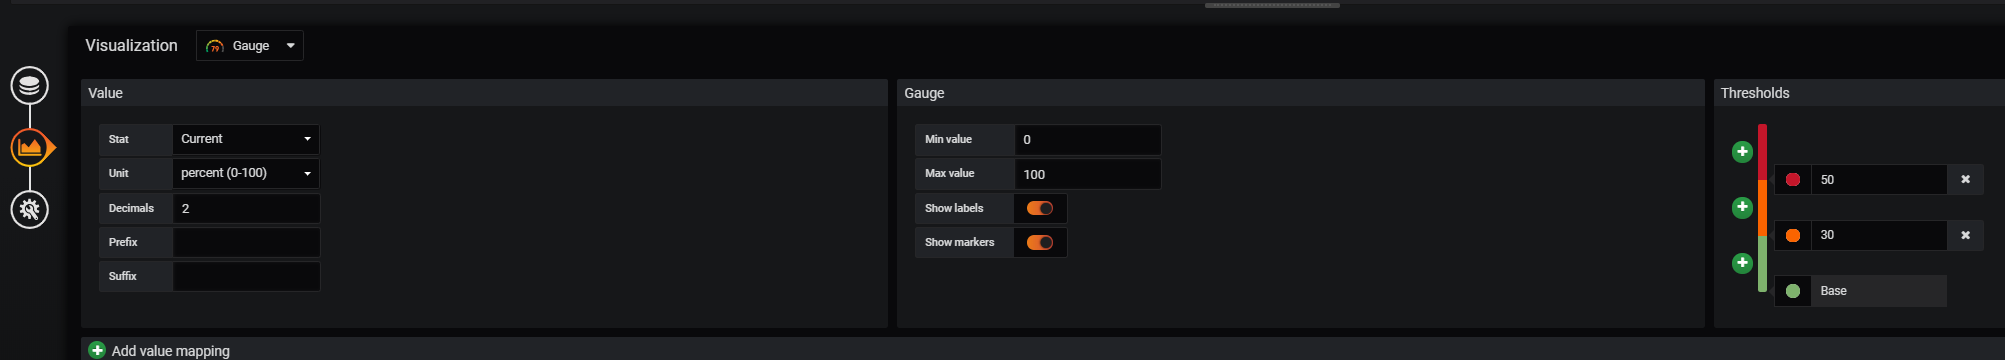
4) CPU Usage (5m)

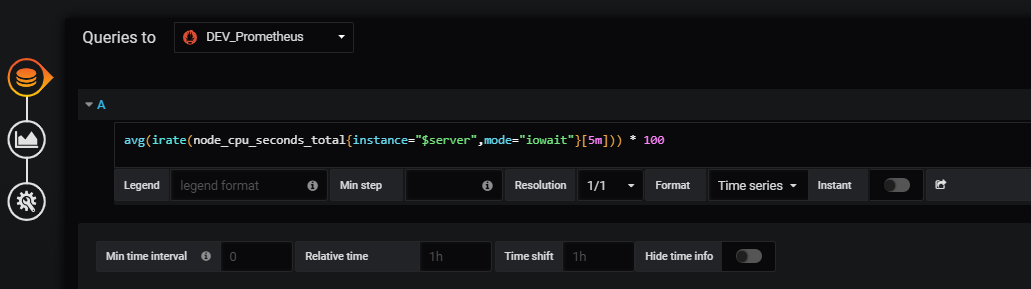
5) CPU IO Wait (5m)
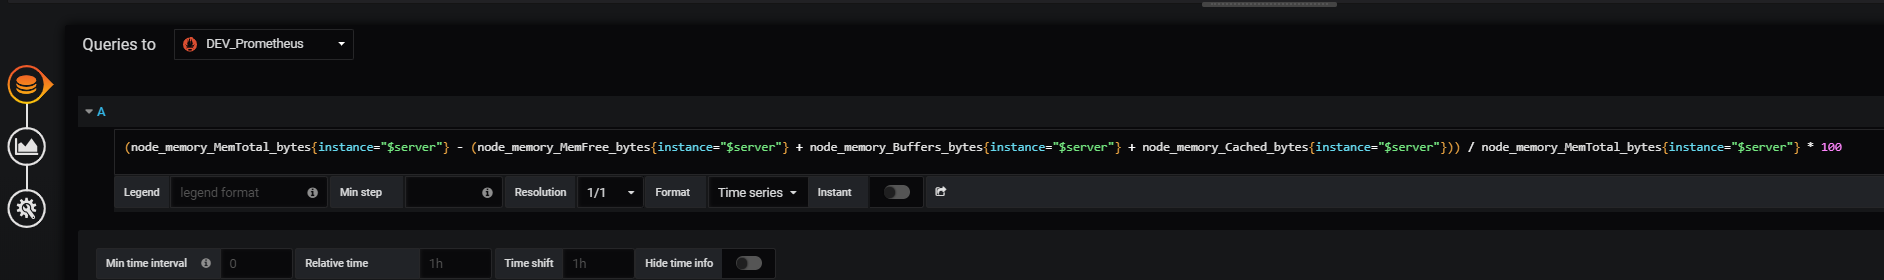
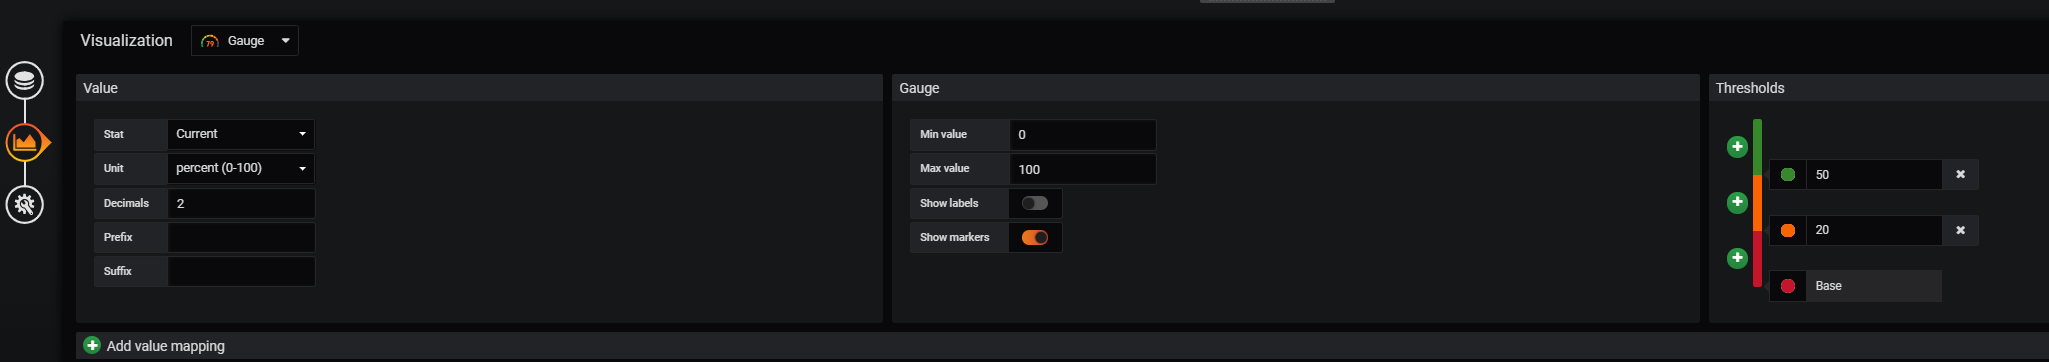
6) Memory Used
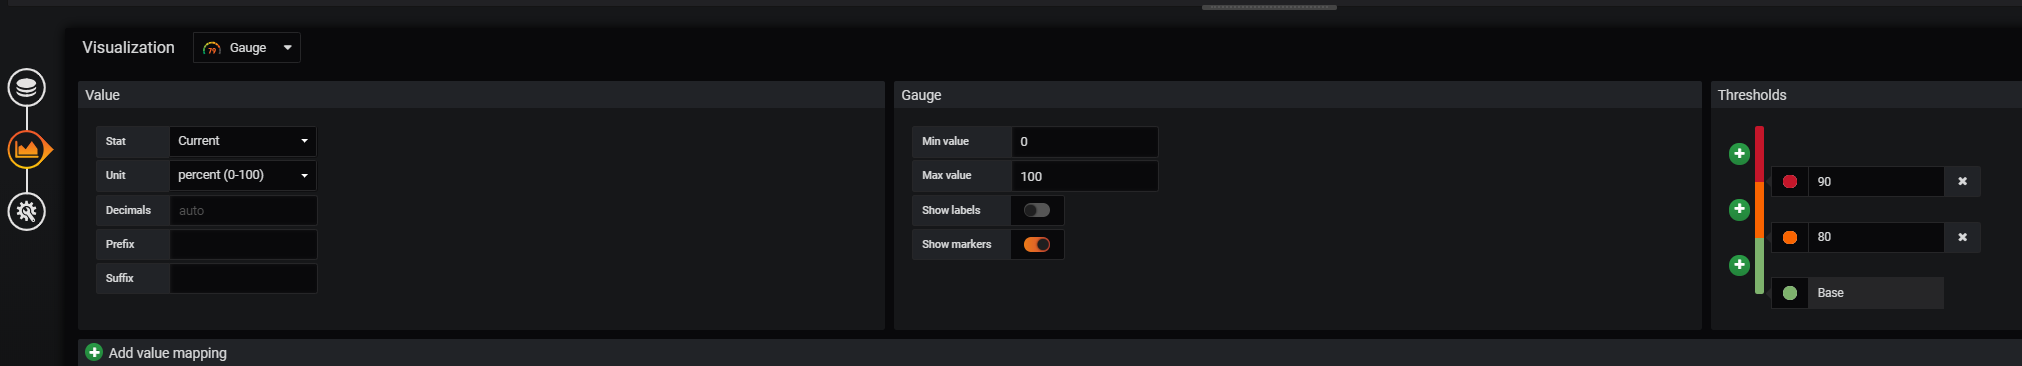
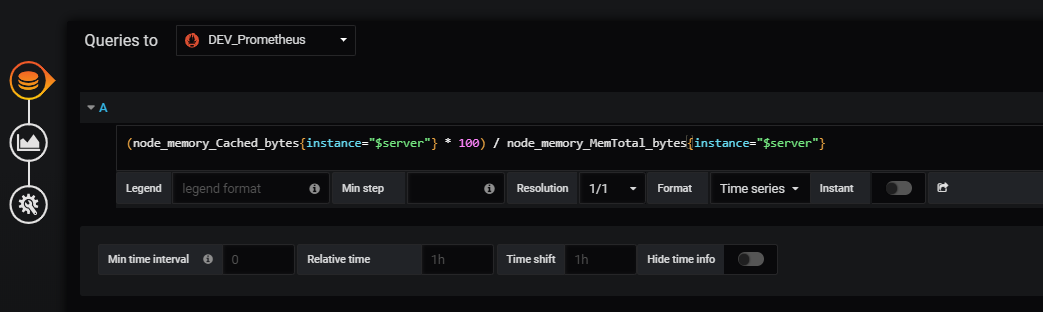
7) Memory Cached
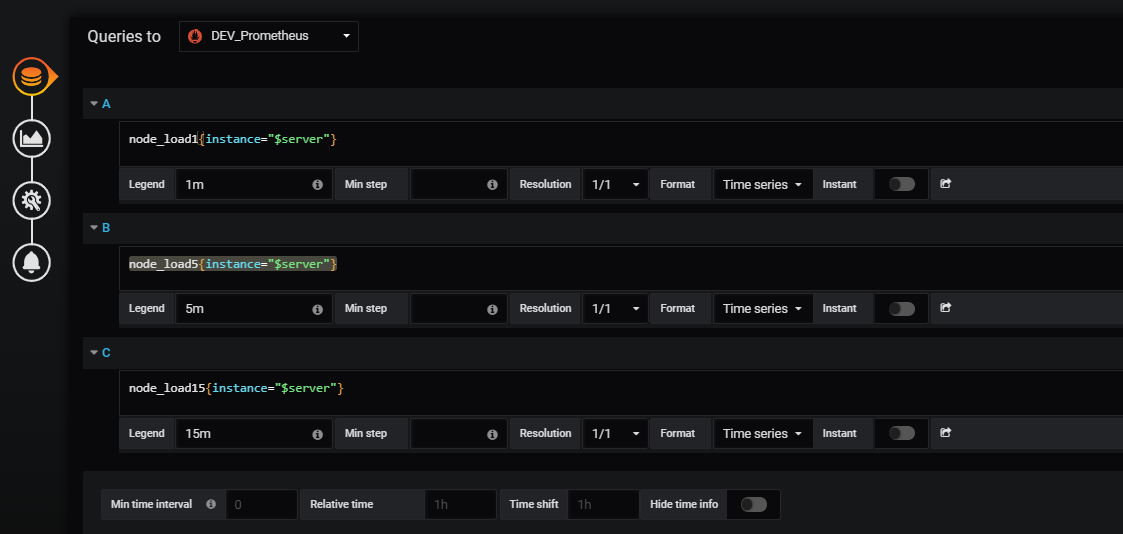
8)System Average Load (1,5,15)
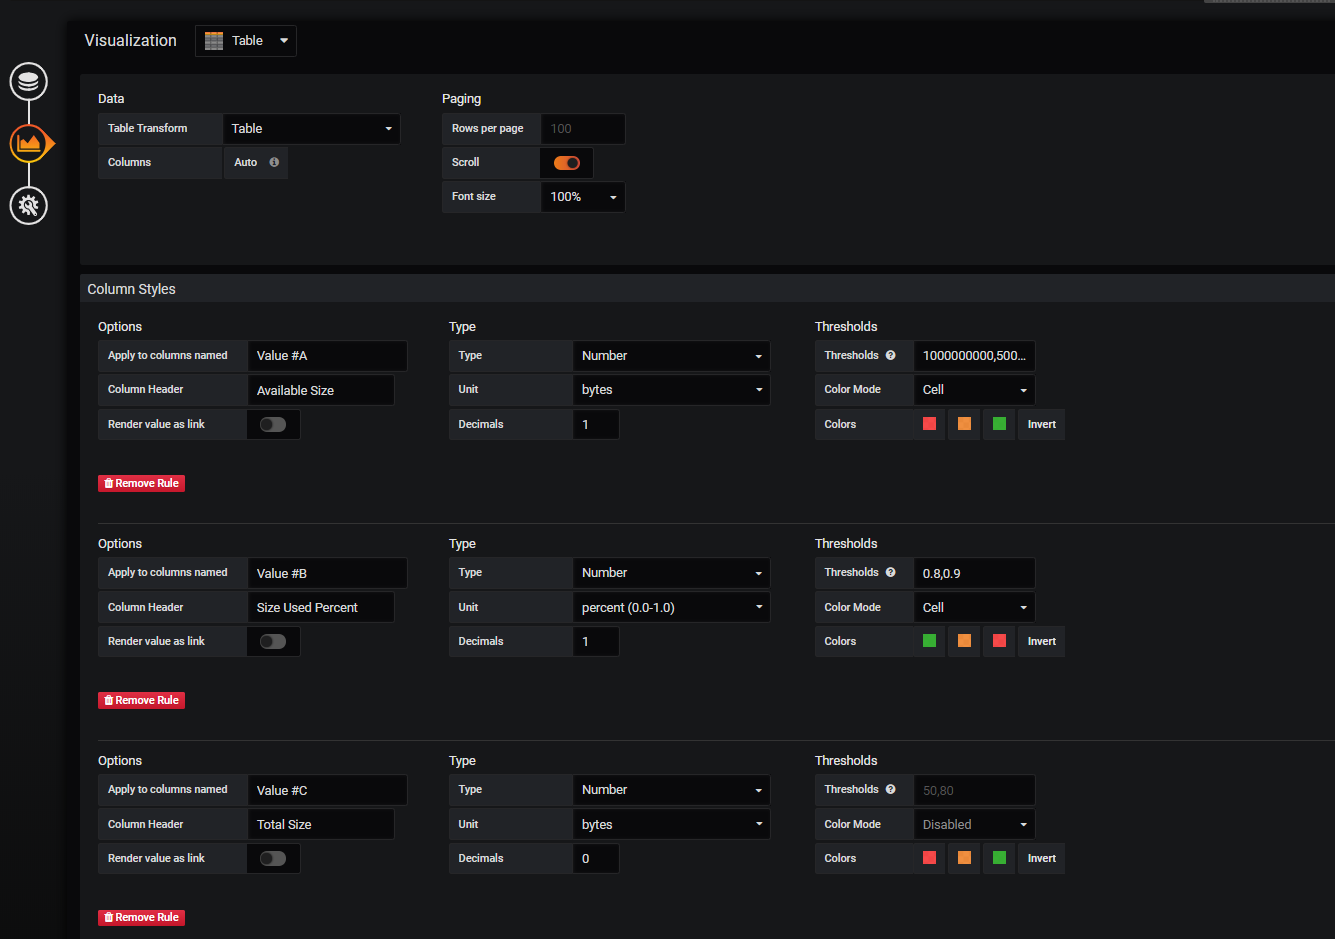
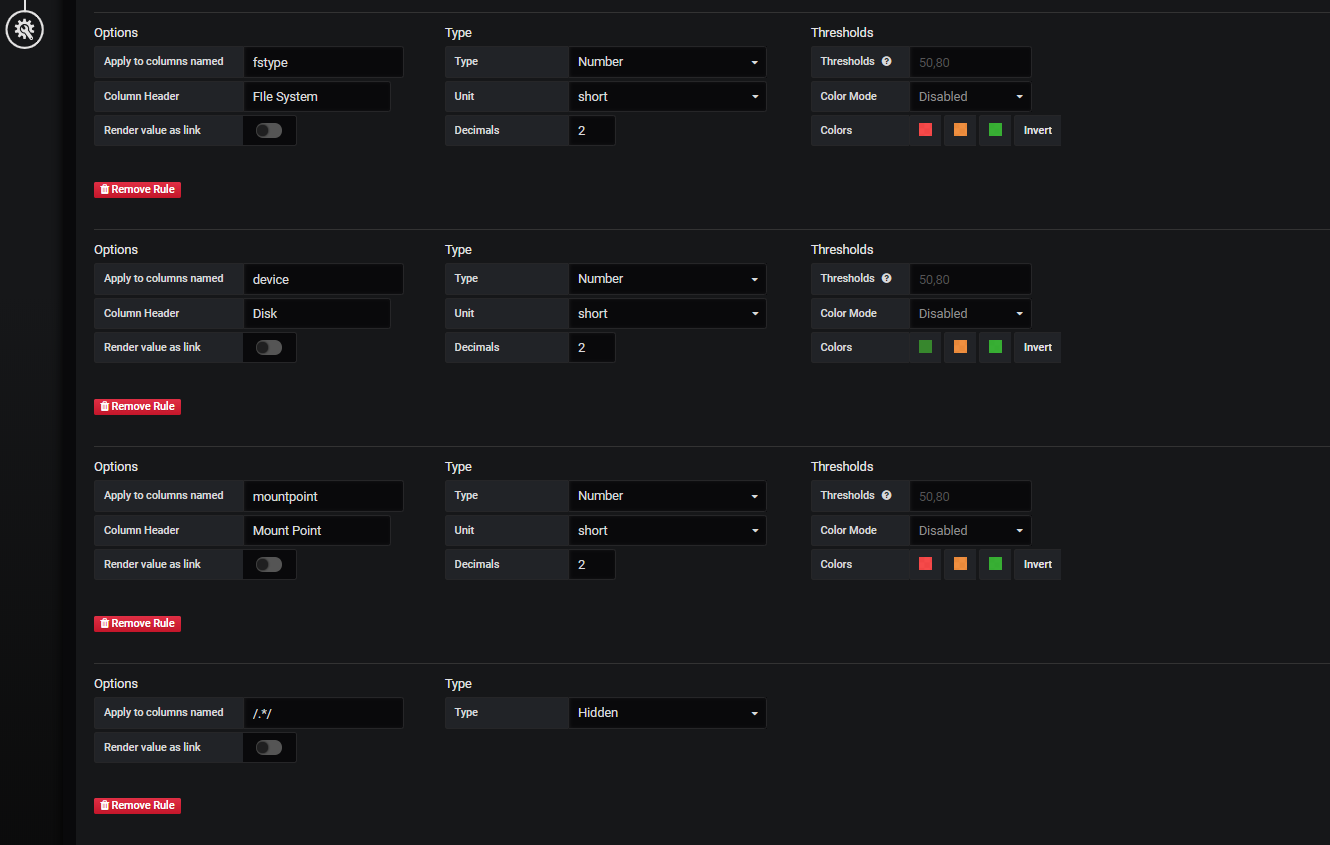
9) DIsk Usage

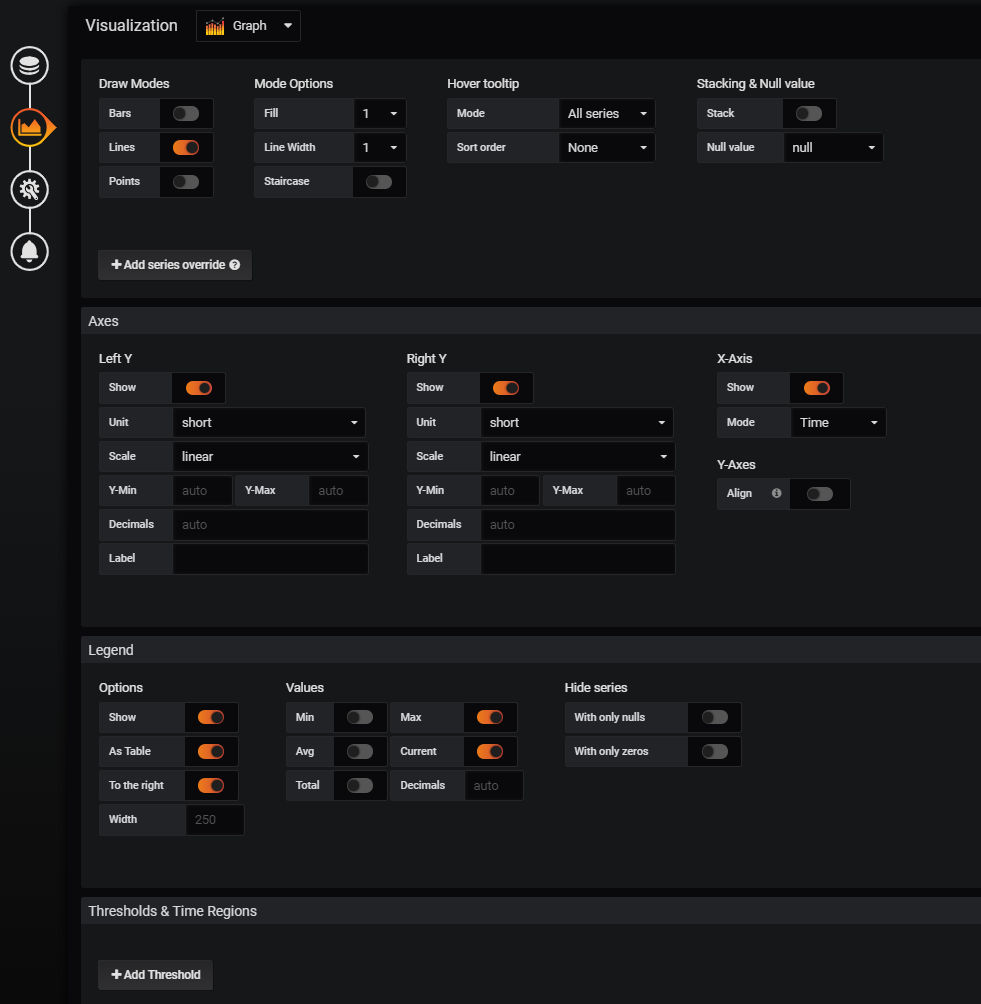
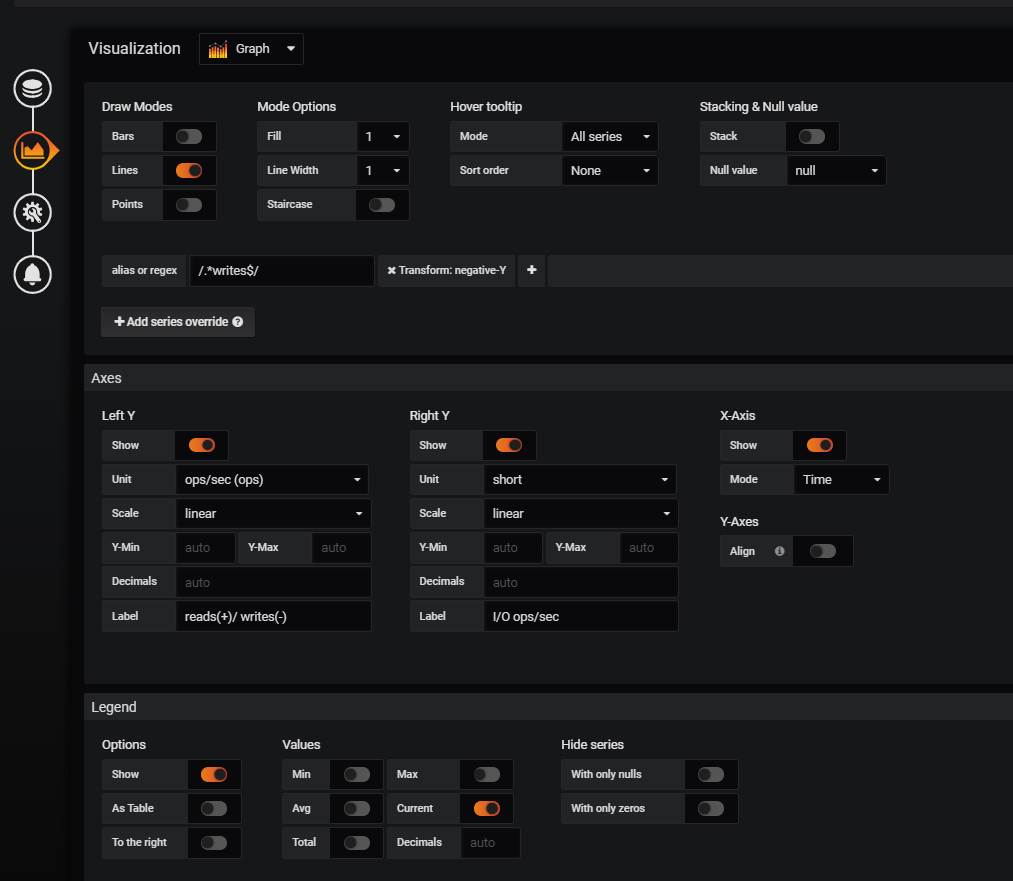
10) Disk Read/Write IOPS (1m)
数据库监控
添加row
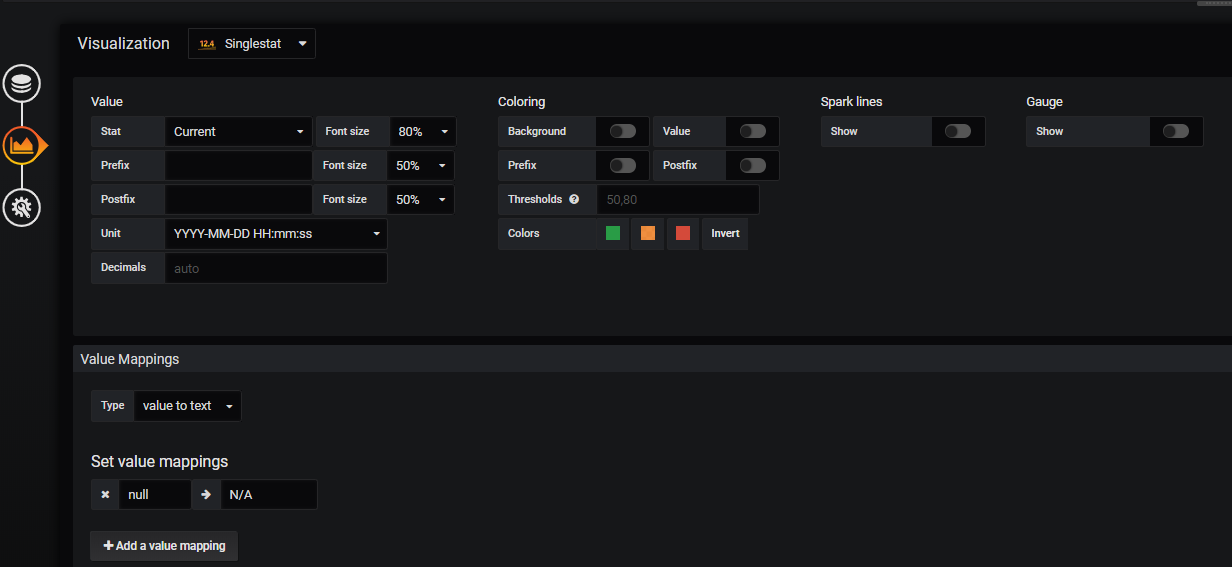
1) PostgreSQL Start Time
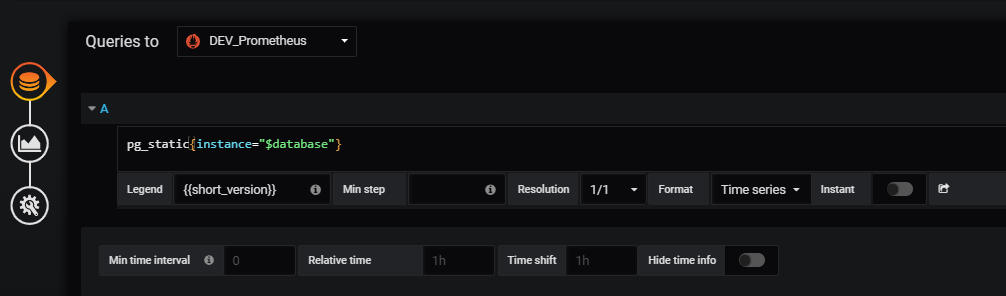
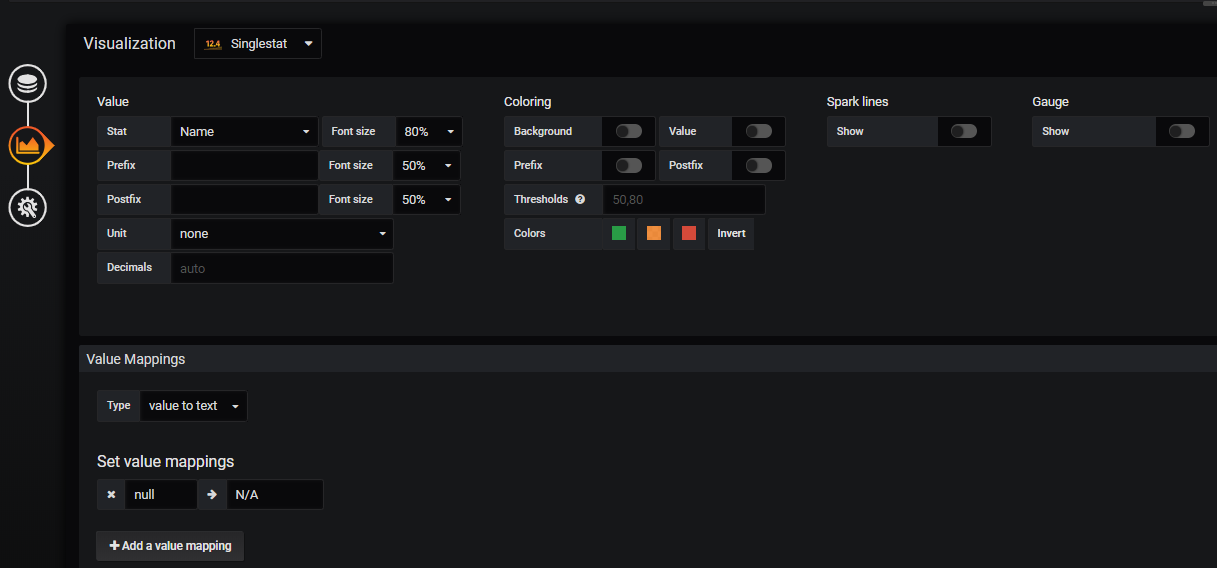
2) PostgreSQL Version
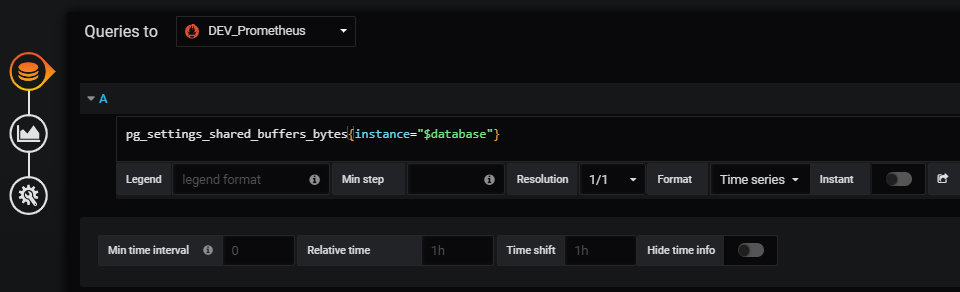
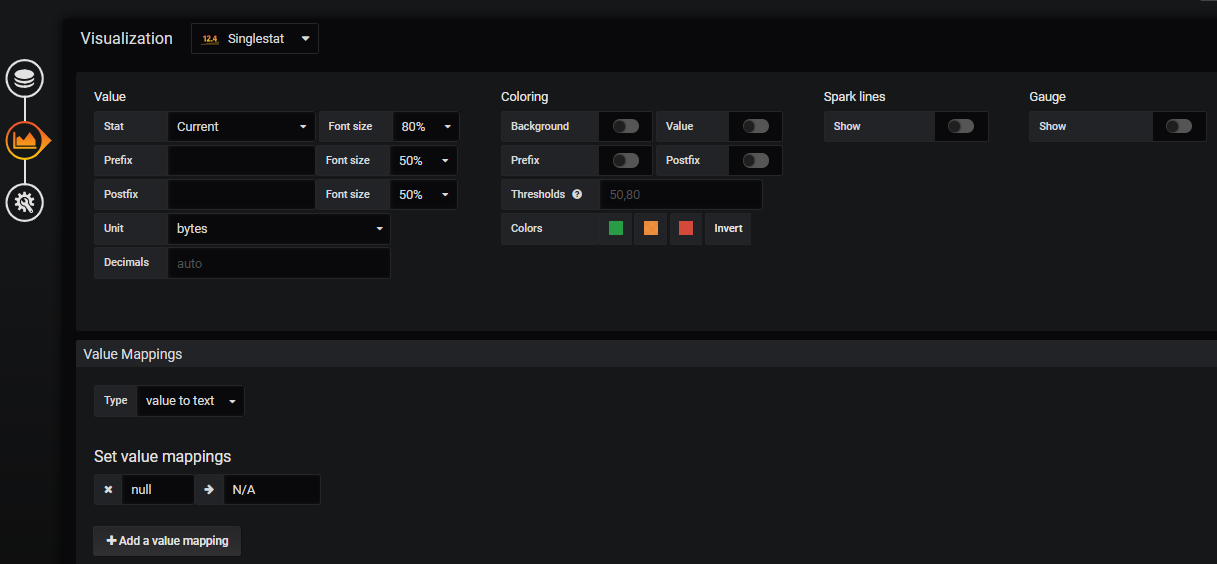
3) PostgreSQL Shared_buffers
4) PostgreSQL Effective_cache_size

5) PostgreSQL Work Memory


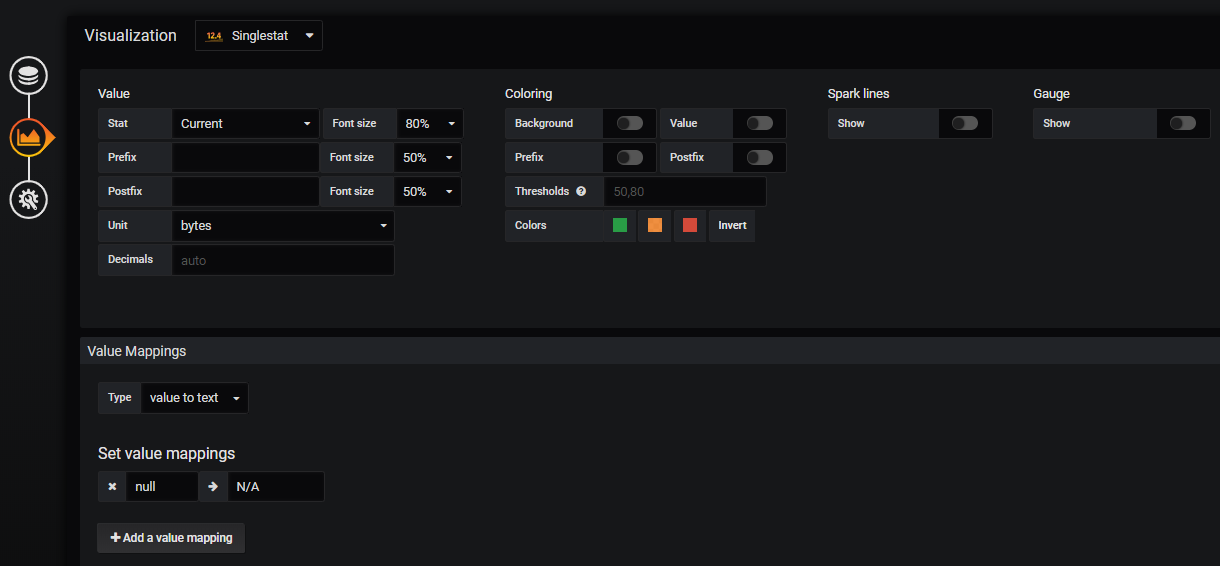
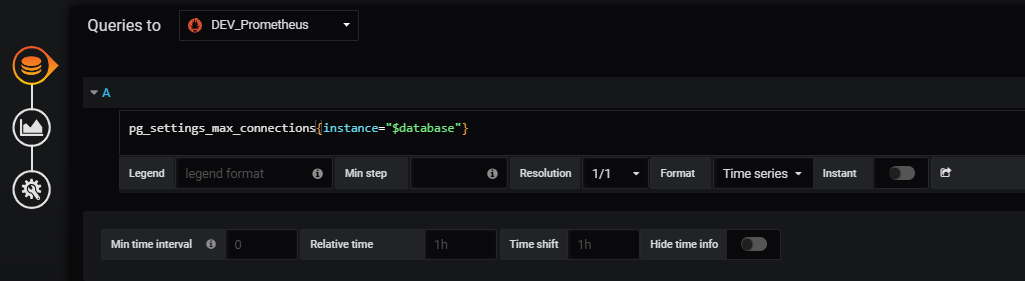
6) PostgreSQL Max Connections
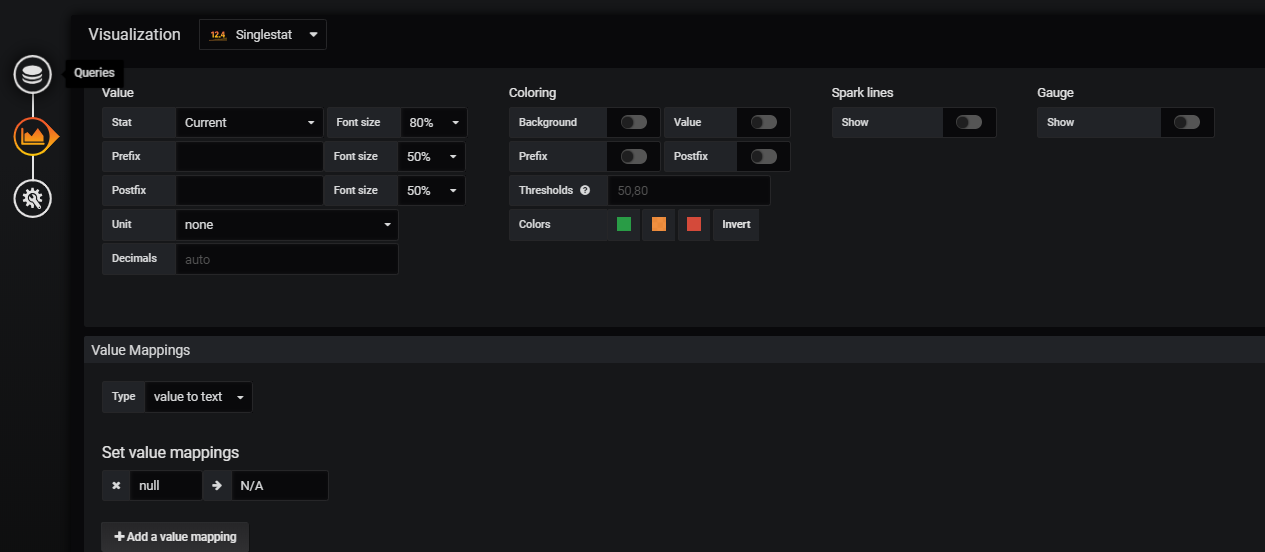
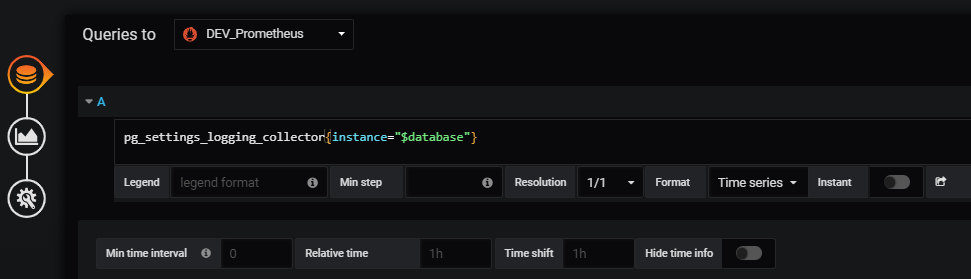
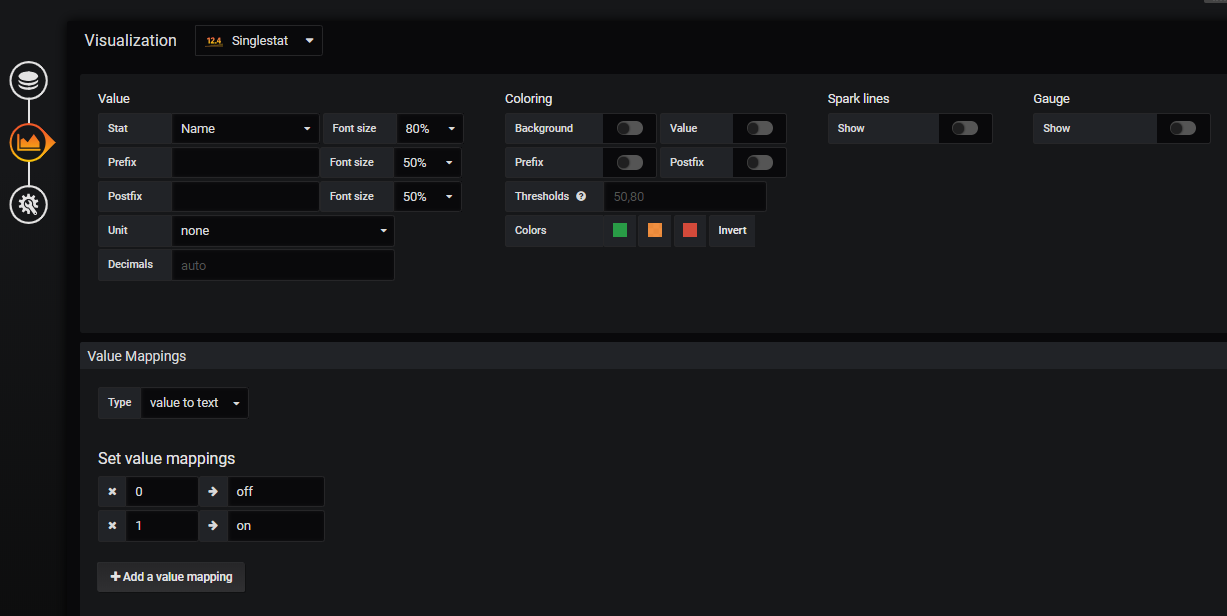
7) Logging Collector
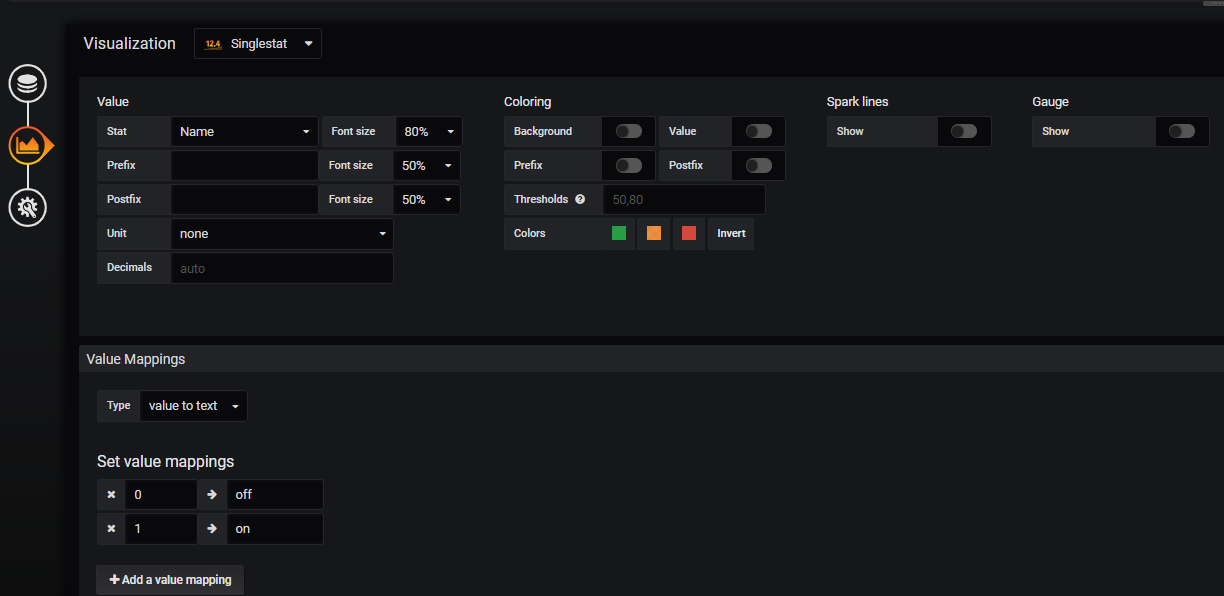
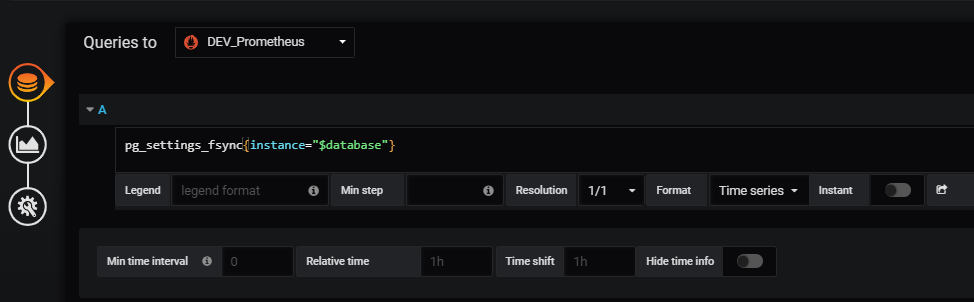
8) PostgreSQL Fsync
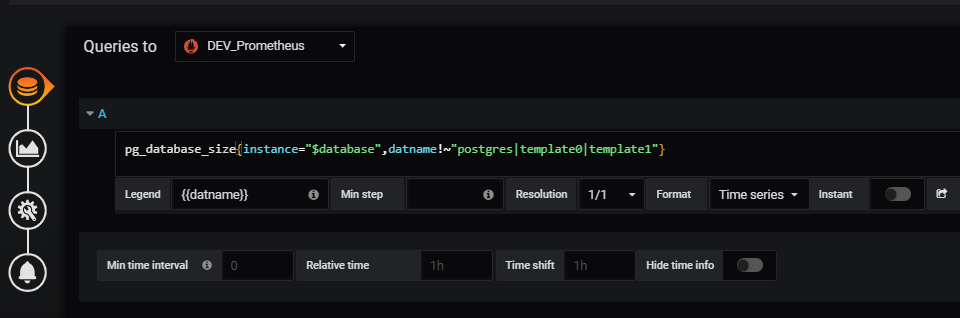
9) PostgreSQL Database Size
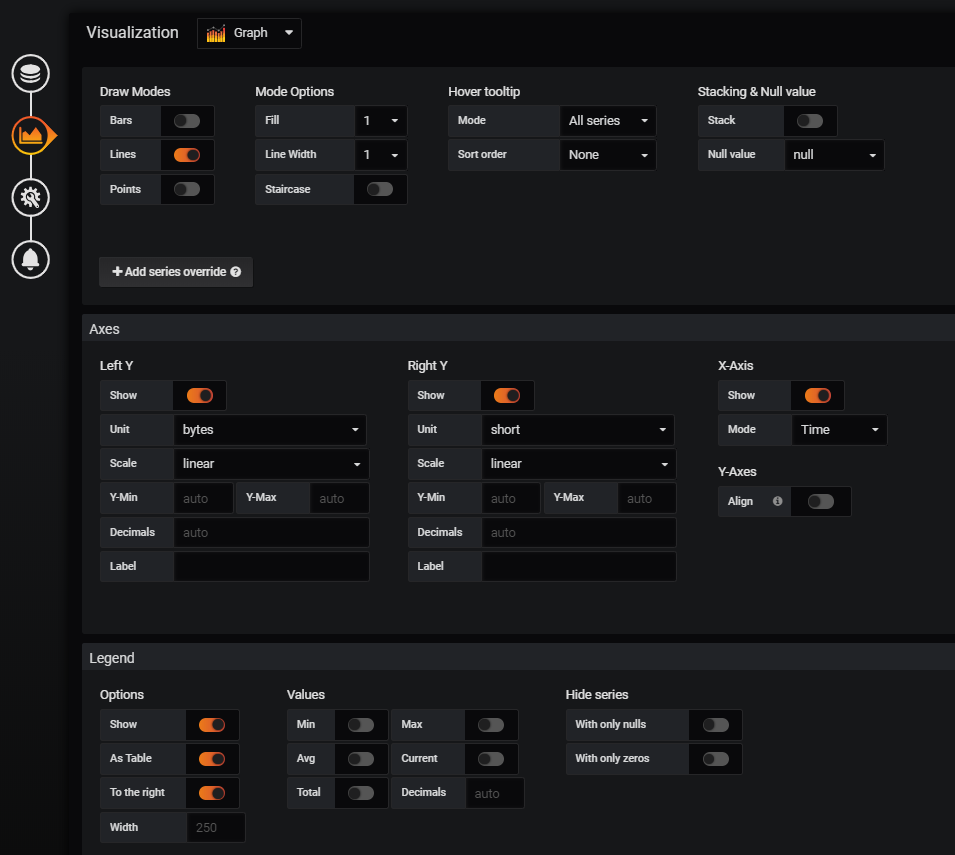
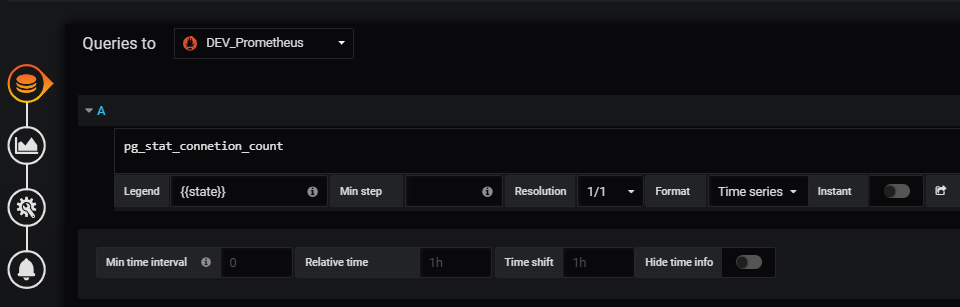
10) PostgreSQL Current Sessions
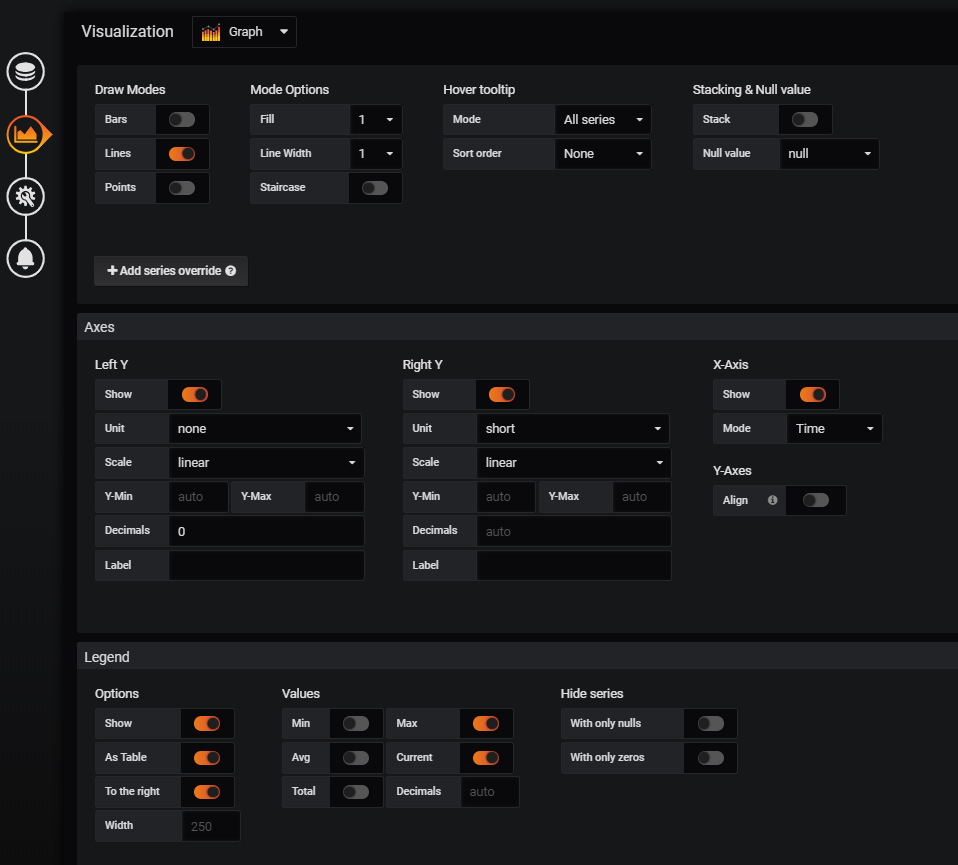
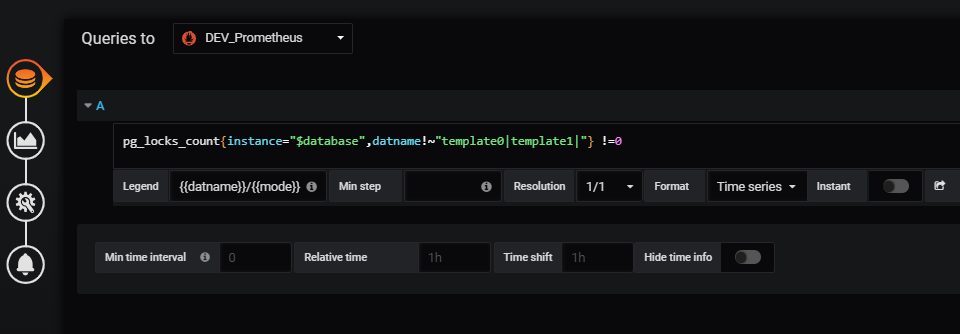
11) PostgreSQL Table Locks
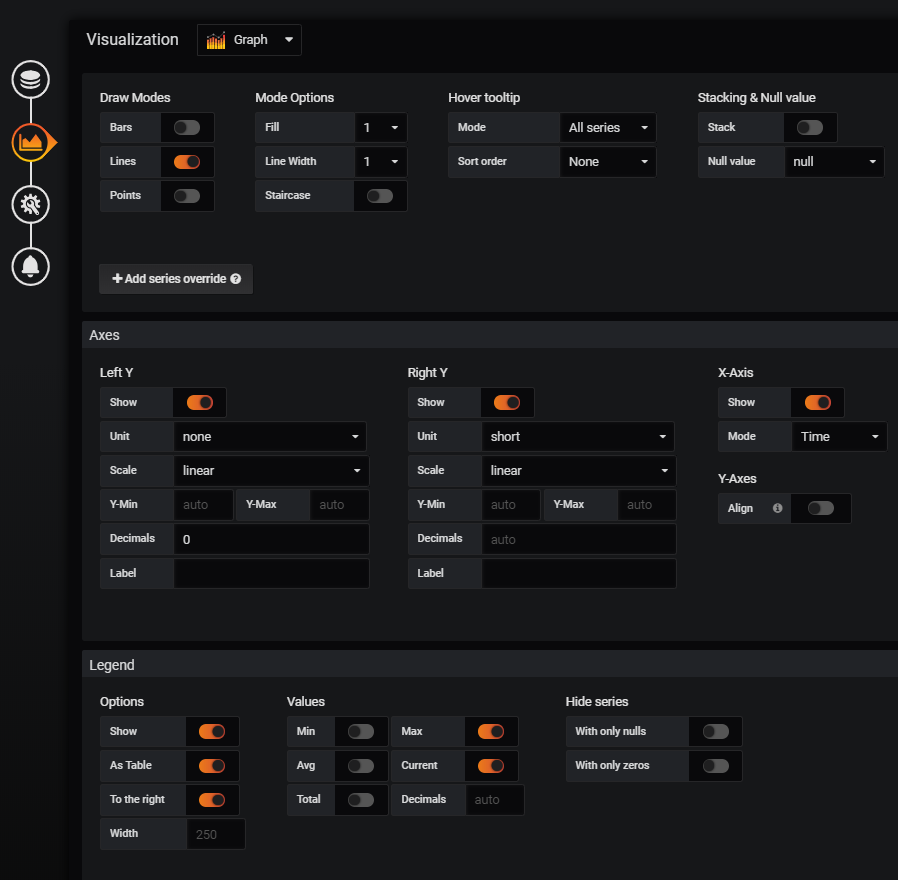
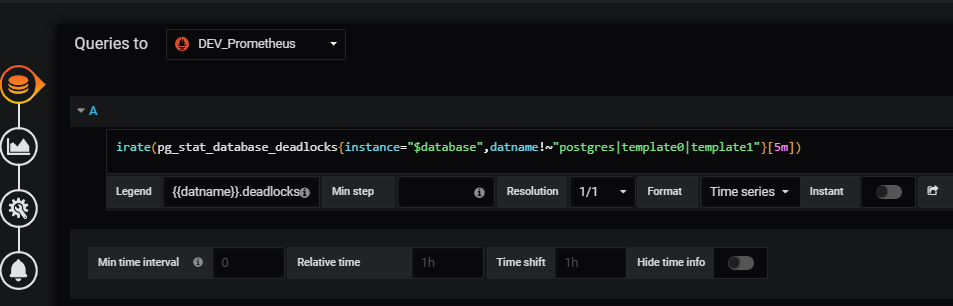
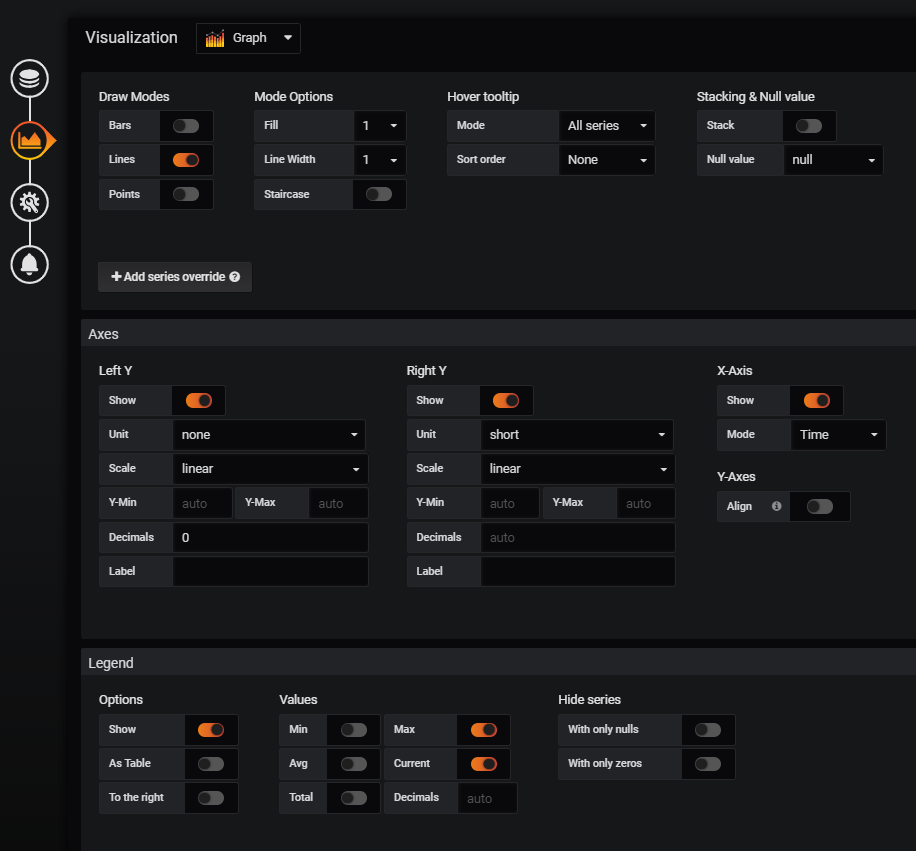
12) PostgreSQL Deadlocks
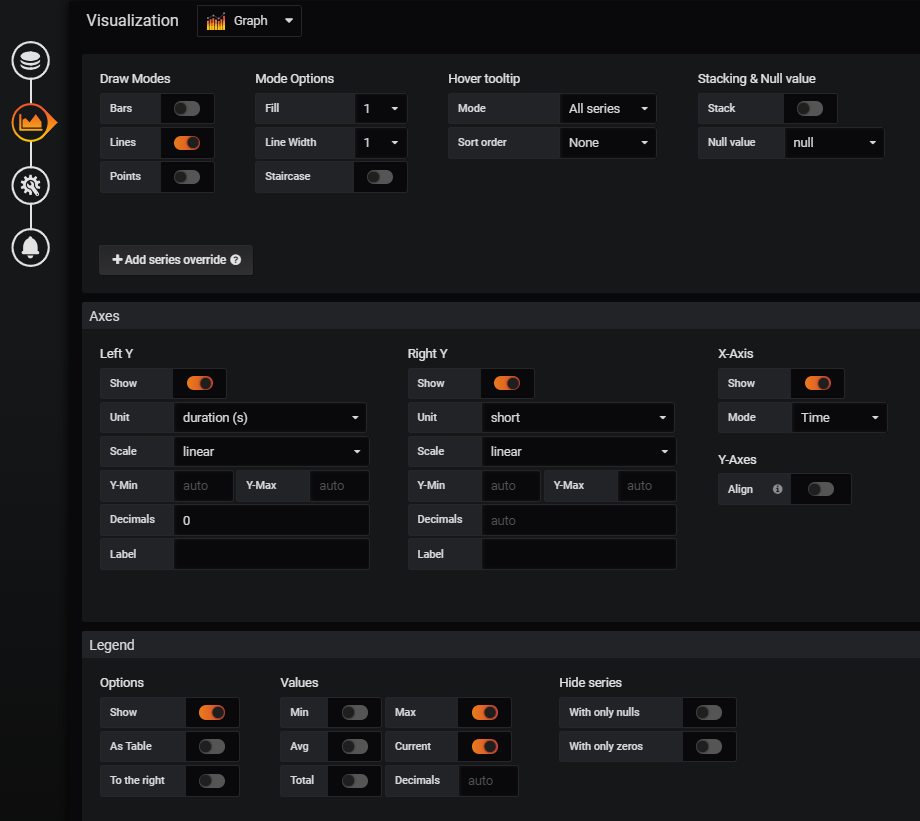
13) PostgreSQL Longest Transactions

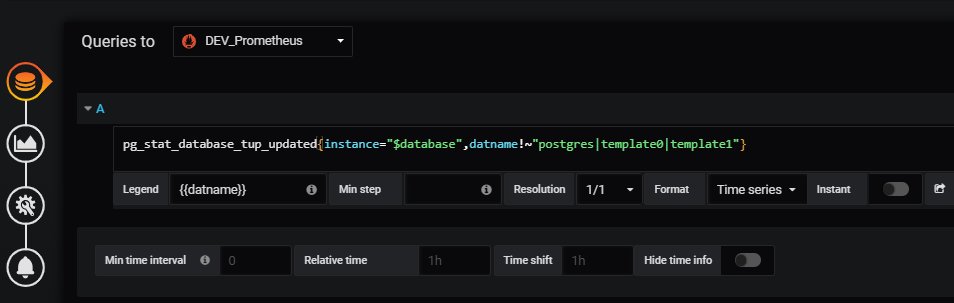
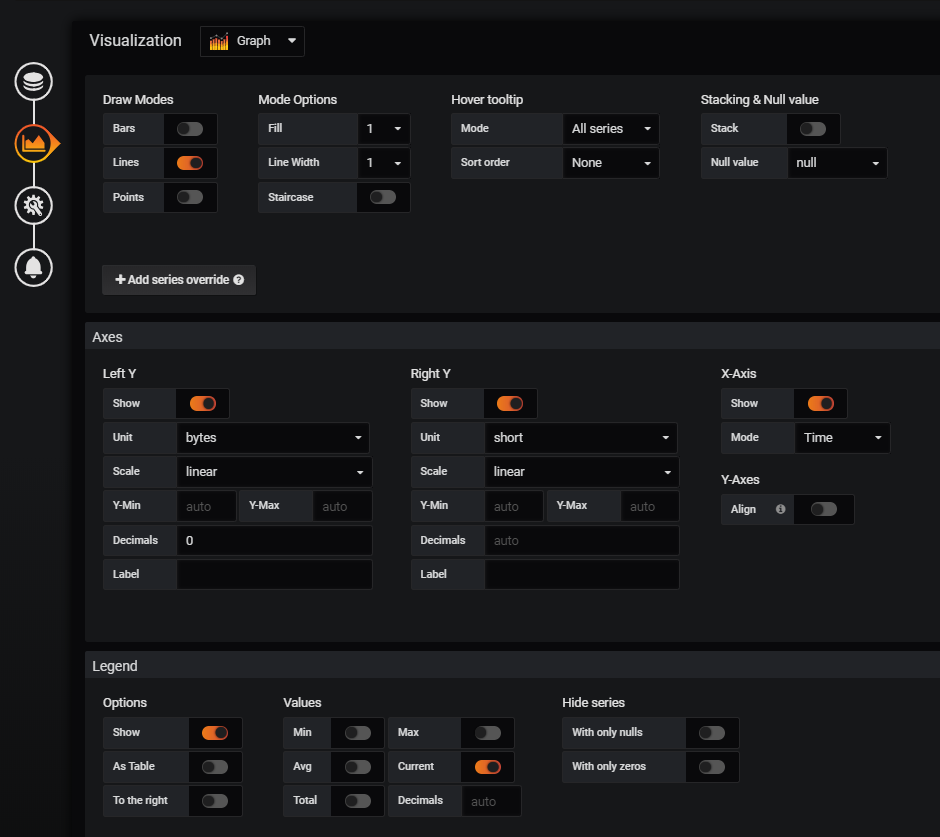
14) Tuple Updated
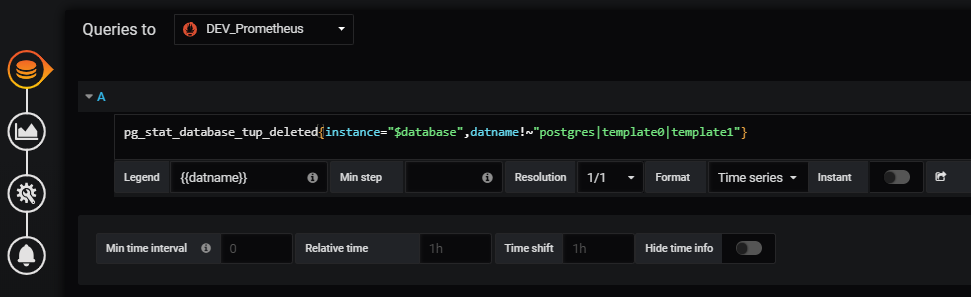
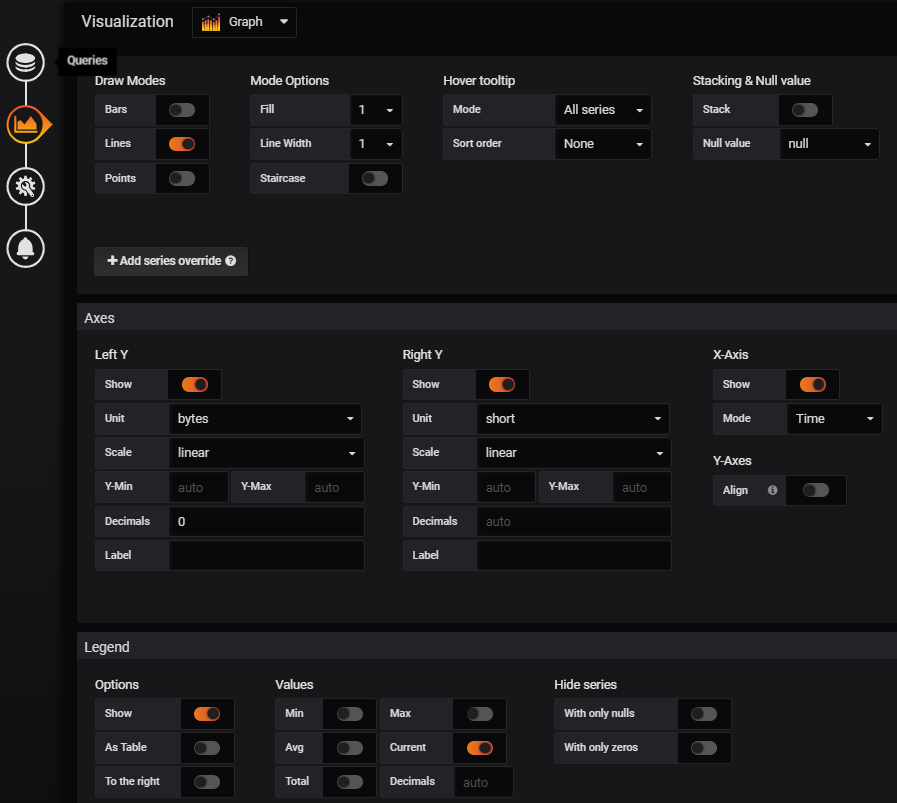
15) Tuple Deleted
16) Tuple Inserted

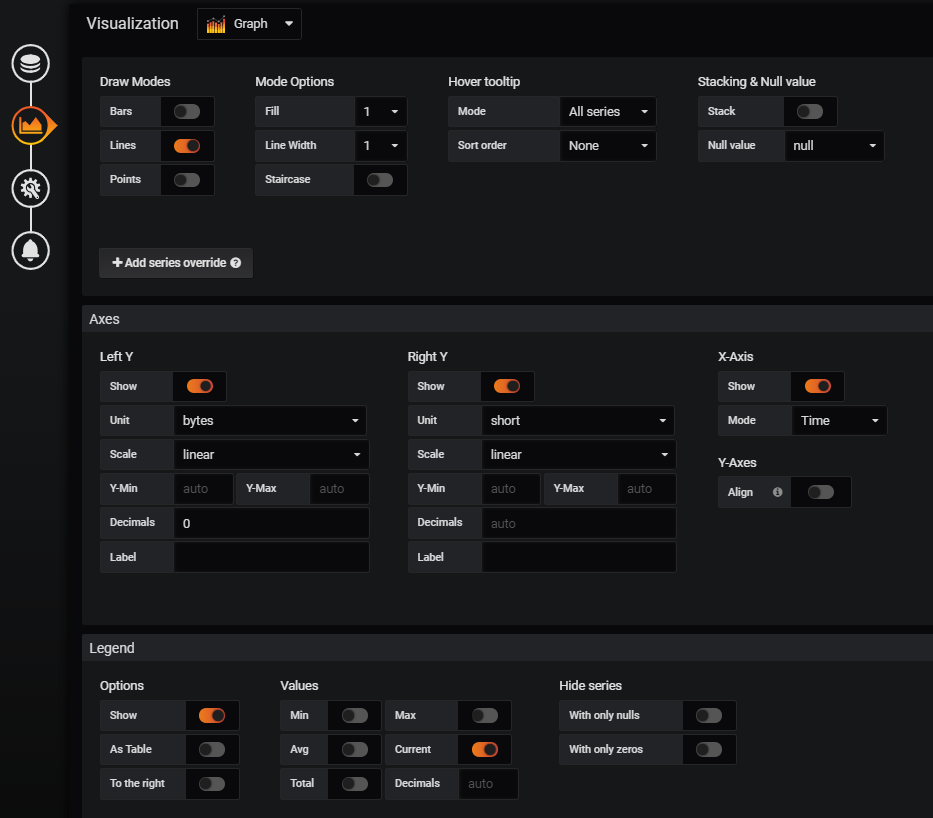
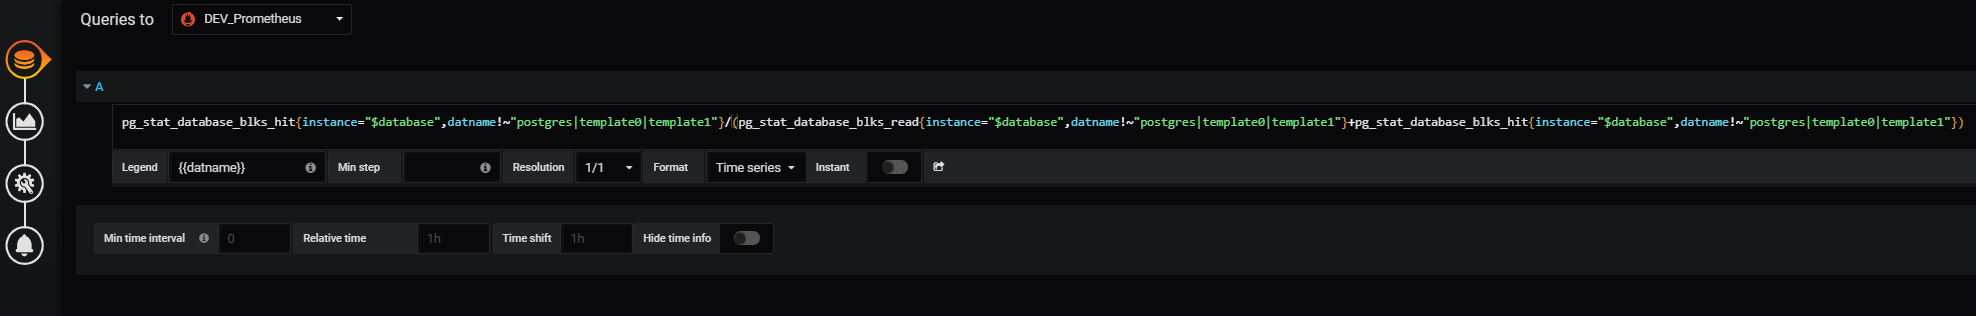
17) Cache Hit Rate
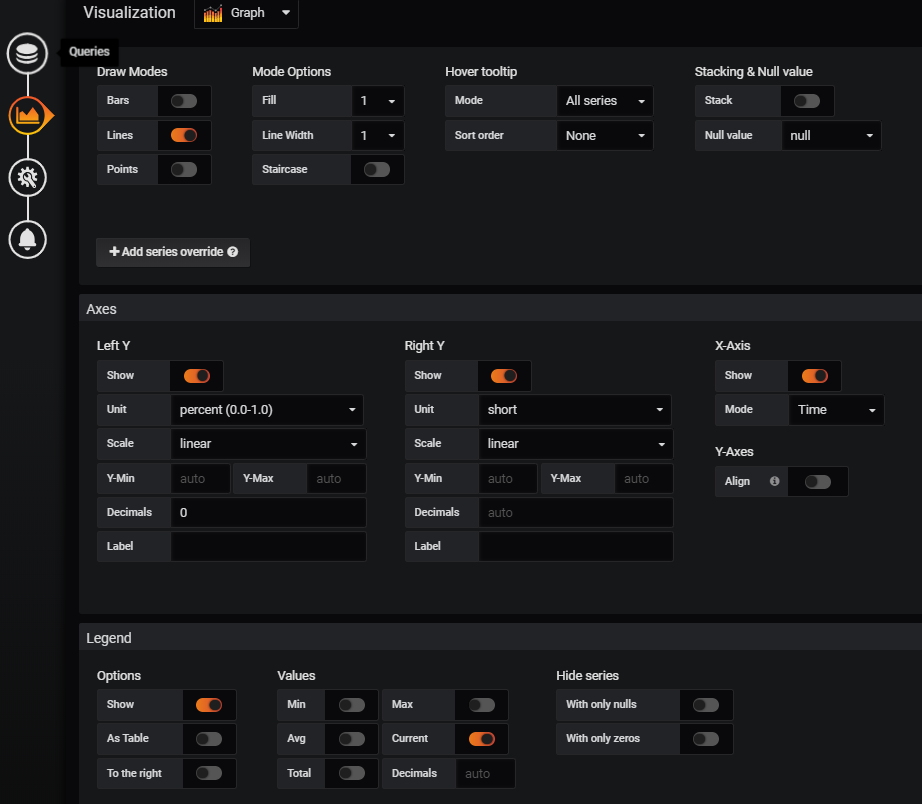
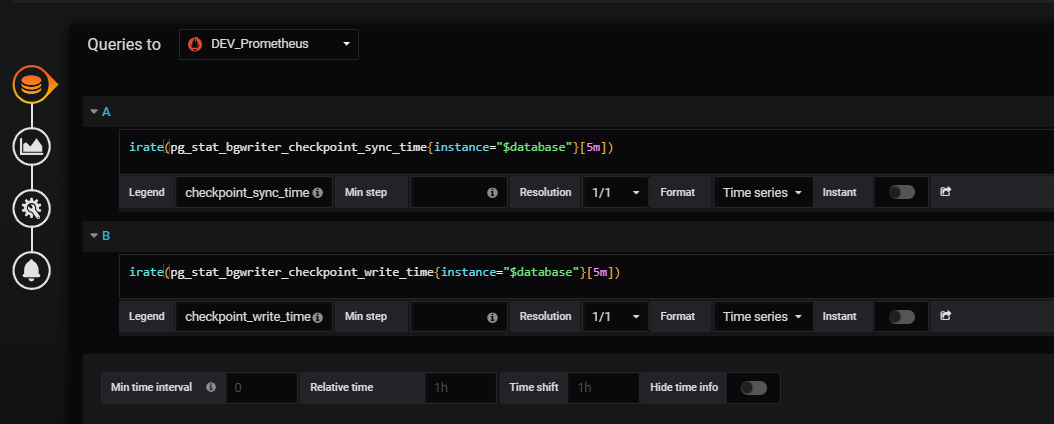
18) Checkpoint Stats

{
"__inputs": [
{
"name": "DS_DEV_PROMETHEUS",
"label": "DEV_Prometheus",
"description": "",
"type": "datasource",
"pluginId": "prometheus",
"pluginName": "Prometheus"
}
],
"__requires": [
{
"type": "panel",
"id": "gauge",
"name": "Gauge",
"version": ""
},
{
"type": "grafana",
"id": "grafana",
"name": "Grafana",
"version": "6.0.1"
},
{
"type": "panel",
"id": "graph",
"name": "Graph",
"version": "5.0.0"
},
{
"type": "datasource",
"id": "prometheus",
"name": "Prometheus",
"version": "5.0.0"
},
{
"type": "panel",
"id": "singlestat",
"name": "Singlestat",
"version": "5.0.0"
},
{
"type": "panel",
"id": "table",
"name": "Table",
"version": "5.0.0"
}
],
"annotations": {
"list": [
{
"builtIn": 1,
"datasource": "-- Grafana --",
"enable": true,
"hide": true,
"iconColor": "rgba(0, 211, 255, 1)",
"name": "Annotations & Alerts",
"type": "dashboard"
}
]
},
"editable": true,
"gnetId": null,
"graphTooltip": 0,
"id": null,
"iteration": 1552826976555,
"links": [],
"panels": [
{
"collapsed": false,
"gridPos": {
"h": 1,
"w": 24,
"x": 0,
"y": 0
},
"id": 21,
"panels": [],
"title": "==============================System Summary==============================",
"type": "row"
},
{
"cacheTimeout": null,
"colorBackground": false,
"colorValue": false,
"colors": [
"#299c46",
"rgba(237, 129, 40, 0.89)",
"#d44a3a"
],
"datasource": "${DS_DEV_PROMETHEUS}",
"format": "dateTimeAsIso",
"gauge": {
"maxValue": 100,
"minValue": 0,
"show": false,
"thresholdLabels": false,
"thresholdMarkers": true
},
"gridPos": {
"h": 6,
"w": 3,
"x": 0,
"y": 1
},
"id": 2,
"interval": null,
"links": [],
"mappingType": 1,
"mappingTypes": [
{
"name": "value to text",
"value": 1
},
{
"name": "range to text",
"value": 2
}
],
"maxDataPoints": 100,
"nullPointMode": "connected",
"nullText": null,
"postfix": "",
"postfixFontSize": "50%",
"prefix": "",
"prefixFontSize": "50%",
"rangeMaps": [
{
"from": "null",
"text": "N/A",
"to": "null"
}
],
"sparkline": {
"fillColor": "rgba(31, 118, 189, 0.18)",
"full": false,
"lineColor": "rgb(31, 120, 193)",
"show": false
},
"tableColumn": "",
"targets": [
{
"expr": "node_boot_time_seconds{instance=\"$server\"} * 1000",
"format": "time_series",
"intervalFactor": 1,
"legendFormat": "System Uptime(days)",
"refId": "A"
}
],
"thresholds": "",
"timeFrom": null,
"timeShift": null,
"title": "System Start Time",
"type": "singlestat",
"valueFontSize": "80%",
"valueMaps": [
{
"op": "=",
"text": "N/A",
"value": "null"
}
],
"valueName": "current"
},
{
"cacheTimeout": null,
"colorBackground": false,
"colorValue": false,
"colors": [
"#299c46",
"rgba(237, 129, 40, 0.89)",
"#d44a3a"
],
"datasource": "${DS_DEV_PROMETHEUS}",
"format": "none",
"gauge": {
"maxValue": 100,
"minValue": 0,
"show": false,
"thresholdLabels": false,
"thresholdMarkers": true
},
"gridPos": {
"h": 3,
"w": 2,
"x": 3,
"y": 1
},
"id": 4,
"interval": null,
"links": [],
"mappingType": 1,
"mappingTypes": [
{
"name": "value to text",
"value": 1
},
{
"name": "range to text",
"value": 2
}
],
"maxDataPoints": 100,
"nullPointMode": "connected",
"nullText": null,
"postfix": "",
"postfixFontSize": "50%",
"prefix": "",
"prefixFontSize": "50%",
"rangeMaps": [
{
"from": "null",
"text": "N/A",
"to": "null"
}
],
"sparkline": {
"fillColor": "rgba(31, 118, 189, 0.18)",
"full": false,
"lineColor": "rgb(31, 120, 193)",
"show": false
},
"tableColumn": "",
"targets": [
{
"expr": "count(count(node_cpu_seconds_total{instance=\"$server\", mode='system'}) by (cpu))",
"format": "time_series",
"intervalFactor": 1,
"refId": "A"
}
],
"thresholds": "",
"timeFrom": null,
"timeShift": null,
"title": "CPU Cores",
"type": "singlestat",
"valueFontSize": "120%",
"valueMaps": [
{
"op": "=",
"text": "N/A",
"value": "null"
}
],
"valueName": "current"
},
{
"datasource": "${DS_DEV_PROMETHEUS}",
"gridPos": {
"h": 6,
"w": 3,
"x": 5,
"y": 1
},
"id": 8,
"links": [],
"options": {
"maxValue": 100,
"minValue": 0,
"showThresholdLabels": true,
"showThresholdMarkers": true,
"thresholds": [
{
"color": "#7EB26D",
"index": 0,
"value": null
},
{
"color": "#FA6400",
"index": 1,
"value": 30
},
{
"color": "#C4162A",
"index": 2,
"value": 70
}
],
"valueMappings": [],
"valueOptions": {
"decimals": 2,
"prefix": "",
"stat": "current",
"suffix": "",
"unit": "percent"
}
},
"targets": [
{
"expr": "100 - (avg(irate(node_cpu_seconds_total{instance=\"$server\",mode=\"idle\"}[5m])) * 100)",
"format": "time_series",
"intervalFactor": 1,
"refId": "A"
}
],
"timeFrom": null,
"timeShift": null,
"title": "CPU Usage (5m)",
"type": "gauge"
},
{
"datasource": "${DS_DEV_PROMETHEUS}",
"gridPos": {
"h": 6,
"w": 3,
"x": 8,
"y": 1
},
"id": 10,
"links": [],
"options": {
"maxValue": 100,
"minValue": 0,
"showThresholdLabels": true,
"showThresholdMarkers": true,
"thresholds": [
{
"color": "#7EB26D",
"index": 0,
"value": null
},
{
"color": "#FA6400",
"index": 1,
"value": 30
},
{
"color": "#C4162A",
"index": 2,
"value": 50
}
],
"valueMappings": [],
"valueOptions": {
"decimals": 2,
"prefix": "",
"stat": "current",
"suffix": "",
"unit": "percent"
}
},
"targets": [
{
"expr": "avg(irate(node_cpu_seconds_total{instance=\"$server\",mode=\"iowait\"}[5m])) * 100",
"format": "time_series",
"intervalFactor": 1,
"refId": "A"
}
],
"timeFrom": null,
"timeShift": null,
"title": "CPU IO Wait (5m)",
"type": "gauge"
},
{
"datasource": "${DS_DEV_PROMETHEUS}",
"gridPos": {
"h": 6,
"w": 3,
"x": 11,
"y": 1
},
"id": 12,
"links": [],
"options": {
"maxValue": 100,
"minValue": 0,
"showThresholdLabels": false,
"showThresholdMarkers": true,
"thresholds": [
{
"color": "#7EB26D",
"index": 0,
"value": null
},
{
"color": "#FA6400",
"index": 1,
"value": 80
},
{
"color": "#C4162A",
"index": 2,
"value": 90
}
],
"valueMappings": [],
"valueOptions": {
"decimals": null,
"prefix": "",
"stat": "current",
"suffix": "",
"unit": "percent"
}
},
"targets": [
{
"expr": "(node_memory_MemTotal_bytes{instance=\"$server\"} - (node_memory_MemFree_bytes{instance=\"$server\"} + node_memory_Buffers_bytes{instance=\"$server\"} + node_memory_Cached_bytes{instance=\"$server\"})) / node_memory_MemTotal_bytes{instance=\"$server\"} * 100",
"format": "time_series",
"intervalFactor": 1,
"refId": "A"
}
],
"timeFrom": null,
"timeShift": null,
"title": "Memory Used",
"type": "gauge"
},
{
"datasource": "${DS_DEV_PROMETHEUS}",
"gridPos": {
"h": 6,
"w": 3,
"x": 14,
"y": 1
},
"id": 13,
"links": [],
"options": {
"maxValue": 100,
"minValue": 0,
"showThresholdLabels": false,
"showThresholdMarkers": true,
"thresholds": [
{
"color": "#C4162A",
"index": 0,
"value": null
},
{
"color": "#FA6400",
"index": 1,
"value": 20
},
{
"color": "#37872D",
"index": 2,
"value": 50
}
],
"valueMappings": [],
"valueOptions": {
"decimals": 2,
"prefix": "",
"stat": "current",
"suffix": "",
"unit": "percent"
}
},
"targets": [
{
"expr": "(node_memory_Cached_bytes{instance=\"$server\"} * 100) / node_memory_MemTotal_bytes{instance=\"$server\"}",
"format": "time_series",
"intervalFactor": 1,
"refId": "A"
}
],
"timeFrom": null,
"timeShift": null,
"title": "Memory Cached",
"type": "gauge"
},
{
"aliasColors": {},
"bars": false,
"dashLength": 10,
"dashes": false,
"datasource": "${DS_DEV_PROMETHEUS}",
"fill": 1,
"gridPos": {
"h": 6,
"w": 7,
"x": 17,
"y": 1
},
"id": 15,
"legend": {
"alignAsTable": true,
"avg": false,
"current": true,
"max": true,
"min": false,
"rightSide": true,
"show": true,
"total": false,
"values": true
},
"lines": true,
"linewidth": 1,
"links": [],
"nullPointMode": "null",
"paceLength": 10,
"percentage": false,
"pointradius": 2,
"points": false,
"renderer": "flot",
"seriesOverrides": [],
"stack": false,
"steppedLine": false,
"targets": [
{
"expr": "node_load1{instance=\"$server\"}",
"format": "time_series",
"intervalFactor": 1,
"legendFormat": "1m",
"refId": "A"
},
{
"expr": "node_load5{instance=\"$server\"}",
"format": "time_series",
"intervalFactor": 1,
"legendFormat": "5m",
"refId": "B"
},
{
"expr": "node_load15{instance=\"$server\"}",
"format": "time_series",
"intervalFactor": 1,
"legendFormat": "15m",
"refId": "C"
}
],
"thresholds": [],
"timeFrom": null,
"timeRegions": [],
"timeShift": null,
"title": "System Average Load (1,5,15) ",
"tooltip": {
"shared": true,
"sort": 0,
"value_type": "individual"
},
"type": "graph",
"xaxis": {
"buckets": null,
"mode": "time",
"name": null,
"show": true,
"values": []
},
"yaxes": [
{
"format": "short",
"label": null,
"logBase": 1,
"max": null,
"min": null,
"show": true
},
{
"format": "short",
"label": null,
"logBase": 1,
"max": null,
"min": null,
"show": true
}
],
"yaxis": {
"align": false,
"alignLevel": null
}
},
{
"cacheTimeout": null,
"colorBackground": false,
"colorValue": false,
"colors": [
"#299c46",
"rgba(237, 129, 40, 0.89)",
"#d44a3a"
],
"datasource": "${DS_DEV_PROMETHEUS}",
"format": "bytes",
"gauge": {
"maxValue": 100,
"minValue": 0,
"show": false,
"thresholdLabels": false,
"thresholdMarkers": true
},
"gridPos": {
"h": 3,
"w": 2,
"x": 3,
"y": 4
},
"id": 6,
"interval": null,
"links": [],
"mappingType": 1,
"mappingTypes": [
{
"name": "value to text",
"value": 1
},
{
"name": "range to text",
"value": 2
}
],
"maxDataPoints": 100,
"nullPointMode": "connected",
"nullText": null,
"postfix": "",
"postfixFontSize": "50%",
"prefix": "",
"prefixFontSize": "50%",
"rangeMaps": [
{
"from": "null",
"text": "N/A",
"to": "null"
}
],
"sparkline": {
"fillColor": "rgba(31, 118, 189, 0.18)",
"full": false,
"lineColor": "rgb(31, 120, 193)",
"show": false
},
"tableColumn": "",
"targets": [
{
"expr": "node_memory_MemTotal_bytes{instance=\"$server\"}",
"format": "time_series",
"intervalFactor": 1,
"refId": "A"
}
],
"thresholds": "",
"timeFrom": null,
"timeShift": null,
"title": "Memory Size",
"type": "singlestat",
"valueFontSize": "80%",
"valueMaps": [
{
"op": "=",
"text": "N/A",
"value": "null"
}
],
"valueName": "current"
},
{
"columns": [],
"datasource": "${DS_DEV_PROMETHEUS}",
"fontSize": "100%",
"gridPos": {
"h": 6,
"w": 11,
"x": 0,
"y": 7
},
"id": 17,
"links": [],
"pageSize": null,
"scroll": true,
"showHeader": true,
"sort": {
"col": 9,
"desc": false
},
"styles": [
{
"alias": "Available Size",
"colorMode": "cell",
"colors": [
"rgba(245, 54, 54, 0.9)",
"rgba(237, 129, 40, 0.89)",
"rgba(50, 172, 45, 0.97)"
],
"decimals": 1,
"link": false,
"pattern": "Value #A",
"thresholds": [
"1000000000",
"5000000000"
],
"type": "number",
"unit": "bytes"
},
{
"alias": "Size Used Percent ",
"colorMode": "cell",
"colors": [
"rgba(50, 172, 45, 0.97)",
"rgba(237, 129, 40, 0.89)",
"rgba(245, 54, 54, 0.9)"
],
"dateFormat": "YYYY-MM-DD HH:mm:ss",
"decimals": 1,
"mappingType": 1,
"pattern": "Value #B",
"thresholds": [
"0.8",
"0.9"
],
"type": "number",
"unit": "percentunit"
},
{
"alias": "Total Size",
"colorMode": null,
"colors": [
"rgba(245, 54, 54, 0.9)",
"rgba(237, 129, 40, 0.89)",
"rgba(50, 172, 45, 0.97)"
],
"dateFormat": "YYYY-MM-DD HH:mm:ss",
"decimals": 0,
"mappingType": 1,
"pattern": "Value #C",
"thresholds": [],
"type": "number",
"unit": "bytes"
},
{
"alias": "FIle System",
"colorMode": null,
"colors": [
"rgba(245, 54, 54, 0.9)",
"rgba(237, 129, 40, 0.89)",
"rgba(50, 172, 45, 0.97)"
],
"dateFormat": "YYYY-MM-DD HH:mm:ss",
"decimals": 2,
"mappingType": 1,
"pattern": "fstype",
"thresholds": [],
"type": "number",
"unit": "short"
},
{
"alias": "Disk",
"colorMode": null,
"colors": [
"#37872D",
"rgba(237, 129, 40, 0.89)",
"rgba(50, 172, 45, 0.97)"
],
"dateFormat": "YYYY-MM-DD HH:mm:ss",
"decimals": 2,
"mappingType": 1,
"pattern": "device",
"thresholds": [],
"type": "number",
"unit": "short"
},
{
"alias": "Mount Point",
"colorMode": null,
"colors": [
"rgba(245, 54, 54, 0.9)",
"rgba(237, 129, 40, 0.89)",
"rgba(50, 172, 45, 0.97)"
],
"dateFormat": "YYYY-MM-DD HH:mm:ss",
"decimals": 2,
"mappingType": 1,
"pattern": "mountpoint",
"thresholds": [],
"type": "number",
"unit": "short"
},
{
"alias": "",
"colorMode": null,
"colors": [
"rgba(245, 54, 54, 0.9)",
"rgba(237, 129, 40, 0.89)",
"rgba(50, 172, 45, 0.97)"
],
"dateFormat": "YYYY-MM-DD HH:mm:ss",
"decimals": 2,
"mappingType": 1,
"pattern": "/.*/",
"thresholds": [],
"type": "hidden",
"unit": "short"
}
],
"targets": [
{
"expr": "(node_filesystem_size_bytes{instance='$server',fstype=~\"ext3|ext4|xfs|nfs\"})/100 *100",
"format": "table",
"instant": true,
"intervalFactor": 1,
"refId": "C"
},
{
"expr": "node_filesystem_avail_bytes {instance='$server',fstype=~\"ext3|ext4|xfs|nfs\"}",
"format": "table",
"instant": true,
"intervalFactor": 1,
"refId": "A"
},
{
"expr": "1-(node_filesystem_free_bytes{instance='$server',fstype=~\"ext3|ext4|xfs|nfs\"} / node_filesystem_size_bytes{instance='$server',fstype=~\"ext3|ext4|xfs|nfs\"})",
"format": "table",
"instant": true,
"intervalFactor": 1,
"refId": "B"
}
],
"timeFrom": null,
"timeShift": null,
"title": "Disk Usage",
"transform": "table",
"type": "table"
},
{
"aliasColors": {},
"bars": false,
"dashLength": 10,
"dashes": false,
"datasource": "${DS_DEV_PROMETHEUS}",
"fill": 1,
"gridPos": {
"h": 6,
"w": 13,
"x": 11,
"y": 7
},
"id": 19,
"legend": {
"avg": false,
"current": true,
"max": false,
"min": false,
"show": true,
"total": false,
"values": true
},
"lines": true,
"linewidth": 1,
"links": [],
"nullPointMode": "null",
"paceLength": 10,
"percentage": false,
"pointradius": 2,
"points": false,
"renderer": "flot",
"seriesOverrides": [
{
"alias": "/.*writes$/",
"transform": "negative-Y"
}
],
"stack": false,
"steppedLine": false,
"targets": [
{
"expr": "irate(node_disk_reads_completed_total{instance=~\"$server\"}[1m])",
"format": "time_series",
"intervalFactor": 1,
"legendFormat": "{{device}}_reads",
"refId": "A"
},
{
"expr": "irate(node_disk_writes_completed_total{instance=~\"$server\"}[1m])",
"format": "time_series",
"intervalFactor": 1,
"legendFormat": "{{device}}_writes",
"refId": "B"
},
{
"expr": "node_disk_io_now{instance=~\"$server\"}",
"format": "time_series",
"intervalFactor": 1,
"legendFormat": "{{device}}",
"refId": "C"
}
],
"thresholds": [],
"timeFrom": null,
"timeRegions": [],
"timeShift": null,
"title": "Disk Read/Write IOPS (1m)",
"tooltip": {
"shared": true,
"sort": 0,
"value_type": "individual"
},
"type": "graph",
"xaxis": {
"buckets": null,
"mode": "time",
"name": null,
"show": true,
"values": []
},
"yaxes": [
{
"format": "ops",
"label": "reads(+)/ writes(-) ",
"logBase": 1,
"max": null,
"min": null,
"show": true
},
{
"format": "short",
"label": "I/O ops/sec",
"logBase": 1,
"max": null,
"min": null,
"show": true
}
],
"yaxis": {
"align": false,
"alignLevel": null
}
},
{
"collapsed": true,
"gridPos": {
"h": 1,
"w": 24,
"x": 0,
"y": 13
},
"id": 23,
"panels": [],
"title": "==============================Databsase Summary==============================",
"type": "row"
},
{
"cacheTimeout": null,
"colorBackground": false,
"colorValue": false,
"colors": [
"#299c46",
"rgba(237, 129, 40, 0.89)",
"#d44a3a"
],
"datasource": "${DS_DEV_PROMETHEUS}",
"format": "dateTimeAsIso",
"gauge": {
"maxValue": 100,
"minValue": 0,
"show": false,
"thresholdLabels": false,
"thresholdMarkers": true
},
"gridPos": {
"h": 4,
"w": 4,
"x": 0,
"y": 14
},
"id": 25,
"interval": null,
"links": [],
"mappingType": 1,
"mappingTypes": [
{
"name": "value to text",
"value": 1
},
{
"name": "range to text",
"value": 2
}
],
"maxDataPoints": 100,
"nullPointMode": "connected",
"nullText": null,
"postfix": "",
"postfixFontSize": "50%",
"prefix": "",
"prefixFontSize": "50%",
"rangeMaps": [
{
"from": "null",
"text": "N/A",
"to": "null"
}
],
"sparkline": {
"fillColor": "rgba(31, 118, 189, 0.18)",
"full": false,
"lineColor": "rgb(31, 120, 193)",
"show": false
},
"tableColumn": "",
"targets": [
{
"expr": "pg_postmaster_start_time_seconds{instance=\"$database\"} * 1000",
"format": "time_series",
"intervalFactor": 1,
"refId": "A"
}
],
"thresholds": "",
"timeFrom": null,
"timeShift": null,
"title": "PostgreSQL Start Time",
"type": "singlestat",
"valueFontSize": "80%",
"valueMaps": [
{
"op": "=",
"text": "N/A",
"value": "null"
}
],
"valueName": "current"
},
{
"cacheTimeout": null,
"colorBackground": false,
"colorValue": false,
"colors": [
"#299c46",
"rgba(237, 129, 40, 0.89)",
"#d44a3a"
],
"datasource": "${DS_DEV_PROMETHEUS}",
"format": "none",
"gauge": {
"maxValue": 100,
"minValue": 0,
"show": false,
"thresholdLabels": false,
"thresholdMarkers": true
},
"gridPos": {
"h": 4,
"w": 3,
"x": 4,
"y": 14
},
"id": 26,
"interval": null,
"links": [],
"mappingType": 1,
"mappingTypes": [
{
"name": "value to text",
"value": 1
},
{
"name": "range to text",
"value": 2
}
],
"maxDataPoints": 100,
"nullPointMode": "connected",
"nullText": null,
"postfix": "",
"postfixFontSize": "50%",
"prefix": "",
"prefixFontSize": "50%",
"rangeMaps": [
{
"from": "null",
"text": "N/A",
"to": "null"
}
],
"sparkline": {
"fillColor": "rgba(31, 118, 189, 0.18)",
"full": false,
"lineColor": "rgb(31, 120, 193)",
"show": false
},
"tableColumn": "",
"targets": [
{
"expr": "pg_static{instance=\"$database\"}",
"format": "time_series",
"intervalFactor": 1,
"legendFormat": "{{short_version}}",
"refId": "A"
}
],
"thresholds": "",
"timeFrom": null,
"timeShift": null,
"title": "PostgreSQL Version",
"type": "singlestat",
"valueFontSize": "80%",
"valueMaps": [
{
"op": "=",
"text": "N/A",
"value": "null"
}
],
"valueName": "name"
},
{
"cacheTimeout": null,
"colorBackground": false,
"colorValue": false,
"colors": [
"#299c46",
"rgba(237, 129, 40, 0.89)",
"#d44a3a"
],
"datasource": "${DS_DEV_PROMETHEUS}",
"format": "bytes",
"gauge": {
"maxValue": 100,
"minValue": 0,
"show": false,
"thresholdLabels": false,
"thresholdMarkers": true
},
"gridPos": {
"h": 4,
"w": 3,
"x": 7,
"y": 14
},
"id": 27,
"interval": null,
"links": [],
"mappingType": 1,
"mappingTypes": [
{
"name": "value to text",
"value": 1
},
{
"name": "range to text",
"value": 2
}
],
"maxDataPoints": 100,
"nullPointMode": "connected",
"nullText": null,
"postfix": "",
"postfixFontSize": "50%",
"prefix": "",
"prefixFontSize": "50%",
"rangeMaps": [
{
"from": "null",
"text": "N/A",
"to": "null"
}
],
"sparkline": {
"fillColor": "rgba(31, 118, 189, 0.18)",
"full": false,
"lineColor": "rgb(31, 120, 193)",
"show": false
},
"tableColumn": "",
"targets": [
{
"expr": "pg_settings_shared_buffers_bytes{instance=\"$database\"}",
"format": "time_series",
"intervalFactor": 1,
"legendFormat": "",
"refId": "A"
}
],
"thresholds": "",
"timeFrom": null,
"timeShift": null,
"title": "PostgreSQL Shared_buffers",
"type": "singlestat",
"valueFontSize": "80%",
"valueMaps": [
{
"op": "=",
"text": "N/A",
"value": "null"
}
],
"valueName": "current"
},
{
"cacheTimeout": null,
"colorBackground": false,
"colorValue": false,
"colors": [
"#299c46",
"rgba(237, 129, 40, 0.89)",
"#d44a3a"
],
"datasource": "${DS_DEV_PROMETHEUS}",
"format": "bytes",
"gauge": {
"maxValue": 100,
"minValue": 0,
"show": false,
"thresholdLabels": false,
"thresholdMarkers": true
},
"gridPos": {
"h": 4,
"w": 3,
"x": 10,
"y": 14
},
"id": 28,
"interval": null,
"links": [],
"mappingType": 1,
"mappingTypes": [
{
"name": "value to text",
"value": 1
},
{
"name": "range to text",
"value": 2
}
],
"maxDataPoints": 100,
"nullPointMode": "connected",
"nullText": null,
"postfix": "",
"postfixFontSize": "50%",
"prefix": "",
"prefixFontSize": "50%",
"rangeMaps": [
{
"from": "null",
"text": "N/A",
"to": "null"
}
],
"sparkline": {
"fillColor": "rgba(31, 118, 189, 0.18)",
"full": false,
"lineColor": "rgb(31, 120, 193)",
"show": false
},
"tableColumn": "",
"targets": [
{
"expr": "pg_settings_effective_cache_size_bytes{instance=\"$database\"}",
"format": "time_series",
"intervalFactor": 1,
"legendFormat": "",
"refId": "A"
}
],
"thresholds": "",
"timeFrom": null,
"timeShift": null,
"title": "PostgreSQL Effective_cache_size",
"type": "singlestat",
"valueFontSize": "80%",
"valueMaps": [
{
"op": "=",
"text": "N/A",
"value": "null"
}
],
"valueName": "current"
},
{
"cacheTimeout": null,
"colorBackground": false,
"colorValue": false,
"colors": [
"#299c46",
"rgba(237, 129, 40, 0.89)",
"#d44a3a"
],
"datasource": "${DS_DEV_PROMETHEUS}",
"format": "bytes",
"gauge": {
"maxValue": 100,
"minValue": 0,
"show": false,
"thresholdLabels": false,
"thresholdMarkers": true
},
"gridPos": {
"h": 4,
"w": 3,
"x": 13,
"y": 14
},
"id": 29,
"interval": null,
"links": [],
"mappingType": 1,
"mappingTypes": [
{
"name": "value to text",
"value": 1
},
{
"name": "range to text",
"value": 2
}
],
"maxDataPoints": 100,
"nullPointMode": "connected",
"nullText": null,
"postfix": "",
"postfixFontSize": "50%",
"prefix": "",
"prefixFontSize": "50%",
"rangeMaps": [
{
"from": "null",
"text": "N/A",
"to": "null"
}
],
"sparkline": {
"fillColor": "rgba(31, 118, 189, 0.18)",
"full": false,
"lineColor": "rgb(31, 120, 193)",
"show": false
},
"tableColumn": "",
"targets": [
{
"expr": "pg_settings_work_mem_bytes{instance=\"$database\"}",
"format": "time_series",
"intervalFactor": 1,
"legendFormat": "",
"refId": "A"
}
],
"thresholds": "",
"timeFrom": null,
"timeShift": null,
"title": "PostgreSQL Work Memory",
"type": "singlestat",
"valueFontSize": "80%",
"valueMaps": [
{
"op": "=",
"text": "N/A",
"value": "null"
}
],
"valueName": "current"
},
{
"cacheTimeout": null,
"colorBackground": false,
"colorValue": false,
"colors": [
"#299c46",
"rgba(237, 129, 40, 0.89)",
"#d44a3a"
],
"datasource": "${DS_DEV_PROMETHEUS}",
"format": "none",
"gauge": {
"maxValue": 100,
"minValue": 0,
"show": false,
"thresholdLabels": false,
"thresholdMarkers": true
},
"gridPos": {
"h": 4,
"w": 3,
"x": 16,
"y": 14
},
"id": 30,
"interval": null,
"links": [],
"mappingType": 1,
"mappingTypes": [
{
"name": "value to text",
"value": 1
},
{
"name": "range to text",
"value": 2
}
],
"maxDataPoints": 100,
"nullPointMode": "connected",
"nullText": null,
"postfix": "",
"postfixFontSize": "50%",
"prefix": "",
"prefixFontSize": "50%",
"rangeMaps": [
{
"from": "null",
"text": "N/A",
"to": "null"
}
],
"sparkline": {
"fillColor": "rgba(31, 118, 189, 0.18)",
"full": false,
"lineColor": "rgb(31, 120, 193)",
"show": false
},
"tableColumn": "",
"targets": [
{
"expr": "pg_settings_max_connections{instance=\"$database\"}",
"format": "time_series",
"intervalFactor": 1,
"legendFormat": "",
"refId": "A"
}
],
"thresholds": "",
"timeFrom": null,
"timeShift": null,
"title": "PostgreSQL Max Connections",
"type": "singlestat",
"valueFontSize": "80%",
"valueMaps": [
{
"op": "=",
"text": "N/A",
"value": "null"
}
],
"valueName": "current"
},
{
"cacheTimeout": null,
"colorBackground": false,
"colorValue": false,
"colors": [
"#299c46",
"rgba(237, 129, 40, 0.89)",
"#d44a3a"
],
"datasource": "${DS_DEV_PROMETHEUS}",
"format": "none",
"gauge": {
"maxValue": 100,
"minValue": 0,
"show": false,
"thresholdLabels": false,
"thresholdMarkers": true
},
"gridPos": {
"h": 4,
"w": 3,
"x": 19,
"y": 14
},
"id": 31,
"interval": null,
"links": [],
"mappingType": 1,
"mappingTypes": [
{
"name": "value to text",
"value": 1
},
{
"name": "range to text",
"value": 2
}
],
"maxDataPoints": 100,
"nullPointMode": "connected",
"nullText": null,
"postfix": "",
"postfixFontSize": "50%",
"prefix": "",
"prefixFontSize": "50%",
"rangeMaps": [
{
"from": "null",
"text": "N/A",
"to": "null"
}
],
"sparkline": {
"fillColor": "rgba(31, 118, 189, 0.18)",
"full": false,
"lineColor": "rgb(31, 120, 193)",
"show": false
},
"tableColumn": "",
"targets": [
{
"expr": "pg_settings_logging_collector{instance=\"$database\"}",
"format": "time_series",
"intervalFactor": 1,
"legendFormat": "",
"refId": "A"
}
],
"thresholds": "",
"timeFrom": null,
"timeShift": null,
"title": "Logging Collector",
"type": "singlestat",
"valueFontSize": "80%",
"valueMaps": [
{
"op": "=",
"text": "off",
"value": "0"
},
{
"op": "=",
"text": "on",
"value": "1"
}
],
"valueName": "current"
},
{
"cacheTimeout": null,
"colorBackground": false,
"colorValue": false,
"colors": [
"#299c46",
"rgba(237, 129, 40, 0.89)",
"#d44a3a"
],
"datasource": "${DS_DEV_PROMETHEUS}",
"format": "none",
"gauge": {
"maxValue": 100,
"minValue": 0,
"show": false,
"thresholdLabels": false,
"thresholdMarkers": true
},
"gridPos": {
"h": 4,
"w": 2,
"x": 22,
"y": 14
},
"id": 32,
"interval": null,
"links": [],
"mappingType": 1,
"mappingTypes": [
{
"name": "value to text",
"value": 1
},
{
"name": "range to text",
"value": 2
}
],
"maxDataPoints": 100,
"nullPointMode": "connected",
"nullText": null,
"postfix": "",
"postfixFontSize": "50%",
"prefix": "",
"prefixFontSize": "50%",
"rangeMaps": [
{
"from": "null",
"text": "N/A",
"to": "null"
}
],
"sparkline": {
"fillColor": "rgba(31, 118, 189, 0.18)",
"full": false,
"lineColor": "rgb(31, 120, 193)",
"show": false
},
"tableColumn": "",
"targets": [
{
"expr": "pg_settings_fsync{instance=\"$database\"}",
"format": "time_series",
"intervalFactor": 1,
"legendFormat": "",
"refId": "A"
}
],
"thresholds": "",
"timeFrom": null,
"timeShift": null,
"title": "PostgreSQL Fsync",
"type": "singlestat",
"valueFontSize": "80%",
"valueMaps": [
{
"op": "=",
"text": "off",
"value": "0"
},
{
"op": "=",
"text": "on",
"value": "1"
}
],
"valueName": "current"
},
{
"aliasColors": {},
"bars": false,
"dashLength": 10,
"dashes": false,
"datasource": "${DS_DEV_PROMETHEUS}",
"fill": 1,
"gridPos": {
"h": 7,
"w": 5,
"x": 0,
"y": 18
},
"id": 34,
"legend": {
"alignAsTable": false,
"avg": false,
"current": false,
"max": false,
"min": false,
"rightSide": false,
"show": true,
"total": false,
"values": false
},
"lines": true,
"linewidth": 1,
"links": [],
"nullPointMode": "null",
"paceLength": 10,
"percentage": false,
"pointradius": 2,
"points": false,
"renderer": "flot",
"seriesOverrides": [],
"stack": false,
"steppedLine": false,
"targets": [
{
"expr": "pg_database_size{instance=\"$database\",datname!~\"postgres|template0|template1\"}",
"format": "time_series",
"intervalFactor": 1,
"legendFormat": "{{datname}}",
"refId": "A"
}
],
"thresholds": [],
"timeFrom": null,
"timeRegions": [],
"timeShift": null,
"title": "PostgreSQL Database Size",
"tooltip": {
"shared": true,
"sort": 0,
"value_type": "individual"
},
"type": "graph",
"xaxis": {
"buckets": null,
"mode": "time",
"name": null,
"show": true,
"values": []
},
"yaxes": [
{
"format": "bytes",
"label": null,
"logBase": 1,
"max": null,
"min": null,
"show": true
},
{
"format": "short",
"label": null,
"logBase": 1,
"max": null,
"min": null,
"show": true
}
],
"yaxis": {
"align": false,
"alignLevel": null
}
},
{
"aliasColors": {},
"bars": false,
"dashLength": 10,
"dashes": false,
"datasource": "${DS_DEV_PROMETHEUS}",
"decimals": null,
"fill": 1,
"gridPos": {
"h": 7,
"w": 7,
"x": 5,
"y": 18
},
"id": 36,
"legend": {
"alignAsTable": false,
"avg": false,
"current": true,
"hideEmpty": false,
"max": true,
"min": false,
"rightSide": false,
"show": true,
"total": false,
"values": true
},
"lines": true,
"linewidth": 1,
"links": [],
"nullPointMode": "null",
"paceLength": 10,
"percentage": false,
"pointradius": 2,
"points": false,
"renderer": "flot",
"seriesOverrides": [],
"stack": false,
"steppedLine": false,
"targets": [
{
"expr": "pg_stat_connetion_count",
"format": "time_series",
"intervalFactor": 1,
"legendFormat": "{{state}}",
"refId": "A"
}
],
"thresholds": [],
"timeFrom": null,
"timeRegions": [],
"timeShift": null,
"title": "PostgreSQL Current Sessions",
"tooltip": {
"shared": true,
"sort": 0,
"value_type": "individual"
},
"type": "graph",
"xaxis": {
"buckets": null,
"mode": "time",
"name": null,
"show": true,
"values": []
},
"yaxes": [
{
"decimals": 0,
"format": "none",
"label": null,
"logBase": 1,
"max": null,
"min": null,
"show": true
},
{
"format": "short",
"label": null,
"logBase": 1,
"max": null,
"min": null,
"show": true
}
],
"yaxis": {
"align": false,
"alignLevel": null
}
},
{
"aliasColors": {},
"bars": false,
"dashLength": 10,
"dashes": false,
"datasource": "${DS_DEV_PROMETHEUS}",
"decimals": null,
"fill": 1,
"gridPos": {
"h": 7,
"w": 6,
"x": 12,
"y": 18
},
"id": 37,
"legend": {
"alignAsTable": false,
"avg": false,
"current": true,
"hideEmpty": false,
"max": true,
"min": false,
"rightSide": false,
"show": true,
"total": false,
"values": true
},
"lines": true,
"linewidth": 1,
"links": [],
"nullPointMode": "null",
"paceLength": 10,
"percentage": false,
"pointradius": 2,
"points": false,
"renderer": "flot",
"seriesOverrides": [],
"stack": false,
"steppedLine": false,
"targets": [
{
"expr": "pg_locks_count{instance=\"$database\",datname!~\"template0|template1|\"} !=0",
"format": "time_series",
"intervalFactor": 1,
"legendFormat": "{{datname}}/{{mode}}",
"refId": "A"
}
],
"thresholds": [],
"timeFrom": null,
"timeRegions": [],
"timeShift": null,
"title": "PostgreSQL Table Locks",
"tooltip": {
"shared": true,
"sort": 0,
"value_type": "individual"
},
"type": "graph",
"xaxis": {
"buckets": null,
"mode": "time",
"name": null,
"show": true,
"values": []
},
"yaxes": [
{
"decimals": 0,
"format": "none",
"label": null,
"logBase": 1,
"max": null,
"min": null,
"show": true
},
{
"format": "short",
"label": null,
"logBase": 1,
"max": null,
"min": null,
"show": true
}
],
"yaxis": {
"align": false,
"alignLevel": null
}
},
{
"aliasColors": {},
"bars": false,
"dashLength": 10,
"dashes": false,
"datasource": "${DS_DEV_PROMETHEUS}",
"decimals": null,
"fill": 1,
"gridPos": {
"h": 7,
"w": 6,
"x": 18,
"y": 18
},
"id": 38,
"legend": {
"alignAsTable": false,
"avg": false,
"current": true,
"hideEmpty": false,
"max": true,
"min": false,
"rightSide": false,
"show": true,
"total": false,
"values": true
},
"lines": true,
"linewidth": 1,
"links": [],
"nullPointMode": "null",
"paceLength": 10,
"percentage": false,
"pointradius": 2,
"points": false,
"renderer": "flot",
"seriesOverrides": [],
"stack": false,
"steppedLine": false,
"targets": [
{
"expr": "irate(pg_stat_database_deadlocks{instance=\"$database\",datname!~\"postgres|template0|template1\"}[5m])",
"format": "time_series",
"intervalFactor": 1,
"legendFormat": "{{datname}}.deadlocks",
"refId": "A"
}
],
"thresholds": [],
"timeFrom": null,
"timeRegions": [],
"timeShift": null,
"title": "PostgreSQL Deadlocks",
"tooltip": {
"shared": true,
"sort": 0,
"value_type": "individual"
},
"type": "graph",
"xaxis": {
"buckets": null,
"mode": "time",
"name": null,
"show": true,
"values": []
},
"yaxes": [
{
"decimals": 0,
"format": "none",
"label": null,
"logBase": 1,
"max": null,
"min": null,
"show": true
},
{
"format": "short",
"label": null,
"logBase": 1,
"max": null,
"min": null,
"show": true
}
],
"yaxis": {
"align": false,
"alignLevel": null
}
},
{
"aliasColors": {},
"bars": false,
"dashLength": 10,
"dashes": false,
"datasource": "${DS_DEV_PROMETHEUS}",
"decimals": null,
"fill": 1,
"gridPos": {
"h": 7,
"w": 6,
"x": 0,
"y": 25
},
"id": 39,
"legend": {
"alignAsTable": false,
"avg": false,
"current": true,
"hideEmpty": false,
"max": false,
"min": false,
"rightSide": false,
"show": true,
"total": false,
"values": true
},
"lines": true,
"linewidth": 1,
"links": [],
"nullPointMode": "null",
"paceLength": 10,
"percentage": false,
"pointradius": 2,
"points": false,
"renderer": "flot",
"seriesOverrides": [],
"stack": false,
"steppedLine": false,
"targets": [
{
"expr": "pg_stat_long_runtime{instance=\"$database\"}",
"format": "time_series",
"intervalFactor": 1,
"legendFormat": "PID: {{pid}}",
"refId": "A"
}
],
"thresholds": [],
"timeFrom": null,
"timeRegions": [],
"timeShift": null,
"title": "PostgreSQL Deadlocks",
"tooltip": {
"shared": true,
"sort": 0,
"value_type": "individual"
},
"type": "graph",
"xaxis": {
"buckets": null,
"mode": "time",
"name": null,
"show": true,
"values": []
},
"yaxes": [
{
"decimals": 0,
"format": "dtdurations",
"label": null,
"logBase": 1,
"max": null,
"min": null,
"show": true
},
{
"format": "short",
"label": null,
"logBase": 1,
"max": null,
"min": null,
"show": true
}
],
"yaxis": {
"align": false,
"alignLevel": null
}
},
{
"aliasColors": {},
"bars": false,
"dashLength": 10,
"dashes": false,
"datasource": "${DS_DEV_PROMETHEUS}",
"decimals": null,
"fill": 1,
"gridPos": {
"h": 7,
"w": 6,
"x": 6,
"y": 25
},
"id": 40,
"legend": {
"alignAsTable": false,
"avg": false,
"current": true,
"hideEmpty": false,
"max": false,
"min": false,
"rightSide": false,
"show": true,
"total": false,
"values": true
},
"lines": true,
"linewidth": 1,
"links": [],
"nullPointMode": "null",
"paceLength": 10,
"percentage": false,
"pointradius": 2,
"points": false,
"renderer": "flot",
"seriesOverrides": [],
"stack": false,
"steppedLine": false,
"targets": [
{
"expr": "pg_stat_database_tup_updated{instance=\"$database\",datname!~\"postgres|template0|template1\"}",
"format": "time_series",
"intervalFactor": 1,
"legendFormat": "{{datname}}",
"refId": "A"
}
],
"thresholds": [],
"timeFrom": null,
"timeRegions": [],
"timeShift": null,
"title": "Tuple Updated",
"tooltip": {
"shared": true,
"sort": 0,
"value_type": "individual"
},
"type": "graph",
"xaxis": {
"buckets": null,
"mode": "time",
"name": null,
"show": true,
"values": []
},
"yaxes": [
{
"decimals": 0,
"format": "bytes",
"label": null,
"logBase": 1,
"max": null,
"min": null,
"show": true
},
{
"format": "short",
"label": null,
"logBase": 1,
"max": null,
"min": null,
"show": true
}
],
"yaxis": {
"align": false,
"alignLevel": null
}
},
{
"aliasColors": {},
"bars": false,
"dashLength": 10,
"dashes": false,
"datasource": "${DS_DEV_PROMETHEUS}",
"decimals": null,
"fill": 1,
"gridPos": {
"h": 7,
"w": 6,
"x": 12,
"y": 25
},
"id": 41,
"legend": {
"alignAsTable": false,
"avg": false,
"current": true,
"hideEmpty": false,
"max": false,
"min": false,
"rightSide": false,
"show": true,
"total": false,
"values": true
},
"lines": true,
"linewidth": 1,
"links": [],
"nullPointMode": "null",
"paceLength": 10,
"percentage": false,
"pointradius": 2,
"points": false,
"renderer": "flot",
"seriesOverrides": [],
"stack": false,
"steppedLine": false,
"targets": [
{
"expr": "pg_stat_database_tup_deleted{instance=\"$database\",datname!~\"postgres|template0|template1\"}",
"format": "time_series",
"intervalFactor": 1,
"legendFormat": "{{datname}}",
"refId": "A"
}
],
"thresholds": [],
"timeFrom": null,
"timeRegions": [],
"timeShift": null,
"title": "Tuple Deleted",
"tooltip": {
"shared": true,
"sort": 0,
"value_type": "individual"
},
"type": "graph",
"xaxis": {
"buckets": null,
"mode": "time",
"name": null,
"show": true,
"values": []
},
"yaxes": [
{
"decimals": 0,
"format": "bytes",
"label": null,
"logBase": 1,
"max": null,
"min": null,
"show": true
},
{
"format": "short",
"label": null,
"logBase": 1,
"max": null,
"min": null,
"show": true
}
],
"yaxis": {
"align": false,
"alignLevel": null
}
},
{
"aliasColors": {},
"bars": false,
"dashLength": 10,
"dashes": false,
"datasource": "${DS_DEV_PROMETHEUS}",
"decimals": null,
"fill": 1,
"gridPos": {
"h": 7,
"w": 6,
"x": 18,
"y": 25
},
"id": 42,
"legend": {
"alignAsTable": false,
"avg": false,
"current": true,
"hideEmpty": false,
"max": false,
"min": false,
"rightSide": false,
"show": true,
"total": false,
"values": true
},
"lines": true,
"linewidth": 1,
"links": [],
"nullPointMode": "null",
"paceLength": 10,
"percentage": false,
"pointradius": 2,
"points": false,
"renderer": "flot",
"seriesOverrides": [],
"stack": false,
"steppedLine": false,
"targets": [
{
"expr": "pg_stat_database_tup_inserted{instance=\"$database\",datname!~\"postgres|template0|template1\"}",
"format": "time_series",
"intervalFactor": 1,
"legendFormat": "{{datname}}",
"refId": "A"
}
],
"thresholds": [],
"timeFrom": null,
"timeRegions": [],
"timeShift": null,
"title": "Tuple Inserted",
"tooltip": {
"shared": true,
"sort": 0,
"value_type": "individual"
},
"type": "graph",
"xaxis": {
"buckets": null,
"mode": "time",
"name": null,
"show": true,
"values": []
},
"yaxes": [
{
"decimals": 0,
"format": "bytes",
"label": null,
"logBase": 1,
"max": null,
"min": null,
"show": true
},
{
"format": "short",
"label": null,
"logBase": 1,
"max": null,
"min": null,
"show": true
}
],
"yaxis": {
"align": false,
"alignLevel": null
}
},
{
"aliasColors": {},
"bars": false,
"dashLength": 10,
"dashes": false,
"datasource": "${DS_DEV_PROMETHEUS}",
"decimals": null,
"fill": 1,
"gridPos": {
"h": 8,
"w": 12,
"x": 0,
"y": 32
},
"id": 43,
"legend": {
"alignAsTable": false,
"avg": false,
"current": true,
"hideEmpty": false,
"max": false,
"min": false,
"rightSide": false,
"show": true,
"total": false,
"values": true
},
"lines": true,
"linewidth": 1,
"links": [],
"nullPointMode": "null",
"paceLength": 10,
"percentage": false,
"pointradius": 2,
"points": false,
"renderer": "flot",
"seriesOverrides": [],
"stack": false,
"steppedLine": false,
"targets": [
{
"expr": "pg_stat_database_blks_hit{instance=\"$database\",datname!~\"postgres|template0|template1\"}/(pg_stat_database_blks_read{instance=\"$database\",datname!~\"postgres|template0|template1\"}+pg_stat_database_blks_hit{instance=\"$database\",datname!~\"postgres|template0|template1\"})",
"format": "time_series",
"intervalFactor": 1,
"legendFormat": "{{datname}}",
"refId": "A"
}
],
"thresholds": [],
"timeFrom": null,
"timeRegions": [],
"timeShift": null,
"title": "Cache Hit Rate",
"tooltip": {
"shared": true,
"sort": 0,
"value_type": "individual"
},
"type": "graph",
"xaxis": {
"buckets": null,
"mode": "time",
"name": null,
"show": true,
"values": []
},
"yaxes": [
{
"decimals": 0,
"format": "percentunit",
"label": null,
"logBase": 1,
"max": null,
"min": null,
"show": true
},
{
"format": "short",
"label": null,
"logBase": 1,
"max": null,
"min": null,
"show": true
}
],
"yaxis": {
"align": false,
"alignLevel": null
}
},
{
"aliasColors": {},
"bars": false,
"dashLength": 10,
"dashes": false,
"datasource": "${DS_DEV_PROMETHEUS}",
"decimals": null,
"fill": 1,
"gridPos": {
"h": 8,
"w": 12,
"x": 12,
"y": 32
},
"id": 44,
"legend": {
"alignAsTable": false,
"avg": true,
"current": true,
"hideEmpty": false,
"max": false,
"min": false,
"rightSide": false,
"show": true,
"total": false,
"values": true
},
"lines": true,
"linewidth": 1,
"links": [],
"nullPointMode": "null",
"paceLength": 10,
"percentage": false,
"pointradius": 2,
"points": false,
"renderer": "flot",
"seriesOverrides": [],
"stack": false,
"steppedLine": false,
"targets": [
{
"expr": "irate(pg_stat_bgwriter_checkpoint_sync_time{instance=\"$database\"}[5m])",
"format": "time_series",
"intervalFactor": 1,
"legendFormat": "checkpoint_sync_time",
"refId": "A"
},
{
"expr": "irate(pg_stat_bgwriter_checkpoint_write_time{instance=\"$database\"}[5m])",
"format": "time_series",
"intervalFactor": 1,
"legendFormat": "checkpoint_write_time",
"refId": "B"
}
],
"thresholds": [],
"timeFrom": null,
"timeRegions": [],
"timeShift": null,
"title": "Checkpoint Stats",
"tooltip": {
"shared": true,
"sort": 0,
"value_type": "individual"
},
"type": "graph",
"xaxis": {
"buckets": null,
"mode": "time",
"name": null,
"show": true,
"values": []
},
"yaxes": [
{
"decimals": 0,
"format": "ms",
"label": null,
"logBase": 1,
"max": null,
"min": null,
"show": true
},
{
"format": "short",
"label": null,
"logBase": 1,
"max": null,
"min": null,
"show": true
}
],
"yaxis": {
"align": false,
"alignLevel": null
}
}
],
"schemaVersion": 18,
"style": "dark",
"tags": [],
"templating": {
"list": [
{
"allValue": null,
"current": {},
"datasource": "${DS_DEV_PROMETHEUS}",
"definition": "node_boot_time_seconds",
"hide": 0,
"includeAll": false,
"label": "Server",
"multi": false,
"name": "server",
"options": [],
"query": "node_boot_time_seconds",
"refresh": 1,
"regex": "/.*instance=\"([^\"]*).*/",
"skipUrlSync": false,
"sort": 0,
"tagValuesQuery": "",
"tags": [],
"tagsQuery": "",
"type": "query",
"useTags": false
},
{
"allValue": null,
"current": {},
"datasource": "${DS_DEV_PROMETHEUS}",
"definition": "pg_static",
"hide": 0,
"includeAll": false,
"label": "Database",
"multi": false,
"name": "database",
"options": [],
"query": "pg_static",
"refresh": 1,
"regex": "/.*instance=\"([^\"]*).*/",
"skipUrlSync": false,
"sort": 0,
"tagValuesQuery": "",
"tags": [],
"tagsQuery": "",
"type": "query",
"useTags": false
}
]
},
"time": {
"from": "now-6h",
"to": "now"
},
"timepicker": {
"refresh_intervals": [
"5s",
"10s",
"30s",
"1m",
"5m",
"15m",
"30m",
"1h",
"2h",
"1d"
],
"time_options": [
"5m",
"15m",
"1h",
"6h",
"12h",
"24h",
"2d",
"7d",
"30d"
]
},
"timezone": "",
"title": "PostgreSQL Database",
"uid": "XfxdINqiz",
"version": 56
}
Grafana + Prometheus 监控PostgreSQL的更多相关文章
- Grafana+Prometheus 监控 MySQL
转自:Grafana+Prometheus 监控 MySQL 架构图 环境 IP 环境 需装软件 192.168.0.237 mysql-5.7.20 node_exporter-0.15.2.lin ...
- 使用 Docker 部署 Grafana + Prometheus 监控 MySQL 数据库
一.背景 在平时开发过程当中需要针对 MySQL 数据库进行监控,这里我们可以使用 Grafana 和 Prometheus 来实现监控功能.Grafana 是一款功能强大的仪表盘面板,支持多种数据源 ...
- Grafana+Prometheus监控mysql性能
#cmd /usr/local 今天讲一下如何监控服务器中的mysql数据库的性能 一.数据库操作 1.mysql启动 #service mysqld start #启动数据库 #service my ...
- Grafana+Prometheus监控
添加模板一定要看说明以及依赖 监控redis https://blog.52itstyle.com/archives/2049/ http://www.cnblogs.com/sfnz/p/65669 ...
- Grafana Prometheus系统监控Redis服务
Grafana Prometheus系统监控Redis服务 一.Grafana Prometheus系统监控Redis服务 1.1流程 1.2安装redis_exporter 1.3配置prometh ...
- Grafana+Prometheus系统监控之MySql
架构 grafana和prometheus之前安装配置过,见:Grafana+Prometheus打造全方位立体监控系统 MySql安装 MySql的地位和重要性就不言而喻了,作为开源产品深受广大中小 ...
- Grafana+Prometheus系统监控之SpringBoot
前言 前一段时间使用SpringBoot创建了一个webhook项目,由于近期项目中也使用了不少SpringBoot相关的项目,趁着周末,配置一下使用prometheus监控微服务Springboot ...
- Grafana+Prometheus系统监控之webhook
概述 Webhook是一个API概念,并且变得越来越流行.我们能用事件描述的事物越多,webhook的作用范围也就越大.Webhook作为一个轻量的事件处理应用,正变得越来越有用. 准确的说webho ...
- Grafana+Prometheus打造全方位立体监控系统
前言 本文主要介绍如何使用Grafana和Prometheus以及node_exporter对Linux服务器性能进行监控.下面两张图分别是两台服务器监控信息: 服务器A 服务器B 概述 Promet ...
随机推荐
- docker+httpd的安装
docker pull docker.io/httpd //直接这么运行会报“没有conf/httpd.cong这个文件” docker run -d --name httpd2. -p : -p : ...
- 搭建sftp
参考:https://www.cnblogs.com/heyanan/p/8178480.html 需要注意两点:1.链接时候选择sftp不要选择ftp 2.目录权限严格按照参考文章设置
- CSS中list-style详解
取消默认的圆点和序号可以这样写list-style:none;, list的属性如下: list-style-type:square;//正方形 list-style-position:inside; ...
- python if 和 else
money = input("请输入你在学校有多少钱?")if int(money) > 5000: print("这个月可以潇洒潇洒了,每天可以出去吃大餐了.&q ...
- 20165321 测试-3-ch02
- WIN7虚拟桌面创建(多屏幕多桌面)
Windows7/WIN7虚拟桌面怎么用怎么创建多桌面(摘录) 在使用电脑中经常会遇到桌面软件太多了不够用的感慨,那么要是一台电脑有多个桌面就好了.在windows10中自带已经支持了虚拟桌面,在wi ...
- 微信小程序scroll-view不能实现下拉刷新
一般在列表展示页面,会使用到上拉加载和下拉刷新功能,在scroll-view中有bindscrolltolower事件,可以实现上拉加载功能,但是却没法实现下拉刷新. 如需同时使用两种功能,解决步骤如 ...
- 用mpvue构建微信小程序
背景 由于机器人协会进行鼓励大家多读书的活动,所以为了可以更好的.更有效果,所以我跟会长提了一个建议,做一个微信小程序,那么为什么是微信小程序呢? 1.现在微信小程序比较好,用户也比较多:利用微信小程 ...
- 2019最新WEB前端开发小白必看的学习路线(附学习视频教程)
2019最新WEB前端开发小白必看的学习路线(附学习视频教程).web前端自学之路:史上最全web学习路线,HTML5是万维网的核心语言,标准通用标记语言下的一个应用超文本标记语言(HTML)的第五次 ...
- VMware中为Linux安装vm-tools
1.虚拟机中选择安装VMware-tools,或者重新安装 2.在/mnt目录下建立cdrom文件夹 mkdir /mnt.cdrom 3.把/dev/cdrom光驱挂载到刚才建的文件夹上 mount ...