Prometheus 监控Docker服务器及Granfanna可视化
Prometheus 监控Docker服务器及Granfanna可视化
cAdvisor(Container Advisor)用于收集正在运行的容器资源使用和性能信息。
使用Prometheus监控cAdvisor
cAdvisor将容器统计信息公开为Prometheus指标。
默认情况下,这些指标在/metrics HTTP端点下提供。
可以通过设置-prometheus_endpoint命令行标志来自定义此端点。
要使用Prometheus监控cAdvisor,只需在Prometheus中配置一个或多个作业,这些作业会在该指标端点处刮取相关的cAdvisor流程。
- 使用文档:https://github.com/google/cadvisor
- 图表模板:https://grafana.com/dashboards/193
运行单个cAdvisor来监控整个Docker主机
1、被监控端安装完Docker后,添加启动cAdvisor容器
docker run \

  --volume=/:/rootfs:ro \

  --volume=/var/run:/var/run:ro \

  --volume=/sys:/sys:ro \

  --volume=/var/lib/docker/:/var/lib/docker:ro \

  --volume=/dev/disk/:/dev/disk:ro \

  --publish=8080:8080 \

  --detach=true \

  --name=cadvisor \

  google/cadvisor:latest
2、修改Promethus监控端配置文件:vim prometheus.yml
scrape_configs:

  # 添加作业,自定义名称

  - job_name: 'docker'

    # 静态添加

    static_configs:

    # 指定监控实例

    - targets: ['47.98.138.176:8080']
3、检查并重新加载配置文件
./promtool check config prometheus.yml

kill -hup PID
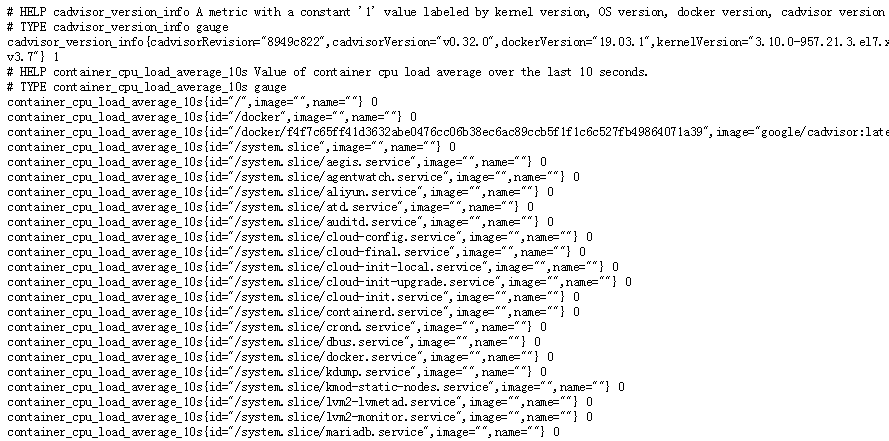
4、访问被监控端cAdvisor捕获的数据 :http://47.98.138.176:8080/metrics
5、Prometheus监控端查看是否介入
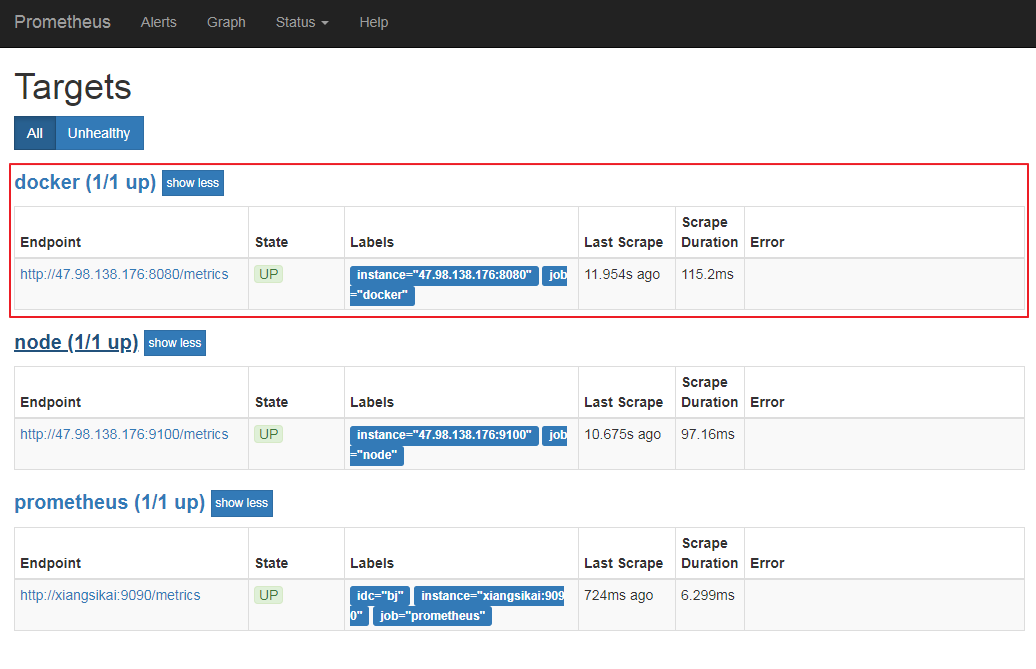
6、Prometheus监控端查docker数据
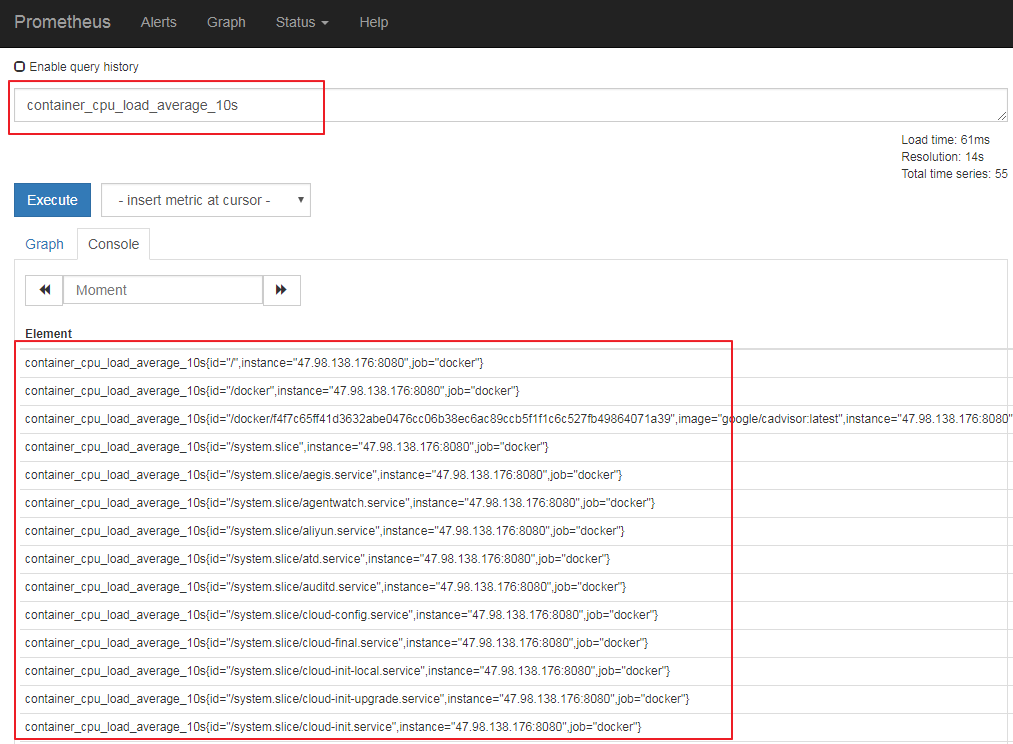
查看平均加载cpu10秒:container_cpu_load_average_10s
PromSQL
7、Granfana 导入 Docker 监控图表
- 推荐图标ID:https://grafana.com/dashboards/193
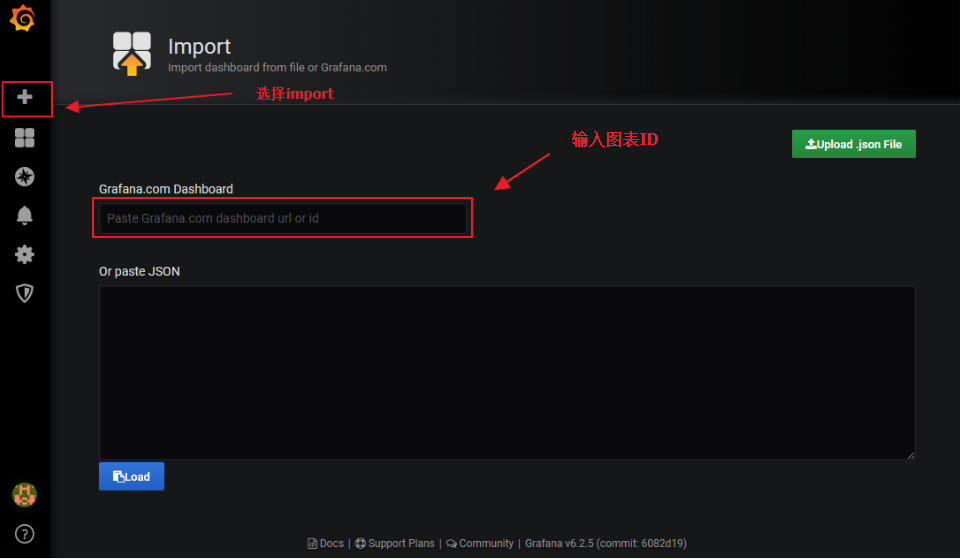
8、输入导入图标ID等待3秒弹出如下,修改后保存

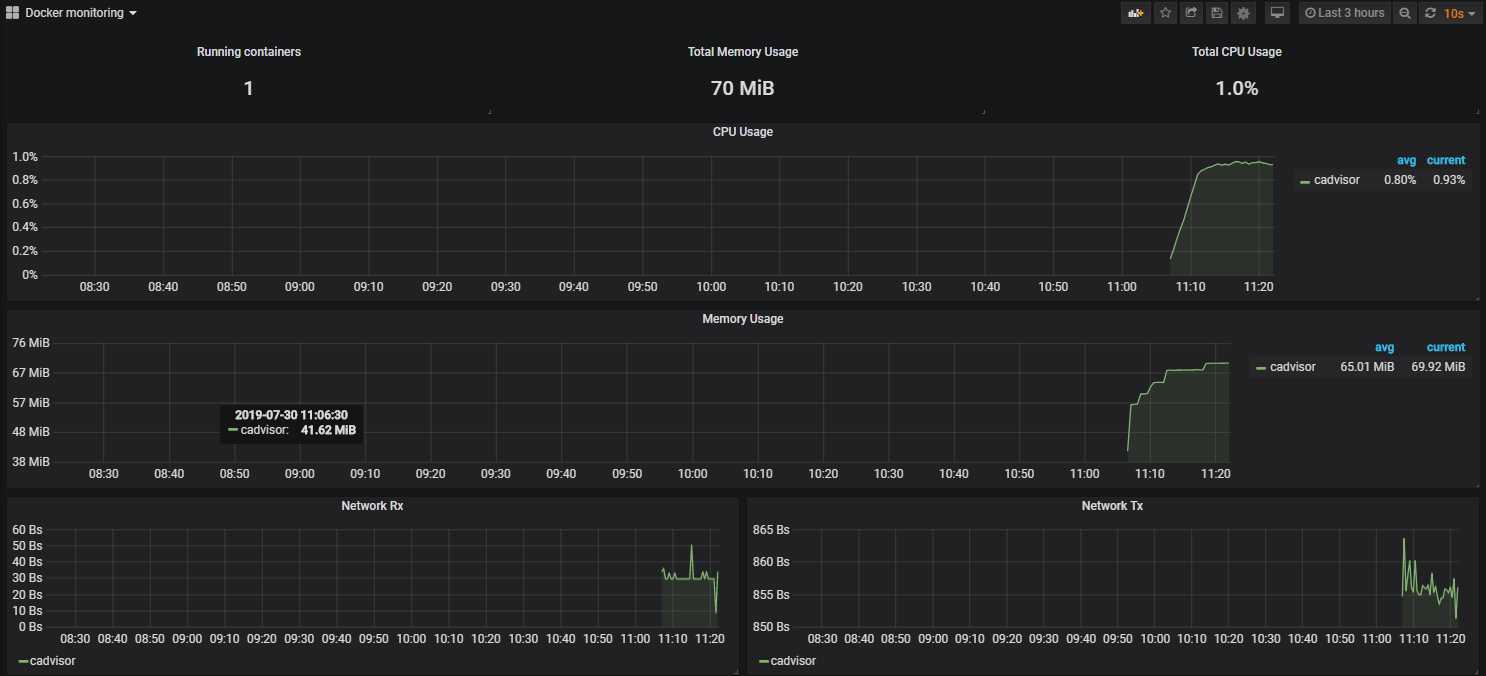
9、查看图标监控仪表盘
Prometheus 监控Docker服务器及Granfanna可视化的更多相关文章
- Prometheus 监控Mysql服务器及Grafana可视化
Prometheus 监控Mysql服务器及Grafana可视化. mysql_exporter:用于收集MySQL性能信息. 使用版本 mysqld_exporter 0.11.0 官方地址 使用文 ...
- Prometheus 监控linux服务器
Prometheus 监控linux服务器 node_exporter:用于*NIX系统监控,使用Go语言编写的收集器. 使用版本 node_exporter 0.17.0 相关文档 使用文档:htt ...
- Prometheus监控Docker Swarm集群(一)
Prometheus监控Docker Swarm集群(一) cAdvisor简介 为了解决容器的监控问题,Google开发了一款容器监控工具cAdvisor(Container Advisor),它为 ...
- Grafana连接Prometheus监控Docker平台
Grafana是一款开源的分析平台. Grafana allows you to query, visualize, alert on and understand your metrics no m ...
- Prometheus入门到放弃(4)之cadvisor监控docker容器
Prometheus监控docker容器运行状态,我们用到cadvisor服务,cadvisor我们这里也采用docker方式直接运行. 1.下载镜像 [root@prometheus-server ...
- prometheus监控(小试牛刀)
prometheus监控(小试牛刀) 环境:全部服务都是基于docker运行 本文略微草率,好文章在这里,特别好如下: https://www.cnblogs.com/tchua/p/11120228 ...
- 6. 使用cadvisor监控docker容器
Prometheus监控docker容器运行状态,我们用到cadvisor服务,cadvisor我们这里也采用docker方式直接运行.这里我们可以服务端和客户端都使用cadvisor 客户端 1.下 ...
- cAdvisor+Prometheus+Grafana监控docker
cAdvisor+Prometheus+Grafana监控docker 一.cAdvisor(需要监控的主机都要安装) 官方地址:https://github.com/google/cadvisor ...
- Prometheus+Grafana 监控 Docker
cAdvisor (Container Advisor) :用于收集正在运行的容器资源使用和性能信息. https://github.com/google/cadvisor Prometheus(普罗 ...
随机推荐
- vue-router 在项目中的使用
一.下载vue-router npm install vue-router --save 二.编码 1.在项目中新建文件夹 router/index.js /* * 路由对象模块 * */ impor ...
- 如何搭建wordpress ,wecenter
14.什么是LNMP架构 LNMP是指一组通常一起使用来运行动态网站或者服务器的自由软件名称首字母缩写.L指Linux,N指Nginx,M一般指MySQL,也可以指MariaDB,P一般指PHP,也可 ...
- Linux中断管理 (1)Linux中断管理机制【转】
转自:https://www.cnblogs.com/arnoldlu/p/8659981.html 目录: <Linux中断管理> <Linux中断管理 (1)Linux中断管理机 ...
- centos6.5 yum搭建安装linux+apache+mysql+php环境
一.脚本YUM源安装: 1.yum install wget #安装下载工具wget2.wget ...
- Rust中的Cargo工作空间实践
这是为了开发大型程序,分治crate用的. 目录结构如下: 一,根cargo.toml内容 [workspace] members = [ "adder", "add-o ...
- 在Ubuntu下使用nginx-rtmp-module搭建直播系统
直播系统最简单地包括推流和拉流,在这里先使用nginx-rtmp-module作为流媒体服务器. 流媒体服务器搭建 1. nginx-rtmp-module下载和安装 源码地址:https://git ...
- 解析YAML文件
YamlMapFactoryBean yamlMapFactoryBean = new YamlMapFactoryBean(); yamlMapFactoryBean.setResources(ne ...
- 201871010136-赵艳强《面向对象程序设计(java)》第十五周学习总结
201871010136-赵艳强<面向对象程序设计JAVA>第十五周实验总结 项目 内容 这个作业属于哪个课程 https://www.cnblogs.com/nwnu-daizh 这 ...
- Spring Cloud Alibaba Sentinel 的配置选项:spring.cloud.sentinel.transport.port,默认值:8719
spring.cloud.sentinel.transport.port 端口配置会在应用对应的机器上启动一个 Http Server,该 Server 会与 Sentinel 控制台做交互.比如 S ...
- CentOS7 部署nfs服务
参考博客 参考博客 https://blog.51cto.com/addam/1576144 错误1: 客户端挂载nfs报错mount: wrong fs type, bad option, bad ...