(转)Arcgis for Js之Graphiclayer扩展详解
http://blog.csdn.net/gisshixisheng/article/details/41208185
在前两节,讲到了两种不同方式的聚类,一种是基于距离的,一种是基于区域范围的,两种不同的聚类都是通过扩展esri/layers/GraphicsLayer方法来实现的。在本节,就详细的讲讲esri/layers/GraphicsLayer方法的扩展。
首先,在讲解扩展之前,先看看API中esri/layers/GraphicsLayer的一些参数和方法等。
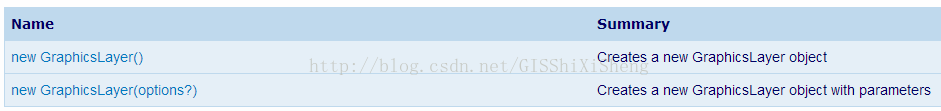
1、创建一个GraphicLayer
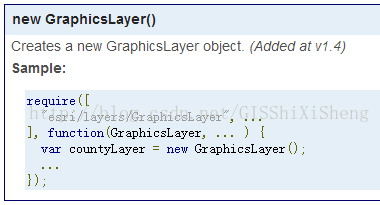
在ESRI官方的API中,创建GraphicLayer有两种方式:
例如:
或者:
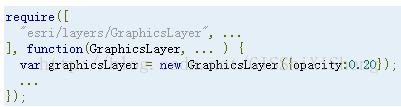
在第二种方式的options的参数包括:

2、GraphicLayer的属性
GraphicLayer的属性包括:

其中,有几个比较常见和重要的属性为:
a、graphics:数组,返回的参数是一个数组,为GraphicLayer中包含的Graphic对象。
b、visiable:布尔型,Graphiclayer是否可见。
c、visiableAtMapScale:布尔型,在特定比例尺下的可见性。
3、Graphiclayer的方法
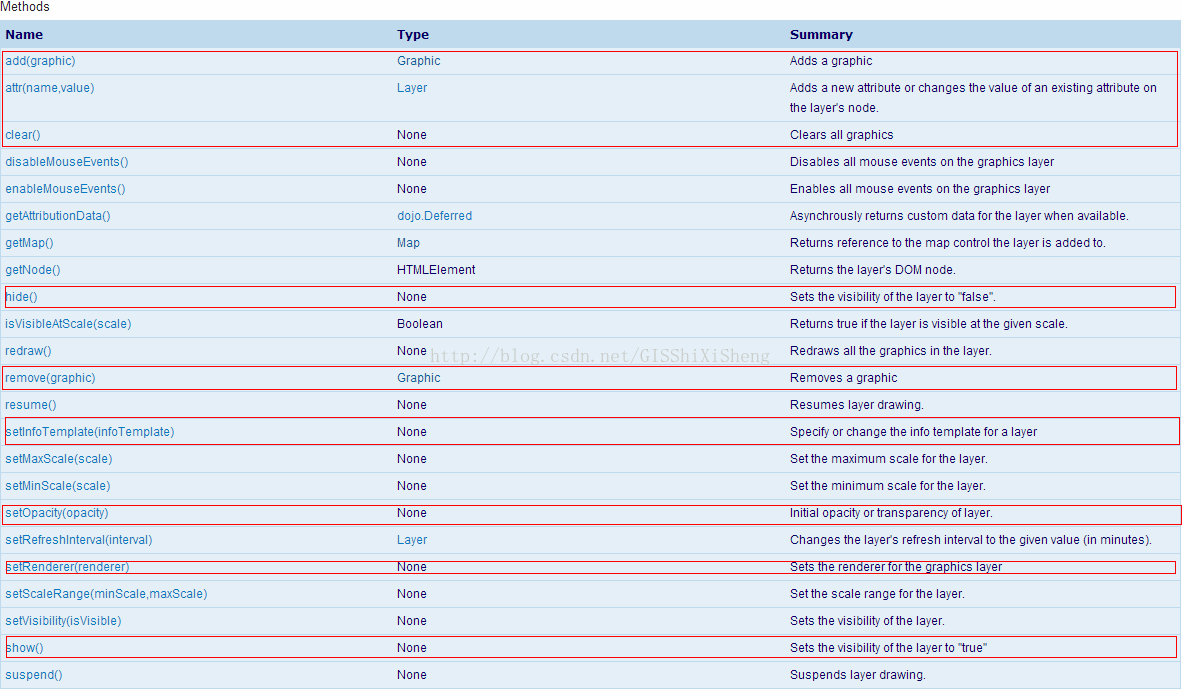
图中,红框标出的是Graphiclayer最常用的方法,详细的介绍很清楚,在此不再做赘述了。
接下来,扩展Graphiclayer。
GraphicLayer藏得很深,位于library\3.9\3.9\js\esri\layers\GraphicsLayer.js,虽然对参数变量代码做了混淆,但是有些东西还是没做变化。在做GraphicLayer扩展时,有几个是比较常用的:
a、_setMap
- // 重构esri/layers/GraphicsLayer方法
- _setMap: function(map, surface) {
- // GraphicsLayer will add its own listener here
- var div = this.inherited(arguments);
- return div;
- }
b、_unsetMap
- _unsetMap: function() {
- this.inherited(arguments);
- }
c、_draw
- _draw:function(graphic, redrawFlag, zoomFlag){
- if (!this._map) {
- return;
- }
- }
此外,还有一些地图控制的,如:_onPanStartHandler,_onZoomStartHandler,_onExtentChangeHandler等。扩展GraphicLayer的大概框架代码如下:
- define([
- "dojo/_base/declare",
- "esri/layers/GraphicsLayer"
- ], function (
- declare,
- GraphicsLayer
- ) {
- return declare([GraphicsLayer], {
- constructor: function(options) {
- //参数设置
- this._id = options.id || "";
- this._divId = options.chartDiv || "chart";
- },
- // 重构esri/layers/GraphicsLayer方法
- _setMap: function(map, surface) {
- // GraphicsLayer will add its own listener here
- var div = this.inherited(arguments);
- return div;
- },
- _unsetMap: function() {
- this.inherited(arguments);
- },
- //拖拽
- _onPanStartHandler: function() {
- //
- },
- //缩放
- _onZoomStartHandler:function(){
- //
- },
- _onExtentChangeHandler: function(delta, extent, levelChange, lod) {
- //
- },
- _draw:function(graphic){
- if (!this._map) {
- return;
- }
- //
- }
- });
- });
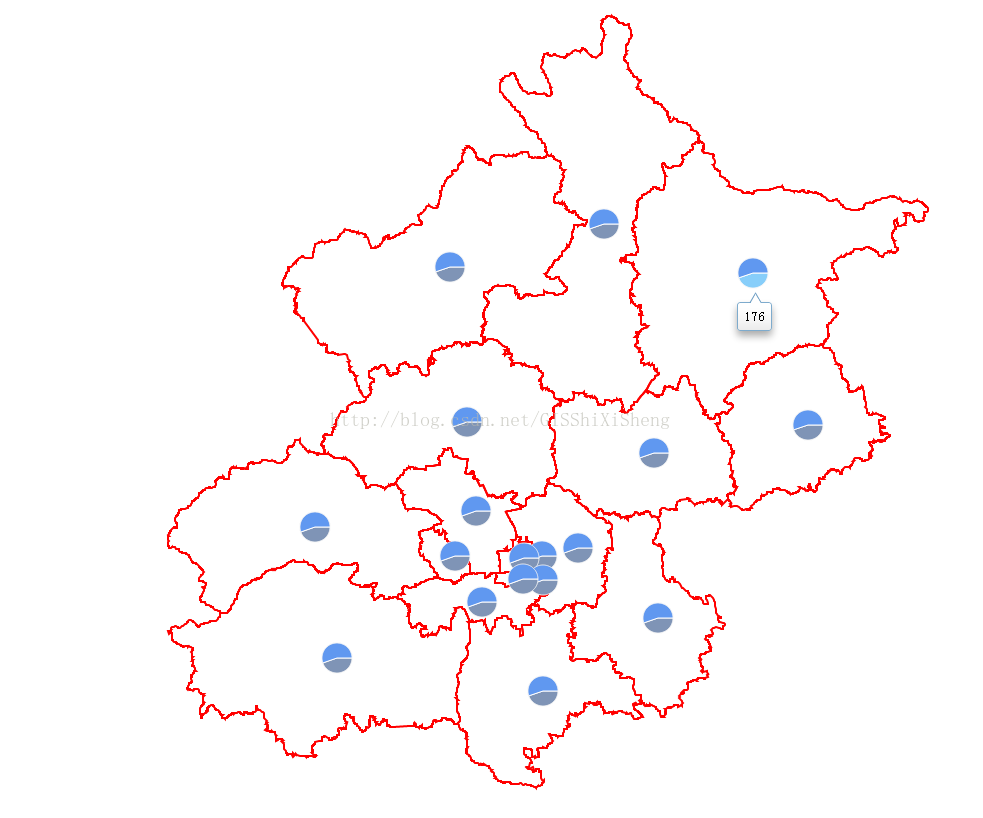
例子:添加统计图
统计图通过dojo chart实现,代码如下:
- define([
- "dojo/_base/declare",
- "esri/layers/GraphicsLayer",
- "esri/geometry/Point",
- "esri/graphic",
- "dojox/charting/Chart2D",
- "dojox/charting/themes/PlotKit/blue",
- "dojox/charting/action2d/Highlight",
- "dojox/charting/action2d/Tooltip"
- ], function (
- declare,
- GraphicsLayer,
- Point,
- Graphic,
- Chart2D,
- theme,
- Highlight,
- Tooltip
- ) {
- return declare([GraphicsLayer], {
- constructor: function(options) {
- this._id = options.id || "";
- this._divId = options.chartDiv || "chart";
- this._charttype = options.chartType || "Pie";
- this._chartSize = options.size || 50;
- },
- // 重构esri/layers/GraphicsLayer方法
- _setMap: function(map, surface) {
- // GraphicsLayer will add its own listener here
- var div = this.inherited(arguments);
- return div;
- },
- _unsetMap: function() {
- this.inherited(arguments);
- },
- hide: function() {
- dojo.style(dojo.byId(this._divId),{
- "display": "none"
- });
- },
- show: function() {
- dojo.style(dojo.byId(this._divId),{
- "display": ""
- });
- },
- //拖拽
- _onPanStartHandler: function() {
- this.hide();
- },
- //缩放
- _onZoomStartHandler:function(){
- this.hide();
- },
- _onExtentChangeHandler: function() {
- this._refresh(true);
- },
- _refresh: function(redraw) {
- var that=this;
- var gs = this.graphics,
- _draw = this._draw;
- for (i = 0; i < gs.length; i++) {
- _draw(gs[i], redraw);
- }
- this.show();
- },
- _draw:function(graphic, redraw){
- if (!this._map) {
- return;
- }
- if(graphic instanceof Graphic)//判断graphic是否为MapChartGraphic类型
- {
- this._drawChart(graphic,redraw);
- }
- },
- _drawChart:function(graphic,redraw){
- var showMapPt = graphic.geometry,
- attribute = graphic.attributes;
- var showPt = map.toScreen(showMapPt);
- var id=attribute.code,
- series = [attribute.male, attribute.female];
- if(redraw){
- dojo.byId(this._divId).removeChild(dojo.byId("div"+id));
- }
- if(attribute){
- var _chartDiv = dojo.doc.createElement("div");
- _chartDiv.id ="div"+id;
- dojo.style(_chartDiv, {
- "left": (showPt.x-this._chartSize/4) + "px",
- "top": (showPt.y-this._chartSize/2) + "px",
- "position": "absolute",
- "width": this._chartSize + "px",
- "height": this._chartSize + "px"
- });
- dojo.byId(this._divId).appendChild(_chartDiv);
- var _chart = new Chart2D(_chartDiv);
- var _themes = dojox.charting.themes.PlotKit.blue;
- _themes.chart.fill = "transparent";
- _themes.chart.stroke = "transparent";
- _themes.plotarea.fill = "transparent";
- _chart.setTheme(_themes);
- switch(this._charttype){
- case "Pie":{//饼状图
- _chart.addPlot("default", {
- type: this._charttype,
- labels:false
- });
- break;
- }
- case "StackedColumns":{//柱状堆积图
- _chart.addPlot("default", {
- type: this._charttype,
- labels:false,
- markers: true,
- gap: 2
- });
- break;
- }
- case "Lines":{//柱状堆积图
- _chart.addPlot("default", {
- type: this._charttype,
- labels:false,
- markers: true,
- radius: 1,
- tension:"X"
- });
- break;
- }
- default:{//柱状图
- _chart.addPlot("default", {
- type: this._charttype,
- labels:false,
- gap: 3
- });
- chart.addAxis("y", { vertical:true, fixLower: "major", fixUpper: "major" });
- break;
- }
- }
- _chart.addSeries(id, series,{stroke: {width:1}});
- //效果
- new Highlight(_chart, "default", {highlight: "lightskyblue"});
- new Tooltip(_chart, "default");
- _chart.render();
- }
- }
- });
- });
实现后的效果如下:
源码下载地址:
链接:http://pan.baidu.com/s/1i3EbnF3 密码:cvbf
(转)Arcgis for Js之Graphiclayer扩展详解的更多相关文章
- Arcgis for Js之Graphiclayer扩展详解
在前两节,讲到了两种不同方式的聚类,一种是基于距离的,一种是基于区域范围的,两种不同的聚类都是通过扩展esri/layers/GraphicsLayer方法来实现的.在本节,就详细的讲讲esri/la ...
- Arcgis for Js之Graphiclayer扩展具体解释
在前两节,讲到了两种不同方式的聚类,一种是基于距离的,一种是基于区域范围的,两种不同的聚类都是通过扩展esri/layers/GraphicsLayer方法来实现的.在本节,就具体的讲讲esri/la ...
- js调试工具Console命令详解
这篇文章主要介绍了js调试工具Console命令详解,需要的朋友可以参考下 一.显示信息的命令 复制代码 代码如下: < !DOCTYPE html> < html> &l ...
- JQ的offset().top与js的offsetTop区别详解
一.前言 最近在做一个图片懒加载的插件,就纵轴(Y轴)而言,我需要时时获取图片的上偏移量,好判断是否已进入视图区域,而我所理解的是offsetTop应该是跟offset().top一样的,然后陷入了因 ...
- Yii2 教程 - yii2-redis 扩展详解
该教程已被合并到<Yii2 权威指南中文版>中!Yiichina 教程地址为<yii2-redis 扩展详解>! 一.简介 yii2-redis 扩展为 Yii2 框架提供了 ...
- JQ的offset().top与JS的getBoundingClientRect区别详解,JS获取元素距离视窗顶部可变距离
壹 ❀ 引 我在 JQ的offset().top与js的offsetTop区别详解 这篇博客中详细分析了JQ方法offset().top与JS属性offsetTop的区别,并得出了一条offset( ...
- Arcgis for Js实现graphiclayer的空间查询
本节讲的是Arcgis for Js的针对graphiclayer的空间查询,内容很简单,代码如下: <!DOCTYPE html> <html> <head> & ...
- [js高手之路] es6系列教程 - 对象功能扩展详解
第一:字面量对象的方法,支持缩写形式 //es6之前,这么写 var User = { name : 'ghostwu', showName : function(){ return this.nam ...
- 【微信小程序项目实践总结】30分钟从陌生到熟悉 web app 、native app、hybrid app比较 30分钟ES6从陌生到熟悉 【原创】浅谈内存泄露 HTML5 五子棋 - JS/Canvas 游戏 meta 详解,html5 meta 标签日常设置 C#中回滚TransactionScope的使用方法和原理
[微信小程序项目实践总结]30分钟从陌生到熟悉 前言 我们之前对小程序做了基本学习: 1. 微信小程序开发07-列表页面怎么做 2. 微信小程序开发06-一个业务页面的完成 3. 微信小程序开发05- ...
随机推荐
- python supervisor进程监控工具的使用
supervisor —— a process control system 另外一个类似 supervisor的工具,因为supervisor 不兼容python3, !!! Circus Proc ...
- 架构师速成6.7-设计开发思路-uml
uml是什么东西?统一建模语言.一门语言.是用来进行软件设计的一门语言. 事实上一门语言的诞生并不伟大,让大多数人都使用才足够伟大. uml就是一门伟大的语言.由于眼下软件设计的唯一语言就是它. UM ...
- C#之选择排序
算法描述 1.假定未排序序列中第一位为数组最小值,通过与后面的数值进行比较,找到未排序序列中最小值,与未排序序列第一位交换位置: 2.重复步骤一,对剩余未排序序列进行比较找出最小值,与未排序序列中第一 ...
- hdu 5416 CRB and Tree(2015 Multi-University Training Contest 10)
CRB and Tree Time Limit: 8000/4000 MS (J ...
- adb 命令模拟按键事件 【转】
本文转载自:http://blog.sina.com.cn/s/blog_68f262210102vc1b.html 转自:http://blog.csdn.net/jlminghui/article ...
- Luogu3403跳楼机
https://zybuluo.com/ysner/note/1099616 题面 给你三个数\(x\),\(y\),\(z\),问你能够凑出多少个[1,\(h\)]之间的数. 解析 处理出\(y\) ...
- bzoj1008 [HNOI2008]越狱——快速幂
题目:https://www.lydsy.com/JudgeOnline/problem.php?id=1008 (这样一道水题还因为忘记写 %lld WA了那么多遍) 发生越狱的状态数,就是全部状态 ...
- bzoj1106
模拟+树状数组 先开始以为是先删距离最小的,这样可以减小上下的距离,然后觉得很难写,看码长很短,就看了题解,结果很奥妙 我们只考虑两种元素,就是如果像-a-b-a-b-这样的肯定得交换,如果像-a-b ...
- Sort List 典型链表
https://leetcode.com/problems/sort-list/ Sort a linked list in O(n log n) time using constant space ...
- go 学习成长之路
一.go的搭建 二.初识go 三.混个脸熟--go 四.go的语言结构 五.go的常量与变量 六.go基础数据类型 七.go 条件语句 八.go 运算符 九.go条件语句switch 十.go循环语句 ...