android studio 2.0 GPU Debugger使用说明
GPU Debugger
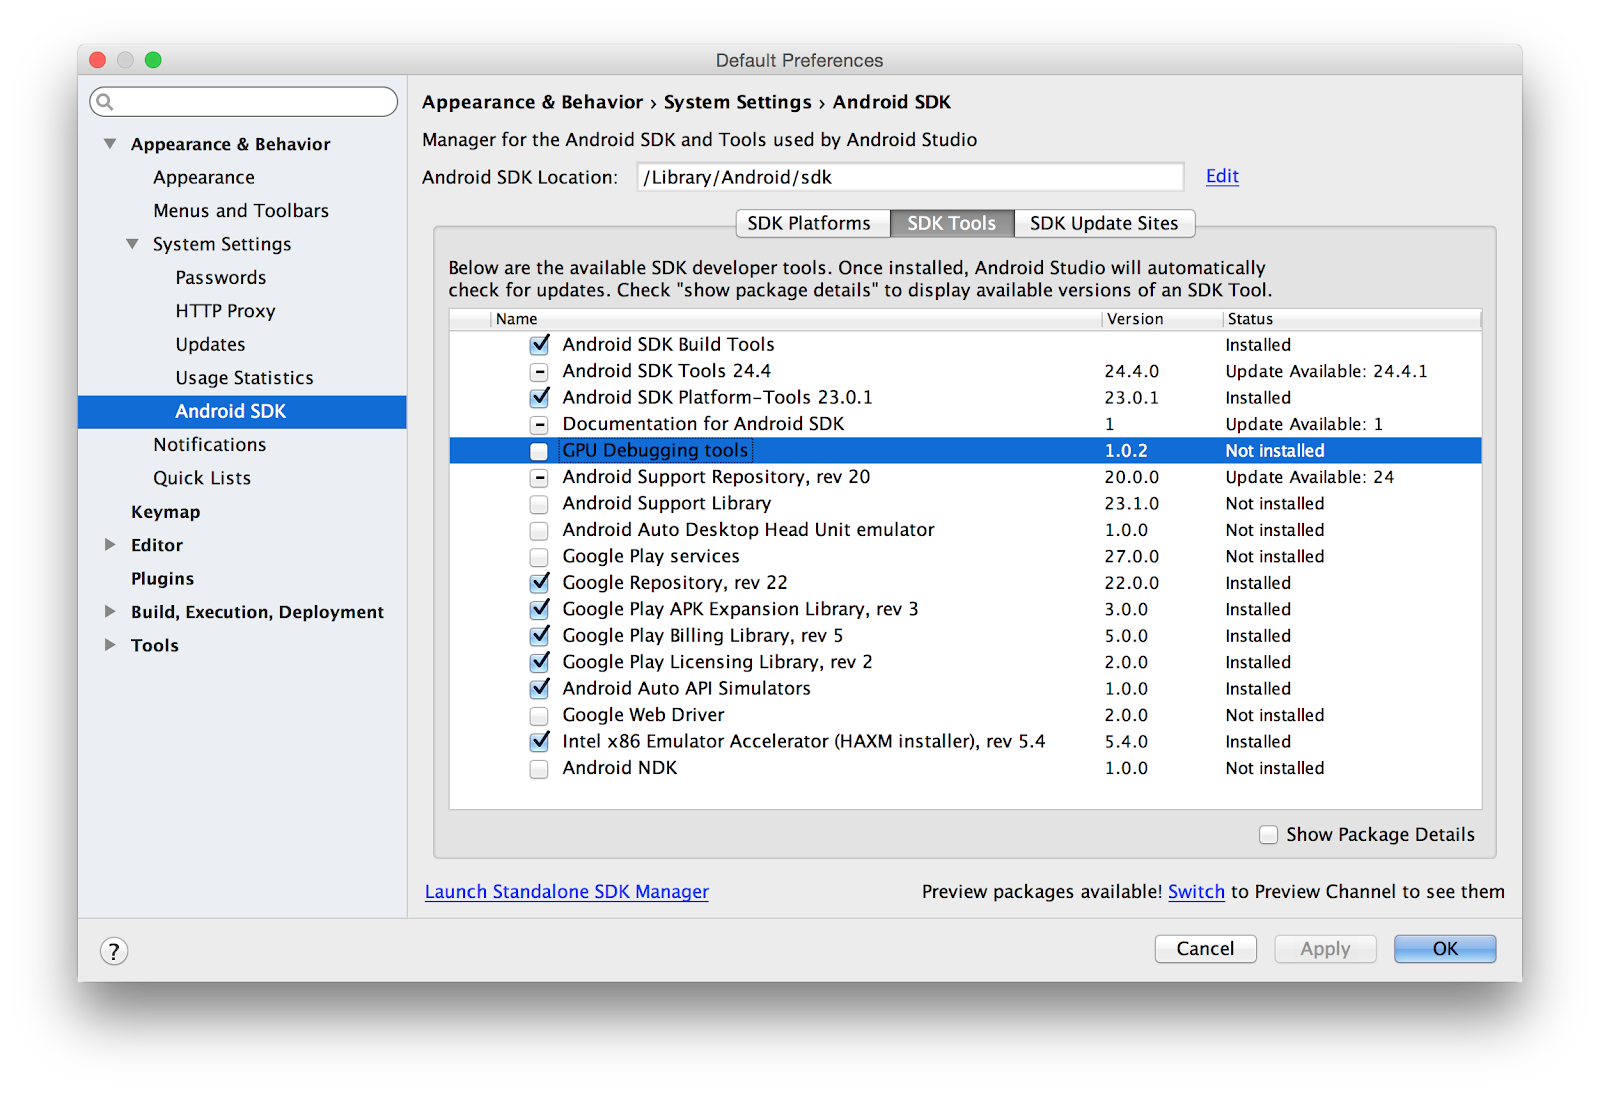
GPU Debugging ToolsThe GPU debugging tools are an experimental feature intended to help inspect GPU state and understand what caused a specific rendering outcome. Installing the GPU Debugging ToolsThe GPU Debugging Tools are not installed by default; you’ll need to add it before you can use it. You can find them in the SDK tools section of your SDK manager: Adding the trace library to your applicationIn order to use the profiler, you need to load the trace library in your application. The correct way to load the library depends on whether your code is C++ or Java. The library can be loaded via either method in a hybrid app. Regardless of which way you load the library, you first need to copy it into your project so that it can be loaded. The trace library will be located inside your SDK installation. You can find your SDK installation path location listed at the top of your SDK Manager. The libraries will be located in <sdkDir>/extras/android/gapid/android/<abi>/libgapii.so. You need to copy the relevant abi folders into your project’s jniLibs directory. This will be at <projectDir>/app/src/main/jniLibs. If it doesn’t already exist, you should create it. Like the SDK manager folder, jniLibs should contain one folder per ABI that you plan to support. If you don’t know which ABIs you plan to support, you can copy all of the folders. Your final project directory structure should look like <projectDir>/app/src/main/jniLibs/<abi>/libgappii.so. Loading the trace library in native codeTo load the trace library in native code, create a .cpp file containing this snippet:
Loading the trace library in Java codeTo load the trace library into Java code, insert this snippet into your main class:
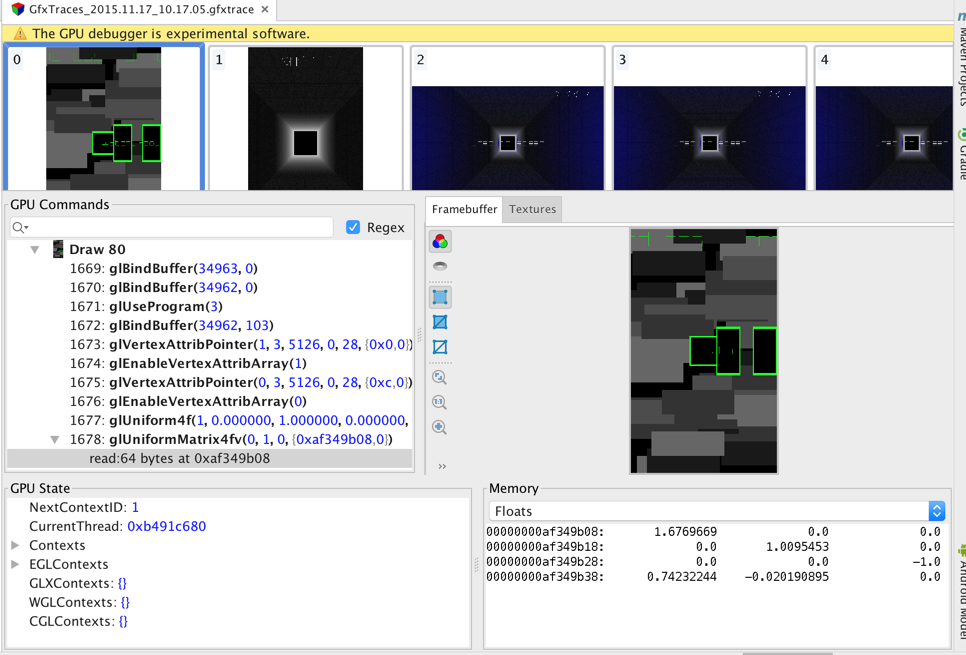
Running a traceNote that once you add the trace library, your application will block on startup until it can connect to the Android Studio trace receiver. This will render your application useless outside of debugging contexts, so be sure to remove the trace library from your application when you’re done with the profiler. To start a trace, deploy and run your app as normal. It should load with a blank screen while it waits for the trace receiver; to enable the receiver, go to the CPU/GPU tab of the Android Monitor. Click the red trace button on the left side of the GPU subtab: Once you begin tracing, your application should unblock and proceed as normal. As you interact with it, all GPU data will be captured by the trace. When you’re done capturing data, click the trace button again to stop the trace. As soon as the trace has finished being written to the file, it will be opened ready for inspection. Reading trace resultsTraces will be logged to a new captures folder inside your project. When you open a trace, the top bar of the UI will show the full sequence of logged frames. You can select an individual frame via either the top bar or the GPU commands panel; once you select a frame, the center right framebuffer window will update to show that frame’s contents. If you expand the frame on the lefthand GPU commands window, you’ll see the individual draw commands and GL calls that were used. If you click on a draw command, the framebuffer preview will be updated to reflect the contents as of that draw call. As applicable, the memory window in the lower right will also be updated to show relevant memory state at the time of the call. At any point, you can use the GPU State window or the Textures tab to explore relevant GPU state at the time of your selected frame or draw calls. If you run into issues, please help us improve the 2.0 release by logging bugs in our public Issues Tracker. You can create an issue via this link or by clicking on Help → Submit Feedback directly in Android Studio. |


android studio 2.0 GPU Debugger使用说明的更多相关文章
- Android Studio 3.0 下载 使用新功能介绍
谷歌2017发布会更新了挺多内容的,而且也发布了AndroidStudio3.0预览版,一些功能先睹为快.(英语一般,有些翻译不太好) 下载地址 https://developer.android.g ...
- Android Studio 2.0 正式版公布啦 (首次中文翻译)
Android Studio 2.0 公布了,添加了一些新特性: 1. 更加完好的 Instant Run 2. 更快的 Android Emulator 3.GPU Debugger Preview ...
- Android Studio 2.0 稳定版新特性介绍
Android Studio 2.0 最终迎来了稳定版本号,喜大普奔. 以下这篇文章是2.0新特性的一些简介. 假设想看具体内容请看这里<Android Studio有用指南> 文章转自这 ...
- 当一回Android Studio 2.0的小白鼠
上个星期就放出了Android studio出2.0的消息,看了一下what's new 简直抓到了那个蛋疼的编译速度痛点.在网上稍微搜索了一下后发现基本都是介绍视频.一番挣扎后(因为被这IDE坑过几 ...
- Android Studio 3.0 新特性
最新Android Studio版本是Android Studio 3.0,本文提供了所有新功能和更改的摘要. 所有这些功能都可以在最新的金丝雀版本中发布,但beta测试版本可能尚未提供. 核心IDE ...
- Android Studio 2.0使用指南
一.下载界面.[无激活码 无序列码 无毒请放心使用][需将JAVA程序升级到1.8] 网址:http://www.android-studio.org/index.php/download/andro ...
- Android Studio 1.0.2项目实战——从一个APP的开发过程认识Android Studio
Android Studio 1.0.1刚刚发布不久,谷歌紧接着发布了Android Studio 1.0.2版本,和1.0.0一样,是一个Bug修复版本.在上一篇Android Studio 1.0 ...
- Android Studio 1.0.1 + Genymotion安卓模拟器打造高效安卓开发环境
我们开发安卓大多是使用Eclipse和安卓SDK中自带的安卓模拟器.当然,Google早就推出了自己的安卓开发环境——Android studio,在不久前,Google发布了Android Stud ...
- [Android] 环境配置之正式版Android Studio 1.0
昨天看见 Android Studio 1.0 正式版本发布了:心里挺高兴的. 算是忠实用户了吧,从去年开发者大会一开始出现 AS 后就开始使用了:也是从那时开始就基本没有用过 Eclipse 了:一 ...
随机推荐
- OF寄存器的判断
1000 0000 ADD 1100 0000 10 1:符号位是否有进位 有则为1 2:最高有效数值位是否向符号位产生进位 有则为1 1 XOR 0=1所以PF=1
- jquery 控件赋值
input 文本框赋值$("#id").attr("赋值"); input 文本框清空$("#id").attr("") ...
- Python协程:从yield/send到async/await
这个文章理好了脉落. http://python.jobbole.com/86069/ 我练 习了一番,感受好了很多... Python由于众所周知的GIL的原因,导致其线程无法发挥多核的并行计算能力 ...
- Pfile VS Spfile (MOS Note 249664.1)
============================================================================== Until Oracle 8i DBAs ...
- SVN-功能介绍之切换
当初新建项目IMyYa 提交到svn 目录下file:///H:/svn/truck/IMyYa 现在svn 目录版本库中调整为file:///H:/svn/truck/Win8/IMyYa 与之前不 ...
- Guava学习笔记(3):复写的Object常用方法
转自:http://www.cnblogs.com/peida/p/Guava_Objects.html 在Java中Object类是所有类的父类,其中有几个需要override的方法比如equals ...
- checkedListBox
checkedListBox一键删除多个选中items private void button3_Click(object sender, EventArgs e) { ; i < checke ...
- PHP 汉字数字互转(100以内)| PHP 汉字转数字 | PHP数字转汉字
<?php function numDatabase(){ $numarr =array(1,2,3,4,5,6,7,8,9,10,11,12,13,14,15,16,17,18,19,20,2 ...
- XCode6 生成prefix.pch文件
XCode6里, 新建工程默认是没有pch文件的,苹果取消pch文件这一点肯定有它的道理,刚开始很多人可能不适应,如果我们想使用pch文件,需要手动添加,添加步骤如下:(依旧直接上图)
- 后台拼接input 后,动态获取input的值
//前台 <input id=" /> //后台 string text = request.form["text"].toString();