arcgis api for flex之专题图制作(饼状图,柱状图等)
最近公司给我一个任务,就是利用arcgis api for flex实现在地图上点(业务数据)直接显示饼状图以及柱状图的专题图制作,而不是通过点击点显示气泡窗口的形式来实现,这个公司已经实现了。
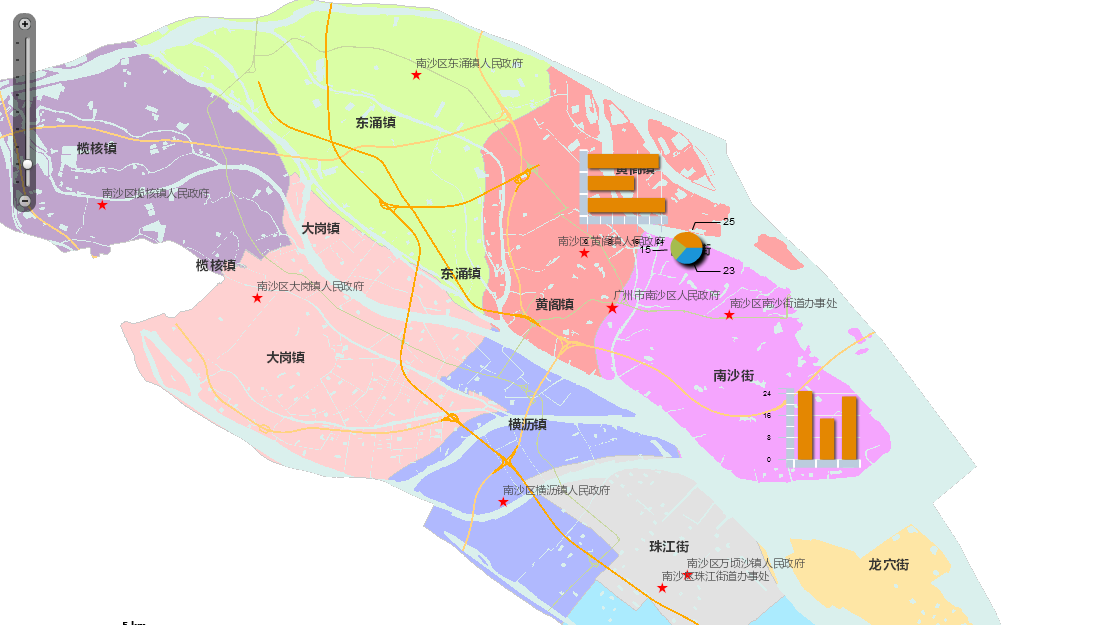
经过一段时间的摸索,参照一些网上资源,目前大概弄出来了,里面还有待完善的地方的。
效果图如下:
(1)Chart.mxml,主要的展示地图专题图效果的页面
<?xml version="1.0" encoding="utf-8"?>

<s:Application xmlns:fx="http://ns.adobe.com/mxml/2009"

			   xmlns:s="library://ns.adobe.com/flex/spark"

			   xmlns:mx="library://ns.adobe.com/flex/mx"

			   xmlns:esri="http://www.esri.com/2008/ags"

			   pageTitle="Charts in infowindow" xmlns:symbols="com.esri.ags.symbols.*">

	<fx:Style>

		.chartStyle

		{

			borderThickness: 0;

			infoPlacement: center;

			backgroundAlpha: 0;

			infoOffsetX: 0;

			infoOffsetY: 0;

			paddingLeft: 0;

			paddingRight: 0;

			paddingTop: 0;

			paddingBottom: 0;

		}

	</fx:Style>

	<fx:Script>

		<![CDATA[

			import com.esri.ags.geometry.MapPoint;

			import com.esri.ags.FeatureSet;

			import com.esri.ags.Graphic;

			import com.esri.ags.events.MapEvent;

			import com.esri.ags.tasks.QueryTask;

			import com.esri.ags.tasks.supportClasses.Query;

			import mx.collections.ArrayCollection;

			import mx.controls.Alert;

			import mx.events.FlexEvent;

			import mx.rpc.AsyncResponder;

			protected function myMap_initializeHandler(event:MapEvent):void

			{

				var pie:MapPoint = new MapPoint(113.55185,22.82289);

				var column:MapPoint = new MapPoint(113.59637985600011,22.758225999000047);

				var bar:MapPoint = new MapPoint(113.52757794,22.84012158);

				var gpie:Graphic = new Graphic(pie);

				var gcolumn:Graphic = new Graphic(column);

				var gbar:Graphic = new Graphic(bar);

				//g.attributes = new Object();

				var thematic:ArrayCollection = new ArrayCollection(

					[

					{ Name: "危化品1", Rate: 25 },

					{ Name: "危化品2", Rate: 15 },

					{ Name: "危化品3", Rate: 23 }

					]);

				//g.attributes.thematic = thematic;

				gpie.attributes = thematic;

				gcolumn.attributes = thematic;

				gbar.attributes = thematic;

				this.myGraphicsLayerpie.add(gpie);

				this.myGraphicsLayercolumn.add(gcolumn);

				this.myGraphicsLayerbar.add(gbar);

			}

		]]>

	</fx:Script>

	<fx:Declarations>

		<esri:InfoSymbol id="infoSymbolpie" infoRenderer="InfoRendererPieChart" containerStyleName="chartStyle">

		</esri:InfoSymbol>

		<esri:InfoSymbol id="infoSymbolcolumn" infoRenderer="InfoRendererColumnChart" containerStyleName="chartStyle">

		</esri:InfoSymbol>

		<esri:InfoSymbol id="infoSymbolbar" infoRenderer="InfoRendererBarChart" containerStyleName="chartStylee">

		</esri:InfoSymbol>

	</fx:Declarations>

	<esri:Map id="myMap" load="myMap_initializeHandler(event)">

		<esri:extent>

			<esri:Extent xmin="113.284171273203" ymin="22.6348519473499" xmax="113.774816132605" ymax="22.9103935318251">

				<esri:spatialReference>

					<esri:SpatialReference wkid="4326"/>

				</esri:spatialReference>

			</esri:Extent>

		</esri:extent>

		<esri:ArcGISTiledMapServiceLayer url="http://localhost:6080/ArcGIS/rest/services/ns_new/MapServer"/>

		<esri:GraphicsLayer id="myGraphicsLayercolumn" symbol="{infoSymbolcolumn}">

		</esri:GraphicsLayer>

		<esri:GraphicsLayer id="myGraphicsLayerpie" symbol="{infoSymbolpie}">

		</esri:GraphicsLayer>

		<esri:GraphicsLayer id="myGraphicsLayerbar" symbol="{infoSymbolbar}">

		</esri:GraphicsLayer>

	</esri:Map>

</s:Application>
(2)InfoRendererBarChart.mxml、InfoRendererColumnChart.mxml、InfoRendererPieChart.mxml,分别是柱状图以及饼状图实现的页面
1.InfoRendererBarChart.mxml
<?xml version="1.0" encoding="utf-8"?>

<s:VGroup xmlns:fx="http://ns.adobe.com/mxml/2009"

          xmlns:s="library://ns.adobe.com/flex/spark"

          xmlns:mx="library://ns.adobe.com/flex/mx"

          clipAndEnableScrolling="true"

          creationComplete="creationCompleteHandler()"

          implements="mx.core.IDataRenderer" width="100" height="100">

    <!--

         This is used by the QueryResultsWithChart sample.

    -->

    <fx:Script>

        <![CDATA[

            private var _data:Object;

            [Bindable]

            // implement IDataRenderer

            public function get data():Object

            {

                return _data;

            }

            public function set data(value:Object):void

            {

                _data = value;

            }

            private function creationCompleteHandler():void

            {

            }

        ]]>

    </fx:Script>

	<mx:BarChart id="columnChart"  width="100%" height="100%"

					dataProvider="{data}"

					showDataTips="true">

		<mx:series>

			<mx:BarSeries id="barSeries" xField="Rate"/>

		</mx:series>

		<mx:verticalAxis>

			<mx:CategoryAxis id="barAxis" categoryField="Name"/>

		</mx:verticalAxis>

		<mx:verticalAxisRenderers>

			<mx:AxisRenderer axis="{barAxis}" showLabels="false"/>

		</mx:verticalAxisRenderers>

	</mx:BarChart>

</s:VGroup>
2.InfoRendererColumnChart.mxml
<?xml version="1.0" encoding="utf-8"?>

<s:VGroup xmlns:fx="http://ns.adobe.com/mxml/2009"

          xmlns:s="library://ns.adobe.com/flex/spark"

          xmlns:mx="library://ns.adobe.com/flex/mx"

          clipAndEnableScrolling="true"

          creationComplete="creationCompleteHandler()"

          implements="mx.core.IDataRenderer" width="100" height="100">

    <!--

         This is used by the QueryResultsWithChart sample.

    -->

    <fx:Script>

        <![CDATA[

            private var _data:Object;

            [Bindable]

            // implement IDataRenderer

            public function get data():Object

            {

                return _data;

            }

            public function set data(value:Object):void

            {

                _data = value;

            }

            private function creationCompleteHandler():void

            {

            }

        ]]>

    </fx:Script>

	<mx:ColumnChart id="columnChart"  width="100%" height="100%"

					dataProvider="{data}"

					showDataTips="true">

		<mx:series>

			<mx:ColumnSeries id="columnSeries" yField="Rate"/>

		</mx:series>

		<mx:horizontalAxis>

			<mx:CategoryAxis id="columnAxis" categoryField="Name"/>

		</mx:horizontalAxis>

		<mx:horizontalAxisRenderers>

			<mx:AxisRenderer axis="{columnAxis}" showLabels="false"/>

		</mx:horizontalAxisRenderers>

	</mx:ColumnChart>

</s:VGroup>
3.InfoRendererPieChart.mxml
<?xml version="1.0" encoding="utf-8"?>

<s:VGroup xmlns:fx="http://ns.adobe.com/mxml/2009"

          xmlns:s="library://ns.adobe.com/flex/spark"

          xmlns:mx="library://ns.adobe.com/flex/mx"

          clipAndEnableScrolling="true"

          creationComplete="creationCompleteHandler()"

          implements="mx.core.IDataRenderer" width="100" height="100">

    <!--

         This is used by the QueryResultsWithChart sample.

    -->

    <fx:Script>

        <![CDATA[

            private var _data:Object;

            [Bindable]

            // implement IDataRenderer

            public function get data():Object

            {

                return _data;

            }

            public function set data(value:Object):void

            {

                _data = value;

            }

            private function creationCompleteHandler():void

            {

            }

        ]]>

    </fx:Script>

    <mx:PieChart id="pieChart"

                 width="100%" height="100%"

                 dataProvider="{data}"

                 showDataTips="true" >

        <mx:series>

            <mx:PieSeries field="Rate"

                          labelPosition="callout"

                          nameField="Name">

            </mx:PieSeries>

        </mx:series>

    </mx:PieChart>

</s:VGroup>
上述的总体实现思路是这样的:核心是InfoSymbol,InfoSymbol自定义infoRenderer绑定专题图的模版,比如InfoRendererBarChart.mxml、InfoRendererColumnChart.mxml、InfoRendererPieChart.mxml;程序初始化的时候生成了一些带有统计信息的Graphic添加到地图上,这些Graphic对象的attributes属性集合来保存各个统计的对象,每个统计的对象包含两个字段:Name表示危化品名称,Rate表示占有比重,下面我们会在InfoSymbol的定义中再次看到这两个字段。当定义好这些Graphic对象以后,我们就可以把它们添加到设置了InfoSymbol符号的GraphicLayer上了。在InfoSymbol的定义中,我们可以看到,在这个InfoSymbol中添加了一个饼图组件PieChart,这个饼图的dataProvider属性绑定的是{data},它代表的其实就是Graphic对象的attributes属性。你可以简单地这样认为:InfoSymbol中的data代表的就是其对应的Graphic对象的attributes属性。其他的柱状图也是同理的。
既然在InfoSymbol中可以获得Graphic的属性信息,那么根据Graphic的属性信息来绘制不同的专题图就是水到渠成的事情了。
样式代码解析:
		.chartStyle

		{

			borderThickness: 0; /*显示专题图的边框宽度*/

			infoPlacement: center;/*显示专题图的位置,这里是中心*/

			backgroundAlpha: 0;/*显示专题图的背景透明度,这里设置为0,是为了隐藏背景*/

			infoOffsetX: 0;/*显示专题图的X偏移,设置0,不然会偏离原始点位置*/

			infoOffsetY: 0;/*显示专题图的Y偏移,设置0,不然会偏离原始点位置*/

			paddingLeft: 0;/*显示专题图的位置偏移,设置0,不然会偏离原始点位置*/

			paddingRight: 0;/*显示专题图的位置偏移,设置0,不然会偏离原始点位置*/

			paddingTop: 0;/*显示专题图的位置偏移,设置0,不然会偏离原始点位置*/

			paddingBottom: 0;/*显示专题图的位置偏移,设置0,不然会偏离原始点位置*/

		}
需要完善优化之处:目前GraphicsLayer定义了三个(pie,bar,column),然后各自绑定不同的infoSymbol(pie,bar,column)。这样显的有点冗余了,其实只要定义一个GraphicsLayer,然后动态的判断绑定的是哪个infoSymbol。
备注:
GIS技术交流QQ群:432512093
arcgis api for flex之专题图制作(饼状图,柱状图等)的更多相关文章
- ArcGIS Engine要素渲染和专题图制作(转)
摘要:Feature的常用的绘制方法包括:1.简单绘制:2.唯一值绘制/多字段唯一值绘制:3.点密度/多字段点密度绘制:4.数据分级绘制:5.质量图(饼图/直方图): 6.按比例尺渲染:7.比例符号渲 ...
- 将AE开发的专题图制作功能发布为WPS
AE开发可以定制化实现ArcGIS的地理处理功能,并实际运用于其他方面的工作,有时候我们还希望将AE开发的功能发布为网络地理信息处理服务(WPS),从而能在Web端更自由便利地调用所需要的地学处理算法 ...
- 天津政府应急系统之GIS一张图(arcgis api for flex)讲解(十)态势标绘模块
config.xml文件的配置如下: <widget label="态势标绘" icon="assets/images/impact_area_over.png&q ...
- 天津政府应急系统之GIS一张图(arcgis api for flex)讲解(一)GIS一张图的系统开发环境以及flexviewer框架
系统的GIS功能实现是基于arcgis api for flex,首先附上系统的主界面图,接下来的是对主界面的模块功能详细讲解: 一.GIS环境软件安装 (1)arcgis desktop的安装,要是 ...
- Clustering with the ArcGIS API for Flex
Clustering is an excellent technique for visualizing lotss of point data. We've all seen application ...
- ArcGIS API for Flex实现GraphicsLayer上画点、线、面。
目的: ArcGIS API for Flex实现GraphicsLayer上画点.线.面. 准备工作: 1.这次地图数据就用Esri提供的http://server.arcgisonline.com ...
- arcgis api for flex 开发入门(一)环境搭建
http://www.cnblogs.com/wenjl520/archive/2009/06/02/1494514.html arcgis api for flex 开发入门(一)环境搭建arcgi ...
- arcgis api for js实现克里金插值渲染图--不依赖GP服务
本篇的亮点是利用kriging.js结合arcgis api for js,实现克里金插值渲染图,截图如下: 具体实现的思路如下: 1.kriging.js开源js,可以实现针对容器canvas克里金 ...
- 天津政府应急系统之GIS一张图(arcgis api for flex)讲解(十三)台风模块
config.xml文件的配置如下: <widget label="台风" icon="assets/images/typhoon.png" config ...
随机推荐
- Minor【 PHP框架】2.第一个应用与请求的生命周期
框架Github地址:github.com/Orlion/Minor (如果觉得还不错给个star哦(^-^)V) 框架作者: Orlion 知乎:https://www.zhihu.com/peop ...
- python利用dict模拟switch
pytho本身并未提供switch语句,但可以通过dict来模拟switch, #方法1 def add(x,y): return x+y def dec(x,y): return x-y def m ...
- 深入理解javascript对象系列第三篇——神秘的属性描述符
× 目录 [1]类型 [2]方法 [3]详述[4]状态 前面的话 对于操作系统中的文件,我们可以驾轻就熟将其设置为只读.隐藏.系统文件或普通文件.于对象来说,属性描述符提供类似的功能,用来描述对象的值 ...
- 准备 KVM 实验环境 - 每天5分钟玩转 OpenStack(3)
KVM 是 OpenStack 使用最广泛的 Hypervisor,本节介绍如何搭建 KVM 实验环境 安装 KVM 上一节说了,KVM 是 2 型虚拟化,是运行在操作系统之上的,所以我们先要装一个 ...
- SQL Server-语句类别、数据库范式、系统数据库组成(一)
前言 终于等到这一天,我要开始重新系统学习数据库了,关于数据库这块,不出意外的话,每天会定时更新一篇且内容不会包含太多,简短的内容,深入的理解,Always to review the basics. ...
- 从一道面试题分析javascript闭包
据说是一不注意就会做错的五道javascript面试题之一,我们来看看这道题长什么样 function Container( properties ) { var objthis = this; fo ...
- MyCAT报java.lang.OutOfMemoryError: Java heap space
早上同事反映,mycat又假死了,估计还是内存溢出,查看了一下错误日志. INFO | jvm | // :: | java.lang.OutOfMemoryError: Java heap spac ...
- MyCAT实现MySQL的读写分离
在MySQL中间件出现之前,对于MySQL主从集群,如果要实现其读写分离,一般是在程序端实现,这样就带来一个问题,即数据库和程序的耦合度太高,如果我数据库的地址发生改变了,那么我程序端也要进行相应的修 ...
- grunt任务之seajs模块打包
grunt与seajs grunt是前端流行的自定义任务的脚手架工具,我们可以使用grunt来为我们做一些重复度很高的事情,如压缩,合并,js语法检查等.通过定义grunt的配置文件Gruntfile ...
- 2.羽翼sqlmap学习笔记之MySQL注入
1.判断一个url是否存在注入点: .sqlmap.py -u "http://abcd****efg.asp?id=7" -dbs 假设找到数据库:student ------- ...