Echart自定义y轴刻度信息2
<!DOCTYPE html>

<html>

<head>

    <meta charset="utf-8">

    <title>ECharts</title>

    <!-- 引入 echarts.js -->

    <script src="echarts.common.min.js"></script>

</head>

<body>

    <div id="container" style="width: 600px;height:400px;"></div>

    <script type="text/javascript">

        var dom = document.getElementById("container");

        var myChart = echarts.init(dom);

        var app = {};

        option = null;

        app.title = '坐标轴刻度与标签对齐';

        option = {

            color: ['#e5b87f'],

            tooltip : {

                trigger: 'axis',

                axisPointer : {            // 坐标轴指示器,坐标轴触发有效

                    type : 'line'        // 默认为直线,可选为:'line' | 'shadow'

                }

            },

            grid: {

                top: '3%',

                left: '0',

                right: '0',

                bottom: '0',

                containLabel: true

            },

            xAxis : [

                {

                    type : 'category',

                    data : [1,2,3,4,5],  //数据值

                    axisTick: {

                        alignWithLabel: true

                    }

                }

            ],

            // yAxis:{},//默认

            yAxis: {

            axisTick : {show: false},//去掉刻度

            splitLine:{      //去掉背景水平网格线

                show:false

            },

            min:0,

            max:5,

            axisLabel:{

               // 自定义y轴刻度信息

                    formatter: function (value) {

                        var texts = [];

                        if(value==0){}

                        else if(value==1){

                            texts.push('凶');

                        }

                        else if (value ==2) {

                            texts.push('次凶');

                        }

                        else if (value == 3) {

                            texts.push('吉');

                        }

                        else if(value == 4){

                            texts.push('中吉');

                        }

                        else{

                            texts.push('大吉');

                        }

                        return texts;

                    }

                }

            },

            series : [

                {

                    name:'直接访问',

                    type:'bar',

                    barWidth: '45%',

                    data:[1,2,3,4,5,6,7,8,9,10,11,12] //x轴1到12月份

                }

            ]

        };

        ;

        if (option && typeof option === "object") {

            myChart.setOption(option, true);

        }

    </script>

</body>

</html>
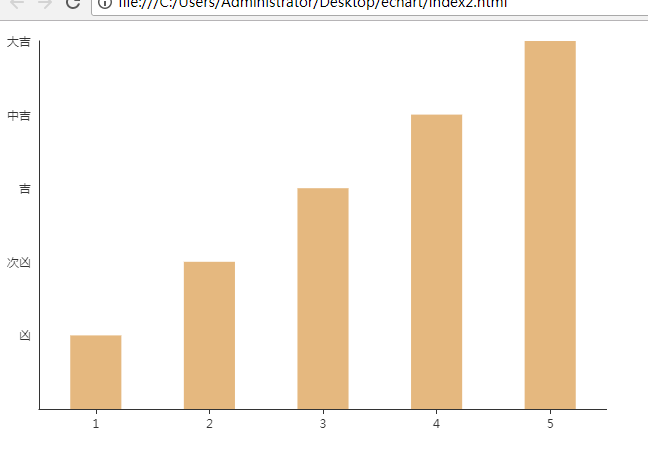
效果图:
Echart自定义y轴刻度信息2的更多相关文章
- Echart自定义y轴刻度信息1
<!DOCTYPE html> <html> <head> <meta charset="utf-8"> <title> ...
- Winform中自定义添加ZedGraph右键实现设置所有Y轴刻度的上下限
场景 Winforn中实现ZedGraph自定义添加右键菜单项(附源码下载): https://blog.csdn.net/BADAO_LIUMANG_QIZHI/article/details/10 ...
- Winform中实现ZedGraph新增自定义Y轴上下限、颜色、标题功能
场景 Winform中实现ZedGraph的多条Y轴(附源码下载): https://blog.csdn.net/BADAO_LIUMANG_QIZHI/article/details/1001322 ...
- 坐标轴刻度取值算法-基于魔数数组-源于echarts的y轴刻度计算需求
本文链接:https://blog.csdn.net/qq_26909801/article/details/96966372数值型坐标轴刻度计算算法前言算法描述上代码代码运行效果结语前言因实习的公司 ...
- highcharts 不显示X轴 Y轴 刻度
xAxis: { tickWidth:0, //设置刻度标签宽度 lineColor:'#ffffff',//设置坐标颜色 lineWidth:0, //设置坐标宽度 la ...
- 实用小工具不定期合集(textarea 高度自适应、自动计算Y轴刻度、json转table)
1.textarea高度自适应 这个非常有用,但是网上的解决方案都不尽人意,话不多说,上代码. function auto (elem) { var minHeight = 30 var change ...
- Winform中设置多条Y轴时新增的Y轴刻度不显示问题解决
场景 Winform中实现ZedGraph的多条Y轴(附源码下载): https://blog.csdn.net/BADAO_LIUMANG_QIZHI/article/details/1001322 ...
- echarts 修改y轴刻度间隔问题
其中min.max可以自定义可以动态获取数据 yAxis : [ { type : 'value', axi ...
- echarts Y轴刻度保留几位小数
yAxis: [ { type: 'value', name: '雨量(mm)', nameLocation: 'start', inverse: true, axisLabel: { ...
随机推荐
- C#中打开设计视图时报"未将对象引用设置到对象的实例"
通常情况下,若是你将用户控件写好了放入窗体中,若是有不合理的代码,则会弹出错误提示框,不让你放.若是你之前只是随便加了一个用户控件,并且没有什么问题,但后来你又把控件改坏掉了,那么你打开就会报错(在窗 ...
- linux 安装天气插件
1. 用命令 sudo apt install gnome-shell-extension-weather 安装插件 但是在那之前你安装了 GNOME Shell Extensions 如果没有安装 ...
- c# ftp 上传文件 与 下载文件
接着上一篇说. 上一篇说了根据配置文件获取路径,并判断路径在服务器中是否存在.如果不存在则在服务器中建立一个. 然后就是往路径下面传输文件了.. 代码: //连接ftp private void Co ...
- Mule ESB 安装基本配置要求
Hardware Requirements* 2GHz, dual-core CPU, or 2 virtual CPUs in virtualized environments 2GB of RAM ...
- freemaker优缺点
1.什么是FreeMarker?FreeMarker是一个模板引擎,一个基于模板生成文本输出的通用工具,使用纯Java编写.FreeMarker被设计用来生成HTMLWeb页面,特别是基于MVC模式的 ...
- 返回JSON到前台的对象属性设置
1.项目中使用JSON的第三方架包:jackson-annotations-2.8.0.jar 2.可以将对象的属性返回进行相应的处理 比如格式化时间.密码敏感等属性 如:User.java pack ...
- C#异步中的Task,async,await
class Program { static void Main(string[] args) { Console.WriteLine("我是主线程,线程ID:{0}", Thre ...
- Windows查看端口占用及杀掉进程
"到底是谁占用了80端口,该怎么查,怎么终止它?",这里就简单讲解一下,在windows下如何查看80端口占用情况?是被哪个进程占用?如何终止等.这里主要是用到windows下的D ...
- Cw210开发板
达内培训嵌入式开发板 qt + kernel uboot toolchain
- 编写高质量代码改善C#程序的157个建议——建议94:区别对待override和new
建议94:区别对待override和new override和new使类型体系应为继承而呈现出多态性.多态要求子类具有与基类同名的方法,override和new的作用就是: 如果子类中的方法前面带有n ...