
Linear regression with one variable - Model representation
摘要: 本文是吴恩达 (Andrew Ng)老师《机器学习》课程,第二章《单变量线性回归》中第6课时《模型概述》的视频原文字幕。为本人在视频学习过程中逐字逐句记录下来以便日后查阅使用。现分享给大家。如有错误,欢迎大家批评指正,在此表示诚挚地感谢!同时希望对大家的学习能有所帮助。
Our first learning algorithm will be linear regression. In this video (article), you'll see what the model looks like. And more importantly, you'll also see what the overall process of supervised learning looks like.
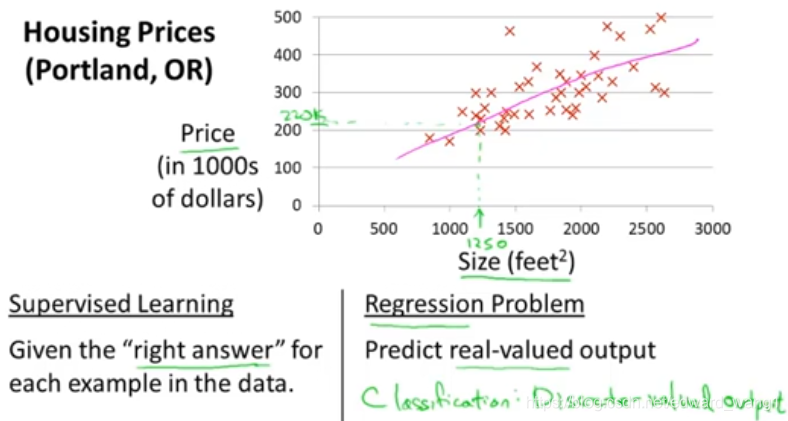
Let's use some motivating example of predicting housing prices. We're going to use a data set of housing prices from the city of Portland, Oregon. And here I'm gonna plot my data set of a number of houses that were different sizes that were sold for a range of different prices. Let's say that given this data set, you have a friend that's trying to sell a house and let's see if your friend's house is size of 1,250 square feet, and you want to tell them how much they might be able to sell the house for. Well one thing you could do is fit a model. Maybe fit a straight line to this data. Looks something like that, and based on that, maybe you could tell your friend that, let's say maybe, he can sell the house for around $220,000. So, this is an example of a supervised learning algorithm. And it's supervised learning because we're given the, quotes, "right answer" for each of following examples. Namely we're told what was the actual house, what was the house price of each of the houses in our data set were sold for. And moreover, this is an example of a regression problem, where the term regression refers to the fact that we're predicting a real-valued output, namely the price. And just to remind you the other most common type of supervised learning is called the classification problem, where we predict discrete-valued output. Such as if we are looking at cancer tumors and trying to decide if a tumor is malignant or benign. So that's a zero-one valued discrete output.
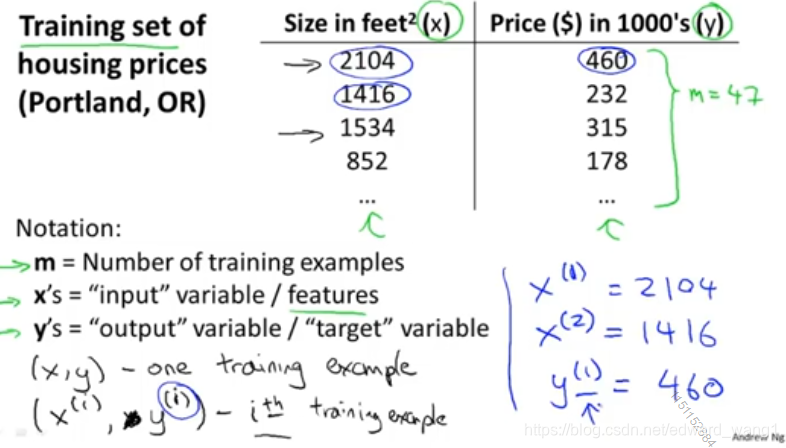
More formally, in supervised learning, we have a data set and this data set is called a training set. So, for housing price example, we have a training set of different housing prices, and our job is to learn from this data how to predict prices of houses. Let's define some notation that we're using throughout this course. We're going to define quite a lot of symbols. It's okay if you don't remember all the symbols right now, but as the course progresses, it will be useful to have a convenient notation. So, I'm gonna use lower case m throughout this course to denote the number of training examples. So, in this data set, if I have, you know, let's say 47 rows in this table, then I have 47 training examples, and m=47. Let me use lowercase x to denote the input variables, often also called the features. So that would be the x's here, it would be our input features. And I'm gonna use y to denote my output variables, or the target variable which I'm going to predict. And so that's the second column here. Looking on notation, I'm going to use (x,y) to denote a single training example. So, a single row in this table corresponds to a single training example. And to refer to a specific training example, I'm going to use this notation . And, we're going to use this to refer to the
training example. So, this superscript i over here, this is not exponentiation right? This
, the superscript i in parentheses that's just an index into my training set, and refers to the
row in this table, okay? So, this is not x to the power of i, y to power of i. Instead
just refers to the
of this table. So, for example,
refers to the input value for the first training example, so that's 2104. That's the x in the first row.
will be equal to 1416 right? That's the second x, and
will be equal to 460. That's the y value for my first training example. That's what that (1) refers to.
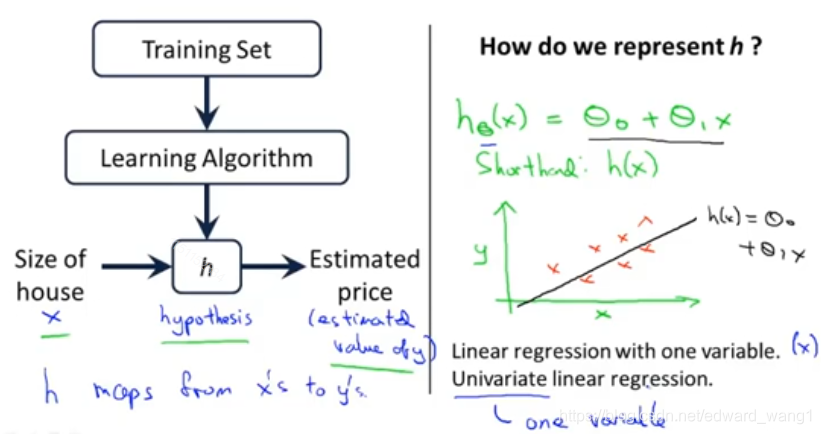
So as mentioned, occasionally I'll ask you a question to let you check your understanding, and a few seconds in this video a multiple-choice question will pop up in the video. When it does, please use your mouse to select what you think is the right answer. What defined by the training set is? So here's how this supervised learning algorithm works. We saw that with the training set like our training set of housing prices and we feed that to our learning algorithm. Is the job of a learning algorithm to then output a function, which by convention is usually denoted lowercase h, and h stands for hypothesis. And what the job of the hypothesis is, it's a function that takes as input the size of a house, like maybe the size of the new house your friend trying to sell, so it takes in the value of x, and it tries to output the estimated value of y for the corresponding house. So h is a function that maps from x's to y's. People often ask me, you know, why is the function called hypothesis. Some of you may know the meaning of the term hypothesis, from the dictionary or from the science or whatever. It turns out that in machine learning, this is a name that was used in early days of machine learning and it kinda stuck. Because maybe not a great name for this sort of function, for mapping from sizes of houses to the predictions, I think the term hypothesis, isn't the best possible name for this, but this is the standard terminology that people use in machine learning. So don't worry too much about why people call it that. When designing a learning algorithm, the next thing we need to decide is how do we represent this hypothesis h. For this and next few videos, I'm going to choose our initial choice, for representing the hypothesis, will be the following. We're going to represent h as follows. And we will write this as:
.
And as a shorthand, sometimes instead of writing , I'll just write this as
. But more often I'll write it as a subscript
over there. And plotting this in the pictures, all this means is that, we are going to predict that y is a linear function of x. Right, so that's the data set. And what this function is doing, is predicting that y is some straight-line function of x. That's
, okay? And why a linear function? Well, sometimes we'll want to fit more complicated perhaps non-linear functions as well. But since this linear case is the simple building block, we'll start with this example first of fitting linear functions, and we'll build on this to eventually have more complex models, and more complex learning algorithms. Let me also give this particular model a name. This model is called linear regression or this, for example, is actually linear regression with one variable, with the variable being x. That's the predicting all the prices as functions of one variable x. And another name for this model is univariate linear regression. And univariate is just a fancy way of saying one variable. So, that's linear regression. In the next video (article) we'll start to talk about just how we go about implementing this model.
<end>
Linear regression with one variable - Model representation的更多相关文章
- 机器学习笔记1——Linear Regression with One Variable
Linear Regression with One Variable Model Representation Recall that in *regression problems*, we ar ...
- MachineLearning ---- lesson 2 Linear Regression with One Variable
Linear Regression with One Variable model Representation 以上篇博文中的房价预测为例,从图中依次来看,m表示训练集的大小,此处即房价样本数量:x ...
- Lecture0 -- Introduction&&Linear Regression with One Variable
Introduction What is machine learning? Tom Mitchell provides a more modern definition: "A compu ...
- Machine Learning 学习笔记2 - linear regression with one variable(单变量线性回归)
一.Model representation(模型表示) 1.1 训练集 由训练样例(training example)组成的集合就是训练集(training set), 如下图所示, 其中(x,y) ...
- 机器学习 (一) 单变量线性回归 Linear Regression with One Variable
文章内容均来自斯坦福大学的Andrew Ng教授讲解的Machine Learning课程,本文是针对该课程的个人学习笔记,如有疏漏,请以原课程所讲述内容为准.感谢博主Rachel Zhang的个人笔 ...
- Stanford机器学习---第二讲. 多变量线性回归 Linear Regression with multiple variable
原文:http://blog.csdn.net/abcjennifer/article/details/7700772 本栏目(Machine learning)包括单参数的线性回归.多参数的线性回归 ...
- Stanford机器学习---第一讲. Linear Regression with one variable
原文:http://blog.csdn.net/abcjennifer/article/details/7691571 本栏目(Machine learning)包括单参数的线性回归.多参数的线性回归 ...
- Ng第二课:单变量线性回归(Linear Regression with One Variable)
二.单变量线性回归(Linear Regression with One Variable) 2.1 模型表示 2.2 代价函数 2.3 代价函数的直观理解 2.4 梯度下降 2.5 梯度下 ...
- 【cs229-Lecture2】Linear Regression with One Variable (Week 1)(含测试数据和源码)
从Ⅱ到Ⅳ都在讲的是线性回归,其中第Ⅱ章讲得是简单线性回归(simple linear regression, SLR)(单变量),第Ⅲ章讲的是线代基础,第Ⅳ章讲的是多元回归(大于一个自变量). 本文的 ...
随机推荐
- python的变量命名规范
一.python变量名命名规则: 1.变量名通常由字母,数字,下划线组成; 2.数字不能作为变量名开头; 3.不能以python中的关键字命名; 4.变量名要有意义; 5.不要用汉字和拼音去命名; 6 ...
- Win10远程桌面 报错:CredSSP加密Oracle修正……
解决方法: 运行 gpedit.msc 本地组策略: 计算机配置>管理模板>系统>凭据分配>加密Oracle修正 选择启用并选择易受攻击. 参考: https://blog.c ...
- 评估类模型之优劣解距离法Topsis模型
定义: TOPSIS法是一种常用的综合评价方法,其能充分利用原始数据的信息,其结果能精确地反映各评价方案之间的差距. 层次分析法的局限性: 问题和解决方案: 所以最终评分公式为: 指标正向化,得到正向 ...
- Java_hutool 发起请求
//执行接口 String realUrl = "http://localhost:8091/SzeportCodeService/MSGService/encryptAES"; ...
- hive安装常见错误
hive编译出错 mvn clean package -DskipTests -Phadoop-2 -Pdist 失败日志1 Failed to execute goal on project hiv ...
- [svn]查看,删除svn账号
1.查看svn账号 ll ~/.subversion/auth/svn.simple 随便打开一个文件 这是保存的对应地址的svn账号和密码,都是明文的 win路径:C:\Users\ysk\AppD ...
- Spring Cloud Eureka(六):Eureka Client 如何注册到Eureka Server
1.本节概要 根据前文我们对Eureka Server 有了一定的了解,本节我们主要学习Eureka Client 与 Eureka Server 如何通讯的及相关通信机制是什么,本文会弄清楚一下几个 ...
- UVA 11525 Permutation ——(线段树,脑筋急转弯)
只要注意到对于譬如:S1*(k-1)! 因为后面k-1个数字的全排列个数刚好是(k-1)!,那么第一个数字就是没有取过的数字的第(S1+1)个即可.取走这个数字以后这个数字就不能再用了,依次类推即可得 ...
- 重读APUE(14)-主线程终止对子线程的影响
在main中创建线程,我们称main线程为主线程,新建线程为子线程(其实没有什么主线程和子线程的父子概念,它们是平行的,为了好理解这样称呼),如果子线程内部执行相对比较耗时的操作,主线程执行的快,而且 ...
- C++公有继承,私有继承和保护继承的区别
昨天学习三种继承方式,有些比喻十分形象,特此分享. 首先说明几个术语: 1.基类 基类比起它的继承类是个更加抽象的概念,所描述的范围更大.所以可以看到有些抽象类,他们设计出来就是作为基类所存在的(有些 ...