Ta-lib 函数一览
import tkinter as tk
from tkinter import ttk
import matplotlib.pyplot as plt import numpy as np
import talib as ta series = np.random.choice([1, -1], size=200)
close = np.cumsum(series).astype(float) # 重叠指标
def overlap_process(event):
print(event.widget.get())
overlap = event.widget.get() upperband, middleband, lowerband = ta.BBANDS(close, timeperiod=5, nbdevup=2, nbdevdn=2, matype=0)
fig, axes = plt.subplots(2, 1, sharex=True)
ax1, ax2 = axes[0], axes[1]
axes[0].plot(close, 'rd-', markersize=3)
axes[0].plot(upperband, 'y-')
axes[0].plot(middleband, 'b-')
axes[0].plot(lowerband, 'y-')
axes[0].set_title(overlap, fontproperties="SimHei") if overlap == '布林线':
pass
elif overlap == '双指数移动平均线':
real = ta.DEMA(close, timeperiod=30)
axes[1].plot(real, 'r-')
elif overlap == '指数移动平均线 ':
real = ta.EMA(close, timeperiod=30)
axes[1].plot(real, 'r-')
elif overlap == '希尔伯特变换——瞬时趋势线':
real = ta.HT_TRENDLINE(close)
axes[1].plot(real, 'r-')
elif overlap == '考夫曼自适应移动平均线':
real = ta.KAMA(close, timeperiod=30)
axes[1].plot(real, 'r-')
elif overlap == '移动平均线':
real = ta.MA(close, timeperiod=30, matype=0)
axes[1].plot(real, 'r-')
elif overlap == 'MESA自适应移动平均':
mama, fama = ta.MAMA(close, fastlimit=0, slowlimit=0)
axes[1].plot(mama, 'r-')
axes[1].plot(fama, 'g-')
elif overlap == '变周期移动平均线':
real = ta.MAVP(close, periods, minperiod=2, maxperiod=30, matype=0)
axes[1].plot(real, 'r-')
elif overlap == '简单移动平均线':
real = ta.SMA(close, timeperiod=30)
axes[1].plot(real, 'r-')
elif overlap == '三指数移动平均线(T3)':
real = ta.T3(close, timeperiod=5, vfactor=0)
axes[1].plot(real, 'r-')
elif overlap == '三指数移动平均线':
real = ta.TEMA(close, timeperiod=30)
axes[1].plot(real, 'r-')
elif overlap == '三角形加权法 ':
real = ta.TRIMA(close, timeperiod=30)
axes[1].plot(real, 'r-')
elif overlap == '加权移动平均数':
real = ta.WMA(close, timeperiod=30)
axes[1].plot(real, 'r-')
plt.show() # 动量指标
def momentum_process(event):
print(event.widget.get())
momentum = event.widget.get() upperband, middleband, lowerband = ta.BBANDS(close, timeperiod=5, nbdevup=2, nbdevdn=2, matype=0)
fig, axes = plt.subplots(2, 1, sharex=True)
ax1, ax2 = axes[0], axes[1]
axes[0].plot(close, 'rd-', markersize=3)
axes[0].plot(upperband, 'y-')
axes[0].plot(middleband, 'b-')
axes[0].plot(lowerband, 'y-')
axes[0].set_title(momentum, fontproperties="SimHei") if momentum == '绝对价格振荡器':
real = ta.APO(close, fastperiod=12, slowperiod=26, matype=0)
axes[1].plot(real, 'r-')
elif momentum == '钱德动量摆动指标':
real = ta.CMO(close, timeperiod=14)
axes[1].plot(real, 'r-')
elif momentum == '移动平均收敛/散度':
macd, macdsignal, macdhist = ta.MACD(close, fastperiod=12, slowperiod=26, signalperiod=9)
axes[1].plot(macd, 'r-')
axes[1].plot(macdsignal, 'g-')
axes[1].plot(macdhist, 'b-')
elif momentum == '带可控MA类型的MACD':
macd, macdsignal, macdhist = ta.MACDEXT(close, fastperiod=12, fastmatype=0, slowperiod=26, slowmatype=0, signalperiod=9, signalmatype=0)
axes[1].plot(macd, 'r-')
axes[1].plot(macdsignal, 'g-')
axes[1].plot(macdhist, 'b-')
elif momentum == '移动平均收敛/散度 固定 12/26':
macd, macdsignal, macdhist = ta.MACDFIX(close, signalperiod=9)
axes[1].plot(macd, 'r-')
axes[1].plot(macdsignal, 'g-')
axes[1].plot(macdhist, 'b-')
elif momentum == '动量':
real = ta.MOM(close, timeperiod=10)
axes[1].plot(real, 'r-')
elif momentum == '比例价格振荡器':
real = ta.PPO(close, fastperiod=12, slowperiod=26, matype=0)
axes[1].plot(real, 'r-')
elif momentum == '变化率':
real = ta.ROC(close, timeperiod=10)
axes[1].plot(real, 'r-')
elif momentum == '变化率百分比':
real = ta.ROCP(close, timeperiod=10)
axes[1].plot(real, 'r-')
elif momentum == '变化率的比率':
real = ta.ROCR(close, timeperiod=10)
axes[1].plot(real, 'r-')
elif momentum == '变化率的比率100倍':
real = ta.ROCR100(close, timeperiod=10)
axes[1].plot(real, 'r-')
elif momentum == '相对强弱指数':
real = ta.RSI(close, timeperiod=14)
axes[1].plot(real, 'r-')
elif momentum == '随机相对强弱指标':
fastk, fastd = ta.STOCHRSI(close, timeperiod=14, fastk_period=5, fastd_period=3, fastd_matype=0)
axes[1].plot(fastk, 'r-')
axes[1].plot(fastd, 'r-')
elif momentum == '三重光滑EMA的日变化率':
real = ta.TRIX(close, timeperiod=30)
axes[1].plot(real, 'r-') plt.show() # 周期指标
def cycle_process(event):
print(event.widget.get())
cycle = event.widget.get() upperband, middleband, lowerband = ta.BBANDS(close, timeperiod=5, nbdevup=2, nbdevdn=2, matype=0)
fig, axes = plt.subplots(2, 1, sharex=True)
ax1, ax2 = axes[0], axes[1]
axes[0].plot(close, 'rd-', markersize=3)
axes[0].plot(upperband, 'y-')
axes[0].plot(middleband, 'b-')
axes[0].plot(lowerband, 'y-')
axes[0].set_title(cycle, fontproperties="SimHei") if cycle == '希尔伯特变换——主要的循环周期':
real = ta.HT_DCPERIOD(close)
axes[1].plot(real, 'r-')
elif cycle == '希尔伯特变换,占主导地位的周期阶段':
real = ta.HT_DCPHASE(close)
axes[1].plot(real, 'r-')
elif cycle == '希尔伯特变换——相量组件':
inphase, quadrature = ta.HT_PHASOR(close)
axes[1].plot(inphase, 'r-')
axes[1].plot(quadrature, 'g-')
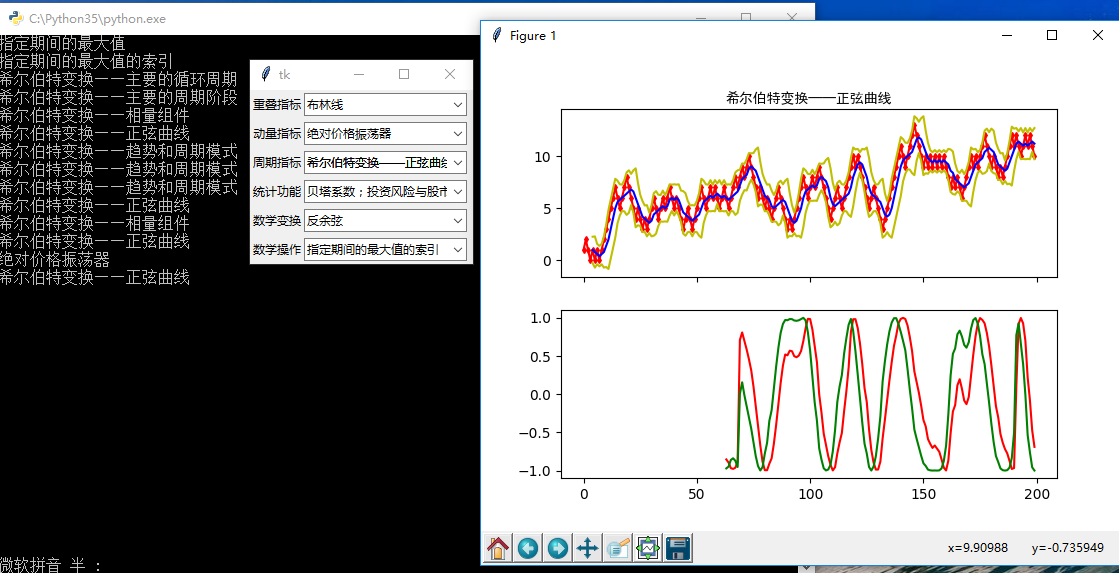
elif cycle == '希尔伯特变换——正弦曲线':
sine, leadsine = ta.HT_SINE(close)
axes[1].plot(sine, 'r-')
axes[1].plot(leadsine, 'g-')
elif cycle == '希尔伯特变换——趋势和周期模式':
integer = ta.HT_TRENDMODE(close)
axes[1].plot(integer, 'r-') plt.show() # 统计功能
def statistic_process(event):
print(event.widget.get())
statistic = event.widget.get() upperband, middleband, lowerband = ta.BBANDS(close, timeperiod=5, nbdevup=2, nbdevdn=2, matype=0)
fig, axes = plt.subplots(2, 1, sharex=True)
ax1, ax2 = axes[0], axes[1]
axes[0].plot(close, 'rd-', markersize=3)
axes[0].plot(upperband, 'y-')
axes[0].plot(middleband, 'b-')
axes[0].plot(lowerband, 'y-')
axes[0].set_title(statistic, fontproperties="SimHei") if statistic == '线性回归':
real = ta.LINEARREG(close, timeperiod=14)
axes[1].plot(real, 'r-')
elif statistic == '线性回归角度':
real = ta.LINEARREG_ANGLE(close, timeperiod=14)
axes[1].plot(real, 'r-')
elif statistic == '线性回归截距':
real = ta.LINEARREG_INTERCEPT(close, timeperiod=14)
axes[1].plot(real, 'r-')
elif statistic == '线性回归斜率':
real = ta.LINEARREG_SLOPE(close, timeperiod=14)
axes[1].plot(real, 'r-')
elif statistic == '标准差':
real = ta.STDDEV(close, timeperiod=5, nbdev=1)
axes[1].plot(real, 'r-')
elif statistic == '时间序列预测':
real = ta.TSF(close, timeperiod=14)
axes[1].plot(real, 'r-')
elif statistic == '方差':
real = ta.VAR(close, timeperiod=5, nbdev=1)
axes[1].plot(real, 'r-') plt.show() # 数学变换
def math_transform_process(event):
print(event.widget.get())
math_transform = event.widget.get() upperband, middleband, lowerband = ta.BBANDS(close, timeperiod=5, nbdevup=2, nbdevdn=2, matype=0)
fig, axes = plt.subplots(2, 1, sharex=True)
ax1, ax2 = axes[0], axes[1]
axes[0].plot(close, 'rd-', markersize=3)
axes[0].plot(upperband, 'y-')
axes[0].plot(middleband, 'b-')
axes[0].plot(lowerband, 'y-')
axes[0].set_title(math_transform, fontproperties="SimHei") if math_transform == '反余弦':
real = ta.ACOS(close)
axes[1].plot(real, 'r-')
elif math_transform == '反正弦':
real = ta.ASIN(close)
axes[1].plot(real, 'r-')
elif math_transform == '反正切':
real = ta.ATAN(close)
axes[1].plot(real, 'r-')
elif math_transform == '向上取整':
real = ta.CEIL(close)
axes[1].plot(real, 'r-')
elif math_transform == '余弦':
real = ta.COS(close)
axes[1].plot(real, 'r-')
elif math_transform == '双曲余弦':
real = ta.COSH(close)
axes[1].plot(real, 'r-')
elif math_transform == '指数':
real = ta.EXP(close)
axes[1].plot(real, 'r-')
elif math_transform == '向下取整':
real = ta.FLOOR(close)
axes[1].plot(real, 'r-')
elif math_transform == '自然对数':
real = ta.LN(close)
axes[1].plot(real, 'r-')
elif math_transform == '常用对数':
real = ta.LOG10(close)
axes[1].plot(real, 'r-')
elif math_transform == '正弦':
real = ta.SIN(close)
axes[1].plot(real, 'r-')
elif math_transform == '双曲正弦':
real = ta.SINH(close)
axes[1].plot(real, 'r-')
elif math_transform == '平方根':
real = ta.SQRT(close)
axes[1].plot(real, 'r-')
elif math_transform == '正切':
real = ta.TAN(close)
axes[1].plot(real, 'r-')
elif math_transform == '双曲正切':
real = ta.TANH(close)
axes[1].plot(real, 'r-') plt.show() # 数学操作
def math_operator_process(event):
print(event.widget.get())
math_operator = event.widget.get() upperband, middleband, lowerband = ta.BBANDS(close, timeperiod=5, nbdevup=2, nbdevdn=2, matype=0)
fig, axes = plt.subplots(2, 1, sharex=True)
ax1, ax2 = axes[0], axes[1]
axes[0].plot(close, 'rd-', markersize=3)
axes[0].plot(upperband, 'y-')
axes[0].plot(middleband, 'b-')
axes[0].plot(lowerband, 'y-')
axes[0].set_title(math_operator, fontproperties="SimHei") if math_operator == '指定的期间的最大值':
real = ta.MAX(close, timeperiod=30)
axes[1].plot(real, 'r-')
elif math_operator == '指定的期间的最大值的索引':
integer = ta.MAXINDEX(close, timeperiod=30)
axes[1].plot(integer, 'r-')
elif math_operator == '指定的期间的最小值':
real = ta.MIN(close, timeperiod=30)
axes[1].plot(real, 'r-')
elif math_operator == '指定的期间的最小值的索引':
integer = ta.MININDEX(close, timeperiod=30)
axes[1].plot(integer, 'r-')
elif math_operator == '指定的期间的最小和最大值':
min, max = ta.MINMAX(close, timeperiod=30)
axes[1].plot(min, 'r-')
axes[1].plot(max, 'r-')
elif math_operator == '指定的期间的最小和最大值的索引':
minidx, maxidx = ta.MINMAXINDEX(close, timeperiod=30)
axes[1].plot(minidx, 'r-')
axes[1].plot(maxidx, 'r-')
elif math_operator == '合计':
real = ta.SUM(close, timeperiod=30)
axes[1].plot(real, 'r-') plt.show() root = tk.Tk() # 第一行:重叠指标
rowframe1 = tk.Frame(root)
rowframe1.pack(side=tk.TOP, ipadx=3, ipady=3)
tk.Label(rowframe1, text="重叠指标").pack(side=tk.LEFT) overlap_indicator = tk.StringVar() # 重叠指标
combobox1 = ttk.Combobox(rowframe1, textvariable=overlap_indicator)
combobox1['values'] = ['布林线','双指数移动平均线','指数移动平均线 ','希尔伯特变换——瞬时趋势线',
'考夫曼自适应移动平均线','移动平均线','MESA自适应移动平均','变周期移动平均线',
'简单移动平均线','三指数移动平均线(T3)','三指数移动平均线','三角形加权法 ','加权移动平均数']
combobox1.current(0)
combobox1.pack(side=tk.LEFT) combobox1.bind('<<ComboboxSelected>>', overlap_process) # 第二行:动量指标
rowframe2 = tk.Frame(root)
rowframe2.pack(side=tk.TOP, ipadx=3, ipady=3)
tk.Label(rowframe2, text="动量指标").pack(side=tk.LEFT) momentum_indicator = tk.StringVar() # 动量指标
combobox2 = ttk.Combobox(rowframe2, textvariable=momentum_indicator)
combobox2['values'] = ['绝对价格振荡器','钱德动量摆动指标','移动平均收敛/散度','带可控MA类型的MACD',
'移动平均收敛/散度 固定 12/26','动量','比例价格振荡器','变化率','变化率百分比',
'变化率的比率','变化率的比率100倍','相对强弱指数','随机相对强弱指标','三重光滑EMA的日变化率'] combobox2.current(0)
combobox2.pack(side=tk.LEFT) combobox2.bind('<<ComboboxSelected>>', momentum_process) # 第三行:周期指标
rowframe3 = tk.Frame(root)
rowframe3.pack(side=tk.TOP, ipadx=3, ipady=3)
tk.Label(rowframe3, text="周期指标").pack(side=tk.LEFT) cycle_indicator = tk.StringVar() # 周期指标
combobox3 = ttk.Combobox(rowframe3, textvariable=cycle_indicator)
combobox3['values'] = ['希尔伯特变换——主要的循环周期','希尔伯特变换——主要的周期阶段','希尔伯特变换——相量组件',
'希尔伯特变换——正弦曲线','希尔伯特变换——趋势和周期模式'] combobox3.current(0)
combobox3.pack(side=tk.LEFT) combobox3.bind('<<ComboboxSelected>>', cycle_process) # 第四行:统计功能
rowframe4 = tk.Frame(root)
rowframe4.pack(side=tk.TOP, ipadx=3, ipady=3)
tk.Label(rowframe4, text="统计功能").pack(side=tk.LEFT) statistic_indicator = tk.StringVar() # 统计功能
combobox4 = ttk.Combobox(rowframe4, textvariable=statistic_indicator)
combobox4['values'] = ['贝塔系数;投资风险与股市风险系数','皮尔逊相关系数','线性回归','线性回归角度',
'线性回归截距','线性回归斜率','标准差','时间序列预测','方差'] combobox4.current(0)
combobox4.pack(side=tk.LEFT) combobox4.bind('<<ComboboxSelected>>', statistic_process) # 第五行:数学变换
rowframe5 = tk.Frame(root)
rowframe5.pack(side=tk.TOP, ipadx=3, ipady=3)
tk.Label(rowframe5, text="数学变换").pack(side=tk.LEFT) math_transform = tk.StringVar() # 数学变换
combobox5 = ttk.Combobox(rowframe5, textvariable=math_transform_process)
combobox5['values'] = ['反余弦','反正弦','反正切','向上取整','余弦','双曲余弦','指数','向下取整',
'自然对数','常用对数','正弦','双曲正弦','平方根','正切','双曲正切'] combobox5.current(0)
combobox5.pack(side=tk.LEFT) combobox5.bind('<<ComboboxSelected>>', math_transform_process) # 第六行:数学操作
rowframe6 = tk.Frame(root)
rowframe6.pack(side=tk.TOP, ipadx=3, ipady=3)
tk.Label(rowframe6, text="数学操作").pack(side=tk.LEFT) math_operator = tk.StringVar() # 数学操作
combobox6 = ttk.Combobox(rowframe6, textvariable=math_operator_process)
combobox6['values'] = ['指定期间的最大值','指定期间的最大值的索引','指定期间的最小值','指定期间的最小值的索引',
'指定期间的最小和最大值','指定期间的最小和最大值的索引','合计'] combobox6.current(0)
combobox6.pack(side=tk.LEFT) combobox6.bind('<<ComboboxSelected>>', math_operator_process) root.mainloop()
Ta-lib 函数一览的更多相关文章
- 【UEFI】---BIOS中对Guid的使用以及Lib函数的使用总结
---恢复内容开始--- BIOS发展至今传统的汇编实现早已被抛弃,UEFI作为目前一套主流的标准定义接口,被广泛使用.之前被一些有关GUID和一些Lib函数的使用以及跨Pkg调用给折腾的不行,每次改 ...
- Matlab绘图函数一览
要查看Matlab所有绘图函数,请从Matlab主界面菜单查看“绘图目录”,或从Matlab帮助文档查看“Types of MATLAB Plots”(在线版本).本文的图和英文解释摘自Matlab帮 ...
- SQLite核心函数一览
abs(X) abs(X)返回 X 的绝对值. Abs(X) returns NULL if X is NULL. Abs(X) return 0.0 if X is a string or blo ...
- 【转】 C++库常用函数一览
本文中提到的函数库有:<string> <cctype> <algorithm> <cmath> <cstdlib> <iomanip ...
- core_cm3文件函数一览
core_cm3是ARM公司推出来的统一规定,这是对下游芯片厂商的统一规定,因此可以再Cortex-M3(CM3)之间进行移植.此文件中定义了一些对特殊功能寄存器的C语言形式的操作,本质上是内敛汇编和 ...
- delphi字符串操作函数一览
首部 function SameText(const S1, S2: string): Boolean; $[SysUtils.pas 功能 返回两个字符串是否相等 说明 不区分大小写 参考 < ...
- PHP内置安全函数一览
内置安全函数 filter_var函数 根据参数中的过滤类型进行过滤,如过滤Email类型的,则符合的字符串返回字符串,不符合的返回False. urldecode函数 写这个函数是特别为了提醒注意, ...
- VS2005环境下采用makefile编译、使用libjpeg.lib函数库
1.从www.ijg.org下载源码,解压后得到文件夹jpeg-8d 2.在文件夹里新建jconfig.h文件,将jconfig.vc里的内容拷到jconfig.h中 3.编译. Run->CM ...
- 3、应用层常用lib函数使用说明
1.mmap函数 void* mmap(void* start,size_t length,int prot,int flags,int fd,off_t offset); start:映射区的开始地 ...
随机推荐
- git proxy
git config --global http.proxy http://127.0.0.1:1080 git config --global https.proxy https://127.0.0 ...
- Silverlight项目笔记4:初识Prism以及IoC
1.Prism Prism是由微软Patterns & Practices团队开发的针对WPF和Silverlight的MVVM框架. Prism的几个关键点: (1)启动器类UnityBoo ...
- iOS网络-02-数据解析(JSON与XML)
数据交互格式 服务器返回给用户的数据,通常是以下两种方式: JSON XML JSON 一种轻量级的数据数据格式,体积比XML小,是服务器返回给移动端通常采用的格式 用使用JSON文件中的数据,需要对 ...
- Cocos2d-x 基础元素
看过本章,然后实践之后,应该会掌握以下的认识: 1.Cocos2d-x引擎的基本运转过程 2.Cocos2d-x引擎的一些初始设置 3.对导演及图层及现实对象的认识 4.如何定义自己的显示对象 *:f ...
- android network develop(1)----doing network background
Develop network with HttpURLConnection & HttpClient. HttpURLConnection is lightweight with Http ...
- nginx中使用srcache_nginx模块构建缓存
nginx中可以将lua嵌,让nginx执行lua脚本,可以处理高并发,非阻塞的处理各种请求,openresty项目中可以使用nignx可以直接构建 srcache_nginx + redis 缓存, ...
- ubuntu创建、删除文件及文件夹方法
mkdir 目录名 => 创建一个目录 rmdir 空目录名 => 删除一个空目录 rm 文件名 文件名 => 删除一个文件或多个文件 rm –rf 非 ...
- cocos2d-x图层以及显示对象的基本使用
LogoNode: #ifndef LogoNode_hpp #define LogoNode_hpp #include <stdio.h> #include "cocos2d. ...
- Myeclipse6.0 在线安装svn插件
一.官网地址 1.SVN 官方网站:http://subversion.apache.org/ 二.安装步骤 1. 打开Myeclipse,在菜单栏中选择Help→Software Updates→F ...
- 虚拟机Linux----Ubuntu1204----退格键方向键无法使用
修改 /etc/vim/vimrc.tiny,如下: set compatible #修改为 set nocompatible #控制方向键set backspace=2 #控制退格键