Prometheus监控Canal
Prometheus监控Canal
一、背景
简单记录下,使用Prometheus对Canal进行监控。
二、实现步骤
1、修改prometheus.yml配置文件
vim /Users/huan/soft/prometheus/prometheus-2.25.0/prometheus.yml
scrape_configs:

  - job_name: 'canal'

    scrape_interval: 30s

    static_configs:

    - targets: ['localhost:11112'] # 端口配置即为canal.properties中的canal.metrics.pull.port

      labels:

        nodename: 'canal'
# 检测刚刚编写的 prometheus.yml 语法是否错误

./promtool check config prometheus.yml
2、启动prometheus
nohup /Users/huan/soft/prometheus/prometheus-2.25.0/prometheus \

--config.file="/Users/huan/soft/prometheus/prometheus-2.25.0/prometheus.yml" \

--web.listen-address="0.0.0.0:9080" \

--web.enable-lifecycle \

--storage.tsdb.retention.time="3d" \

--log.level=debug \

> logs/prometheus.out 2>&1 &
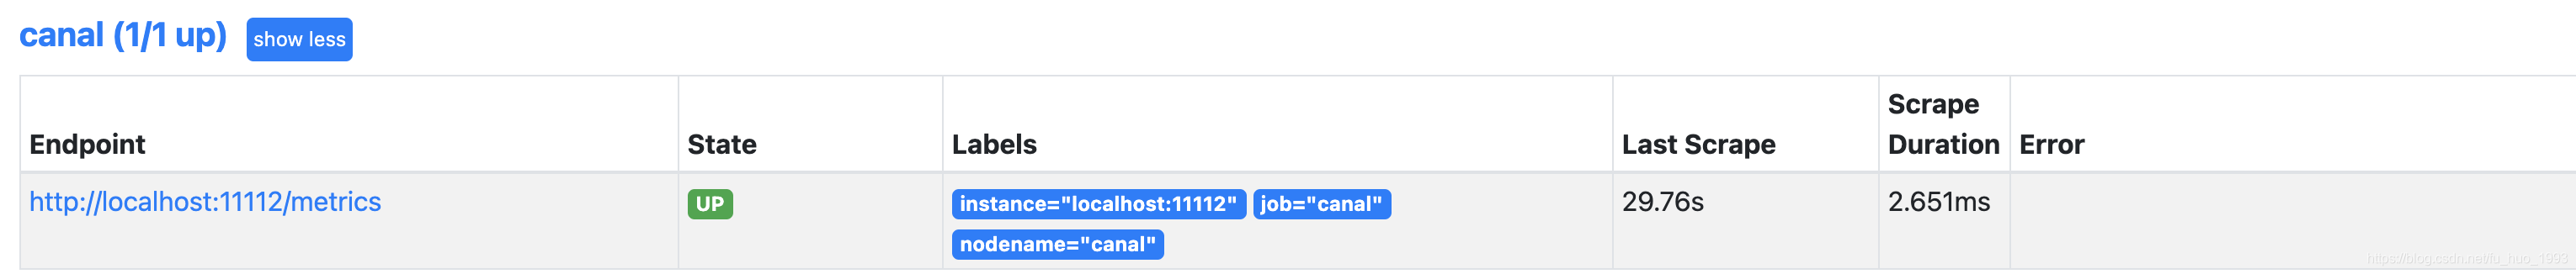
3、查看prometheus是否成功接入canal
4、canal原始指标解释
| 指标 | 说明 | 单位 | 精度 |
|---|---|---|---|
| canal_instance_transactions | instance接收transactions计数 | - | - |
| canal_instance | instance基本信息 | - | - |
| canal_instance_subscriptions | instance订阅数量 | - | - |
| canal_instance_publish_blocking_time | instance dump线程提交到异步解析队列过程中的阻塞时间(仅parallel解析模式) | ms | ns |
| canal_instance_received_binlog_bytes | instance接收binlog字节数 | byte | - |
| canal_instance_parser_mode | instance解析模式(是否开启parallel解析) | - | - |
| canal_instance_client_packets | instance client请求次数的计数 | - | - |
| canal_instance_client_bytes | 向instance client发送数据包字节计数 | byte | - |
| canal_instance_client_empty_batches | 向instance client发送get接口的空结果计数 | - | - |
| canal_instance_client_request_error | instance client请求失败计数 | - | - |
| canal_instance_client_request_latency | instance client请求的响应时间概况 | - | - |
| canal_instance_sink_blocking_time | instance sink线程put数据至store的阻塞时间 | ms | ns |
| canal_instance_store_produce_seq | instance store接收到的events sequence number | - | - |
| canal_instance_store_consume_seq | instance store成功消费的events sequence number | - | - |
| canal_instance_store | instance store基本信息 | - | - |
| canal_instance_store_produce_mem | instance store接收到的所有events占用内存总量 | byte | - |
| canal_instance_store_consume_mem | instance store成功消费的所有events占用内存总量 | byte | - |
| canal_instance_put_rows | store put操作完成的table rows | - | - |
| canal_instance_get_rows | client get请求返回的table rows | - | - |
| canal_instance_ack_rows | client ack操作释放的table rows | - | - |
| canal_instance_traffic_delay | server与MySQL master的延时 | ms | ms |
| canal_instance_put_delay | store put操作events的延时 | ms | ms |
| canal_instance_get_delay | client get请求返回events的延时 | ms | ms |
| canal_instance_ack_delay | client ack操作释放events的延时 | ms | ms |
5、导入fana图表
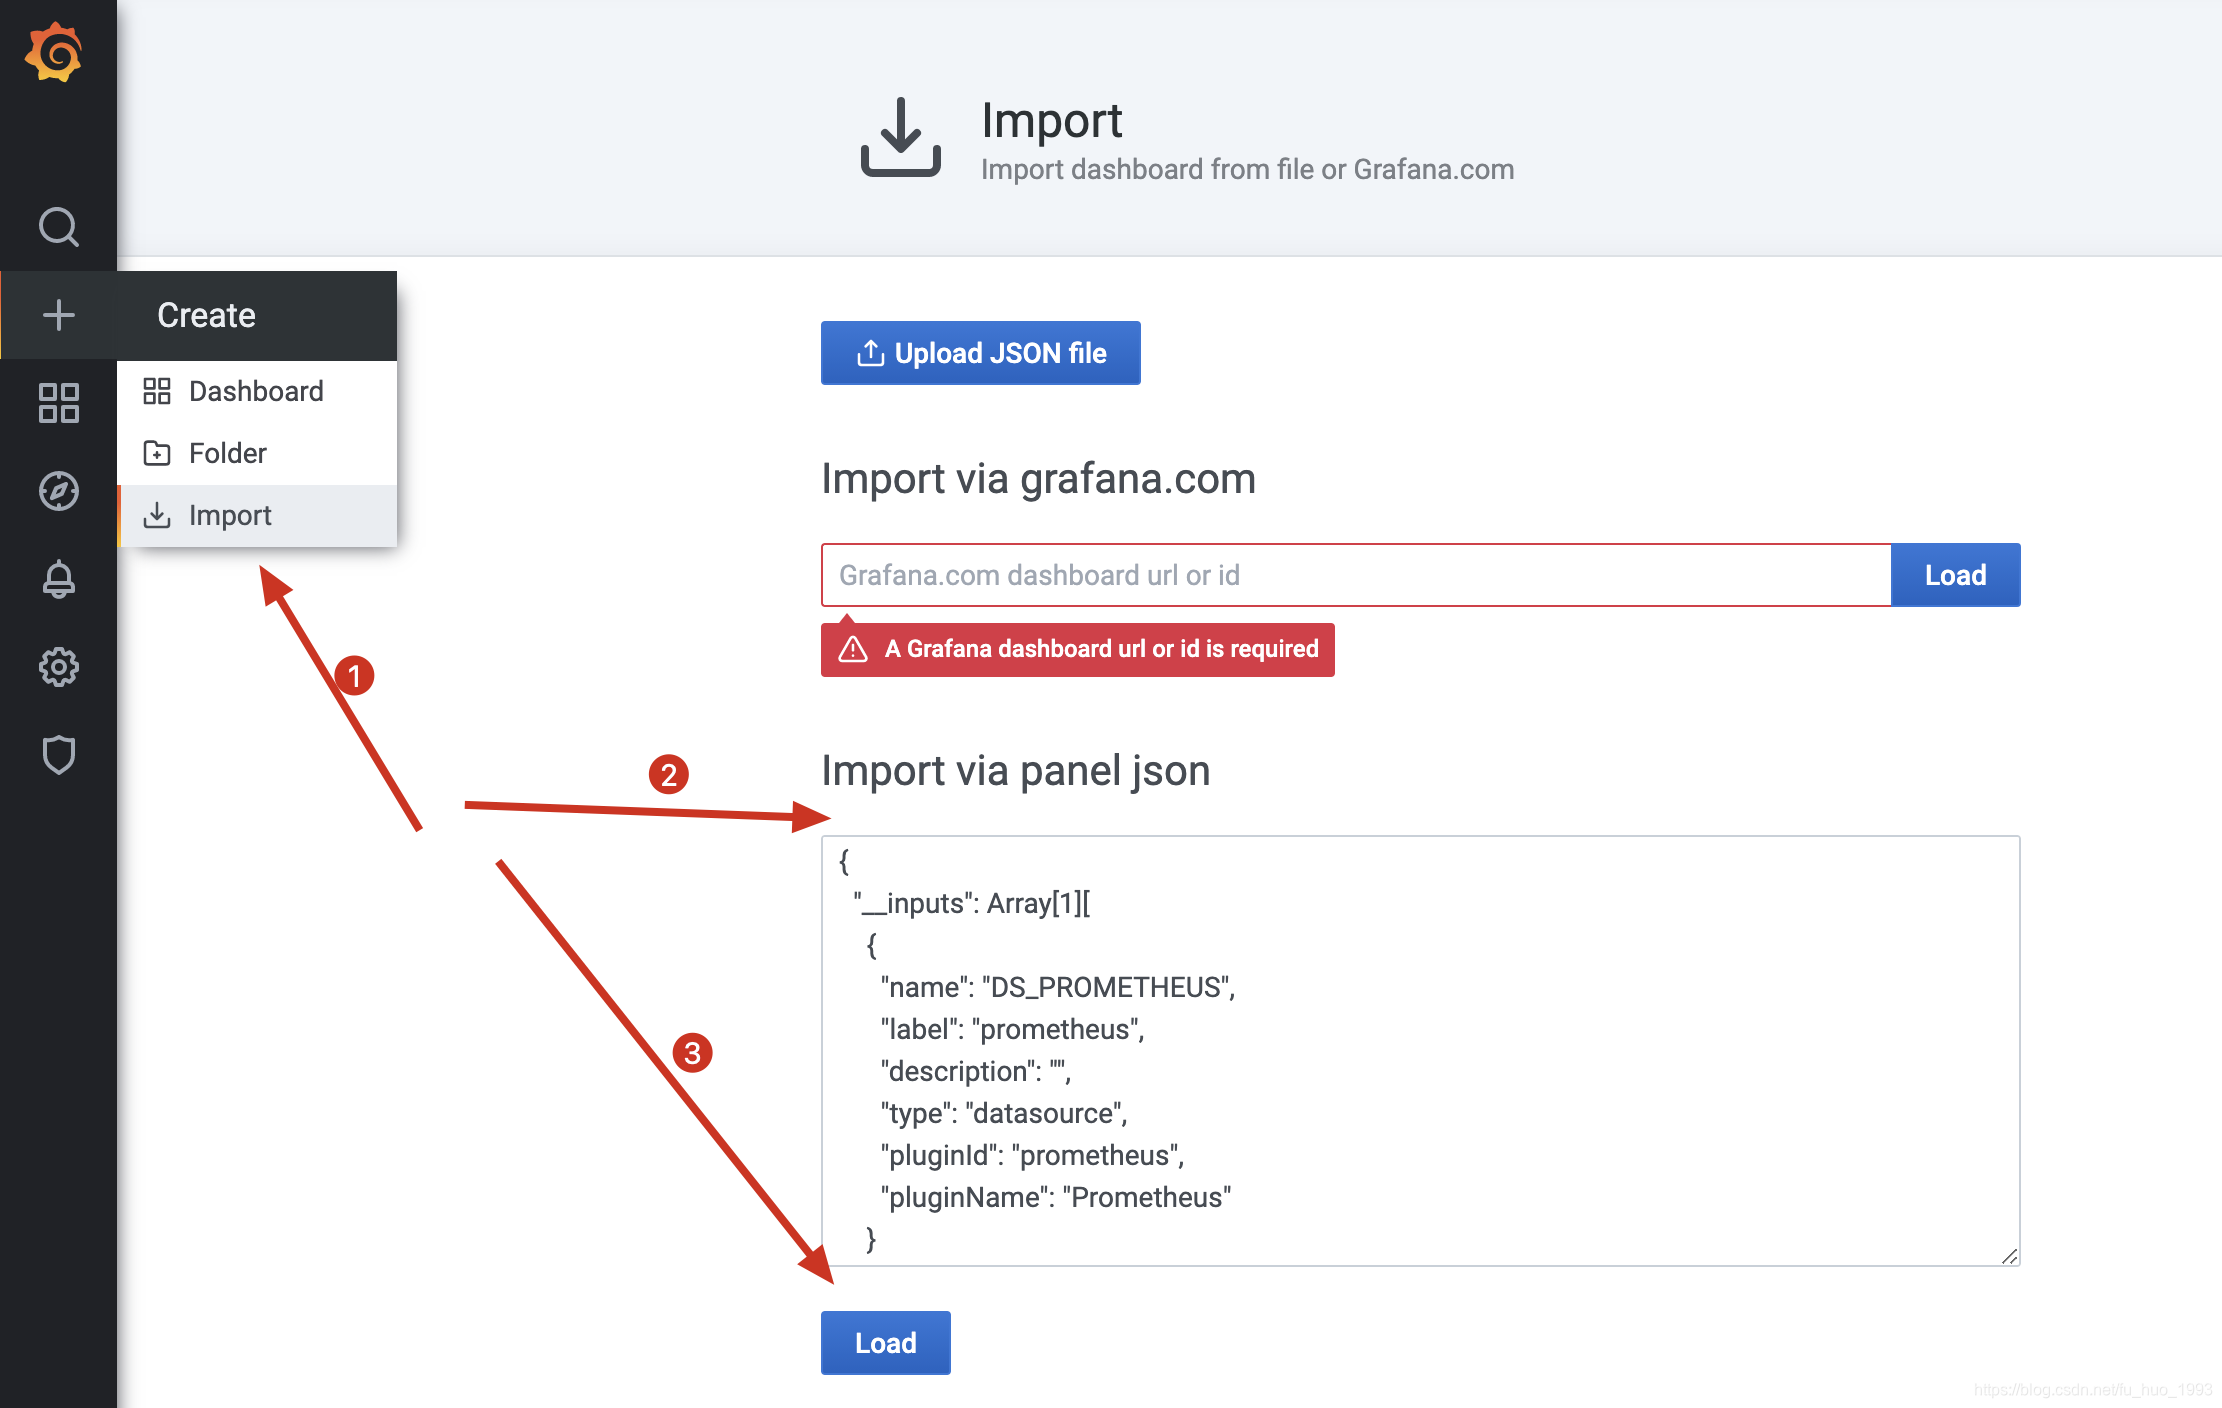
图表json数据
{
"__inputs": [
{
"name": "DS_PROMETHEUS",
"label": "prometheus",
"description": "",
"type": "datasource",
"pluginId": "prometheus",
"pluginName": "Prometheus"
}
],
"__requires": [
{
"type": "grafana",
"id": "grafana",
"name": "Grafana",
"version": "5.2.2"
},
{
"type": "panel",
"id": "graph",
"name": "Graph",
"version": "5.0.0"
},
{
"type": "datasource",
"id": "prometheus",
"name": "Prometheus",
"version": "5.0.0"
}
],
"annotations": {
"list": [
{
"builtIn": 1,
"datasource": "-- Grafana --",
"enable": true,
"hide": true,
"iconColor": "rgba(0, 211, 255, 1)",
"name": "Annotations & Alerts",
"type": "dashboard"
}
]
},
"editable": true,
"gnetId": null,
"graphTooltip": 0,
"id": null,
"iteration": 1536989235272,
"links": [],
"panels": [
{
"collapsed": false,
"gridPos": {
"h": 1,
"w": 24,
"x": 0,
"y": 0
},
"id": 30,
"panels": [],
"title": "Instance status",
"type": "row"
},
{
"aliasColors": {},
"bars": false,
"dashLength": 10,
"dashes": false,
"datasource": "$datasource",
"description": "Canal instance 基本信息。",
"fill": 1,
"gridPos": {
"h": 5,
"w": 6,
"x": 0,
"y": 1
},
"id": 24,
"legend": {
"alignAsTable": true,
"avg": false,
"current": false,
"hideEmpty": false,
"hideZero": false,
"max": false,
"min": false,
"rightSide": true,
"show": true,
"sideWidth": 500,
"total": false,
"values": false
},
"lines": true,
"linewidth": 1,
"links": [],
"nullPointMode": "null",
"percentage": false,
"pointradius": 5,
"points": false,
"renderer": "flot",
"repeat": null,
"seriesOverrides": [],
"spaceLength": 10,
"stack": false,
"steppedLine": false,
"targets": [
{
"expr": "canal_instance{destination=~\"$destination\"}",
"format": "time_series",
"instant": true,
"intervalFactor": 1,
"legendFormat": "Destination: {{destination}}",
"refId": "A"
},
{
"expr": "canal_instance_parser_mode{destination=~\"$destination\"}",
"format": "time_series",
"instant": true,
"intervalFactor": 1,
"legendFormat": "Parallel parser: {{parallel}}",
"refId": "B"
},
{
"expr": "canal_instance_store{destination=~\"$destination\"}",
"format": "time_series",
"instant": true,
"intervalFactor": 1,
"legendFormat": "Batch mode: {{batchMode}}",
"refId": "C"
},
{
"expr": "canal_instance_store{destination=~\"$destination\"}",
"format": "time_series",
"instant": true,
"intervalFactor": 1,
"legendFormat": "Buffer size: {{size}}",
"refId": "D"
}
],
"thresholds": [],
"timeFrom": null,
"timeShift": null,
"title": "Basic",
"tooltip": {
"shared": true,
"sort": 0,
"value_type": "individual"
},
"transparent": true,
"type": "graph",
"xaxis": {
"buckets": null,
"mode": "time",
"name": null,
"show": false,
"values": []
},
"yaxes": [
{
"format": "short",
"label": null,
"logBase": 1,
"max": null,
"min": null,
"show": false
},
{
"format": "short",
"label": null,
"logBase": 1,
"max": null,
"min": null,
"show": false
}
],
"yaxis": {
"align": false,
"alignLevel": null
}
},
{
"aliasColors": {
"inbound": "#bf1b00"
},
"bars": false,
"dashLength": 10,
"dashes": false,
"datasource": "$datasource",
"description": "Canal instance 网络带宽占用。\ninbound: 读取MySQL binlog.\noutbound: 对Client端传输格式化binlog.",
"fill": 1,
"gridPos": {
"h": 5,
"w": 6,
"x": 6,
"y": 1
},
"id": 6,
"legend": {
"avg": false,
"current": false,
"max": false,
"min": false,
"show": true,
"total": false,
"values": false
},
"lines": true,
"linewidth": 1,
"links": [],
"nullPointMode": "null",
"percentage": false,
"pointradius": 5,
"points": false,
"renderer": "flot",
"seriesOverrides": [],
"spaceLength": 10,
"stack": false,
"steppedLine": false,
"targets": [
{
"expr": "rate(canal_instance_received_binlog_bytes{destination=~\"$destination\", parser=\"0\"}[2m]) / 1024",
"format": "time_series",
"interval": "15s",
"intervalFactor": 2,
"legendFormat": "inbound",
"refId": "A"
},
{
"expr": "rate(canal_instance_client_bytes{destination=~\"$destination\"}[2m]) / 1024",
"format": "time_series",
"interval": "15s",
"intervalFactor": 2,
"legendFormat": "outbound",
"refId": "B"
},
{
"expr": "rate(canal_instance_received_binlog_bytes{destination=~\"$destination\", parser=\"1\"}[2m]) / 1024",
"format": "time_series",
"interval": "15s",
"intervalFactor": 2,
"legendFormat": "inbound-1",
"refId": "C"
},
{
"expr": "rate(canal_instance_received_binlog_bytes{destination=~\"$destination\", parser=\"2\"}[2m]) / 1024",
"format": "time_series",
"interval": "15s",
"intervalFactor": 2,
"legendFormat": "inbound-2",
"refId": "D"
}
],
"thresholds": [],
"timeFrom": null,
"timeShift": null,
"title": "Network bandwith",
"tooltip": {
"shared": true,
"sort": 0,
"value_type": "individual"
},
"type": "graph",
"xaxis": {
"buckets": null,
"mode": "time",
"name": null,
"show": true,
"values": []
},
"yaxes": [
{
"format": "KBs",
"label": null,
"logBase": 1,
"max": null,
"min": null,
"show": true
},
{
"format": "short",
"label": null,
"logBase": 1,
"max": null,
"min": null,
"show": true
}
],
"yaxis": {
"align": false,
"alignLevel": null
}
},
{
"aliasColors": {
"ack": "#f29191",
"get": "#cca300",
"put": "#1f78c1"
},
"bars": false,
"dashLength": 10,
"dashes": false,
"datasource": "$datasource",
"description": "master: Canal server相对于MySQL master的延时。通过master heartbeat机制能刷新idle状态下的延时。\nput: store put操作的时间点为基准。\nget: client get操作的时间点为基准。\nack: client ack操作的时间点为基准。",
"fill": 1,
"gridPos": {
"h": 5,
"w": 6,
"x": 12,
"y": 1
},
"id": 4,
"legend": {
"avg": false,
"current": false,
"max": false,
"min": false,
"show": true,
"total": false,
"values": false
},
"lines": true,
"linewidth": 1,
"links": [],
"nullPointMode": "null",
"percentage": false,
"pointradius": 5,
"points": false,
"renderer": "flot",
"seriesOverrides": [],
"spaceLength": 10,
"stack": false,
"steppedLine": false,
"targets": [
{
"expr": "canal_instance_traffic_delay{destination=~\"$destination\"} / 1000",
"format": "time_series",
"hide": false,
"interval": "15s",
"intervalFactor": 2,
"legendFormat": "master",
"refId": "D"
},
{
"expr": "canal_instance_put_delay{destination=~\"$destination\"} / 1000",
"format": "time_series",
"interval": "15s",
"intervalFactor": 2,
"legendFormat": "put",
"refId": "A"
},
{
"expr": "canal_instance_get_delay{destination=~\"$destination\"} / 1000",
"format": "time_series",
"interval": "15s",
"intervalFactor": 2,
"legendFormat": "get",
"refId": "B"
},
{
"expr": "canal_instance_ack_delay{destination=~\"$destination\"} / 1000",
"format": "time_series",
"interval": "15s",
"intervalFactor": 2,
"legendFormat": "ack",
"refId": "C"
}
],
"thresholds": [],
"timeFrom": null,
"timeShift": null,
"title": "Delay",
"tooltip": {
"shared": true,
"sort": 0,
"value_type": "individual"
},
"type": "graph",
"xaxis": {
"buckets": null,
"mode": "time",
"name": null,
"show": true,
"values": []
},
"yaxes": [
{
"format": "s",
"label": null,
"logBase": 1,
"max": null,
"min": null,
"show": true
},
{
"format": "short",
"label": null,
"logBase": 1,
"max": null,
"min": null,
"show": true
}
],
"yaxis": {
"align": false,
"alignLevel": null
}
},
{
"aliasColors": {},
"bars": false,
"dashLength": 10,
"dashes": false,
"datasource": "$datasource",
"description": "sink线程blocking占比;dump线程blocking占比(仅parallel mode)。",
"fill": 1,
"gridPos": {
"h": 5,
"w": 6,
"x": 18,
"y": 1
},
"hideTimeOverride": false,
"id": 2,
"legend": {
"avg": false,
"current": false,
"max": false,
"min": false,
"show": true,
"total": false,
"values": false
},
"lines": true,
"linewidth": 1,
"links": [],
"nullPointMode": "null",
"percentage": false,
"pointradius": 5,
"points": false,
"renderer": "flot",
"seriesOverrides": [],
"spaceLength": 10,
"stack": false,
"steppedLine": false,
"targets": [
{
"expr": "clamp_max(rate(canal_instance_publish_blocking_time{destination=~\"$destination\", parser=\"0\"}[2m]), 1000) / 10",
"format": "time_series",
"interval": "15s",
"intervalFactor": 2,
"legendFormat": "dump",
"refId": "B"
},
{
"expr": "clamp_max(rate(canal_instance_sink_blocking_time{destination=~\"$destination\"}[2m]), 1000) / 10",
"format": "time_series",
"interval": "15s",
"intervalFactor": 2,
"legendFormat": "sink",
"refId": "A"
},
{
"expr": "clamp_max(rate(canal_instance_publish_blocking_time{destination=~\"$destination\", parser=\"1\"}[2m]), 1000) / 10",
"format": "time_series",
"interval": "15s",
"intervalFactor": 2,
"legendFormat": "dump-1",
"refId": "C"
},
{
"expr": "clamp_max(rate(canal_instance_publish_blocking_time{destination=~\"$destination\", parser=\"2\"}[2m]), 1000) / 10",
"format": "time_series",
"interval": "15s",
"intervalFactor": 2,
"legendFormat": "dump-2",
"refId": "D"
}
],
"thresholds": [],
"timeFrom": null,
"timeShift": null,
"title": "Blocking",
"tooltip": {
"shared": true,
"sort": 0,
"value_type": "individual"
},
"type": "graph",
"xaxis": {
"buckets": null,
"mode": "time",
"name": null,
"show": true,
"values": []
},
"yaxes": [
{
"format": "percent",
"label": null,
"logBase": 1,
"max": null,
"min": null,
"show": true
},
{
"format": "short",
"label": null,
"logBase": 1,
"max": null,
"min": null,
"show": true
}
],
"yaxis": {
"align": false,
"alignLevel": null
}
},
{
"collapsed": false,
"gridPos": {
"h": 1,
"w": 24,
"x": 0,
"y": 6
},
"id": 32,
"panels": [],
"title": "Throughput",
"type": "row"
},
{
"aliasColors": {
"rowDatas": "#7eb26d",
"tableRows": "#c15c17"
},
"bars": false,
"dashLength": 10,
"dashes": false,
"datasource": "$datasource",
"description": "Instance处理binlog的TPS(以master变更行数table rows为基准计算)。\nput: put操作TPS。\nget: get操作TPS。\nack: ack操作TPS。",
"fill": 1,
"gridPos": {
"h": 5,
"w": 6,
"x": 0,
"y": 7
},
"id": 14,
"legend": {
"avg": false,
"current": false,
"max": false,
"min": false,
"show": true,
"total": false,
"values": false
},
"lines": true,
"linewidth": 1,
"links": [],
"nullPointMode": "null",
"percentage": false,
"pointradius": 5,
"points": false,
"renderer": "flot",
"seriesOverrides": [],
"spaceLength": 10,
"stack": false,
"steppedLine": false,
"targets": [
{
"expr": "rate(canal_instance_put_rows{destination=~\"$destination\"}[2m])",
"format": "time_series",
"interval": "15s",
"intervalFactor": 2,
"legendFormat": "put",
"refId": "A"
},
{
"expr": "rate(canal_instance_get_rows{destination=~\"$destination\"}[2m])",
"format": "time_series",
"interval": "15s",
"intervalFactor": 2,
"legendFormat": "get",
"refId": "B"
},
{
"expr": "rate(canal_instance_ack_rows{destination=~\"$destination\"}[2m])",
"format": "time_series",
"intervalFactor": 1,
"legendFormat": "ack",
"refId": "C"
}
],
"thresholds": [],
"timeFrom": null,
"timeShift": null,
"title": "TPS(table rows)",
"tooltip": {
"shared": true,
"sort": 0,
"value_type": "individual"
},
"type": "graph",
"xaxis": {
"buckets": null,
"mode": "time",
"name": null,
"show": true,
"values": []
},
"yaxes": [
{
"format": "iops",
"label": null,
"logBase": 1,
"max": null,
"min": null,
"show": true
},
{
"format": "short",
"label": null,
"logBase": 1,
"max": null,
"min": null,
"show": true
}
],
"yaxis": {
"align": false,
"alignLevel": null
}
},
{
"aliasColors": {
"transactions": "#f9ba8f"
},
"bars": false,
"dashLength": 10,
"dashes": false,
"datasource": "$datasource",
"description": "Canal instance 处理binlog的TPS,以MySQL transaction为单位计算。",
"fill": 1,
"gridPos": {
"h": 5,
"w": 6,
"x": 6,
"y": 7
},
"id": 12,
"legend": {
"avg": false,
"current": false,
"max": false,
"min": false,
"show": true,
"total": false,
"values": false
},
"lines": true,
"linewidth": 1,
"links": [],
"nullPointMode": "null",
"percentage": false,
"pointradius": 5,
"points": false,
"renderer": "flot",
"seriesOverrides": [],
"spaceLength": 10,
"stack": false,
"steppedLine": false,
"targets": [
{
"expr": "rate(canal_instance_transactions{destination=~\"$destination\"}[2m])",
"format": "time_series",
"interval": "15s",
"intervalFactor": 2,
"legendFormat": "transactions",
"refId": "A"
}
],
"thresholds": [],
"timeFrom": null,
"timeShift": null,
"title": "TPS(MySQL transaction)",
"tooltip": {
"shared": true,
"sort": 0,
"value_type": "individual"
},
"type": "graph",
"xaxis": {
"buckets": null,
"mode": "time",
"name": null,
"show": true,
"values": []
},
"yaxes": [
{
"format": "iops",
"label": null,
"logBase": 1,
"max": null,
"min": null,
"show": true
},
{
"format": "short",
"label": null,
"logBase": 1,
"max": null,
"min": null,
"show": true
}
],
"yaxis": {
"align": false,
"alignLevel": null
}
},
{
"collapsed": false,
"gridPos": {
"h": 1,
"w": 24,
"x": 0,
"y": 12
},
"id": 34,
"panels": [],
"title": "Client",
"type": "row"
},
{
"aliasColors": {},
"bars": false,
"dashLength": 10,
"dashes": false,
"datasource": "$datasource",
"description": "Canal instance接收到的请求统计,结果按packet type分类。",
"fill": 1,
"gridPos": {
"h": 5,
"w": 6,
"x": 0,
"y": 13
},
"id": 16,
"legend": {
"avg": false,
"current": false,
"max": false,
"min": false,
"show": true,
"total": false,
"values": false
},
"lines": true,
"linewidth": 1,
"links": [],
"nullPointMode": "null",
"percentage": false,
"pointradius": 5,
"points": false,
"renderer": "flot",
"seriesOverrides": [],
"spaceLength": 10,
"stack": false,
"steppedLine": false,
"targets": [
{
"expr": "canal_instance_client_packets{destination=~\"$destination\"}",
"format": "time_series",
"interval": "15s",
"intervalFactor": 2,
"legendFormat": "{{packetType}}",
"refId": "A"
}
],
"thresholds": [],
"timeFrom": null,
"timeShift": null,
"title": "Client requests",
"tooltip": {
"shared": true,
"sort": 0,
"value_type": "individual"
},
"type": "graph",
"xaxis": {
"buckets": null,
"mode": "time",
"name": null,
"show": true,
"values": []
},
"yaxes": [
{
"format": "none",
"label": null,
"logBase": 1,
"max": null,
"min": null,
"show": true
},
{
"format": "short",
"label": null,
"logBase": 1,
"max": null,
"min": null,
"show": true
}
],
"yaxis": {
"align": false,
"alignLevel": null
}
},
{
"aliasColors": {},
"bars": false,
"dashLength": 10,
"dashes": false,
"datasource": "$datasource",
"description": "client 请求的GET与ACK包的QPS。",
"fill": 1,
"gridPos": {
"h": 5,
"w": 6,
"x": 6,
"y": 13
},
"id": 38,
"legend": {
"avg": false,
"current": false,
"max": false,
"min": false,
"show": true,
"total": false,
"values": false
},
"lines": true,
"linewidth": 1,
"links": [],
"nullPointMode": "null",
"percentage": false,
"pointradius": 5,
"points": false,
"renderer": "flot",
"seriesOverrides": [],
"spaceLength": 10,
"stack": false,
"steppedLine": false,
"targets": [
{
"expr": "rate(canal_instance_client_packets{destination=~\"$destination\",packetType=\"GET\"}[2m])",
"format": "time_series",
"interval": "15s",
"intervalFactor": 2,
"legendFormat": "GET",
"refId": "A"
},
{
"expr": "rate(canal_instance_client_packets{destination=~\"$destination\",packetType=\"CLIENTACK\"}[2m])",
"format": "time_series",
"interval": "15s",
"intervalFactor": 2,
"legendFormat": "ACK",
"refId": "B"
}
],
"thresholds": [],
"timeFrom": null,
"timeShift": null,
"title": "Client QPS",
"tooltip": {
"shared": true,
"sort": 0,
"value_type": "individual"
},
"type": "graph",
"xaxis": {
"buckets": null,
"mode": "time",
"name": null,
"show": true,
"values": []
},
"yaxes": [
{
"format": "short",
"label": null,
"logBase": 1,
"max": null,
"min": null,
"show": true
},
{
"format": "short",
"label": null,
"logBase": 1,
"max": null,
"min": null,
"show": true
}
],
"yaxis": {
"align": false,
"alignLevel": null
}
},
{
"aliasColors": {},
"bars": false,
"dashLength": 10,
"dashes": false,
"datasource": "$datasource",
"description": "server响应GET请求,但返回空包的占比。",
"fill": 1,
"gridPos": {
"h": 5,
"w": 6,
"x": 12,
"y": 13
},
"id": 26,
"legend": {
"avg": false,
"current": false,
"max": false,
"min": false,
"show": true,
"total": false,
"values": false
},
"lines": true,
"linewidth": 1,
"links": [],
"nullPointMode": "null",
"percentage": false,
"pointradius": 5,
"points": false,
"renderer": "flot",
"seriesOverrides": [],
"spaceLength": 10,
"stack": false,
"steppedLine": false,
"targets": [
{
"expr": "rate(canal_instance_client_empty_batches{destination=~\"$destination\"}[2m])",
"format": "time_series",
"interval": "15s",
"intervalFactor": 2,
"legendFormat": "empty",
"refId": "A"
},
{
"expr": "rate(canal_instance_client_packets{destination=~\"$destination\", packetType=\"GET\"}[2m])",
"format": "time_series",
"intervalFactor": 1,
"legendFormat": "nonempty",
"refId": "B"
}
],
"thresholds": [],
"timeFrom": null,
"timeShift": null,
"title": "Empty packets",
"tooltip": {
"shared": true,
"sort": 0,
"value_type": "individual"
},
"type": "graph",
"xaxis": {
"buckets": null,
"mode": "time",
"name": null,
"show": true,
"values": []
},
"yaxes": [
{
"format": "wps",
"label": null,
"logBase": 1,
"max": null,
"min": null,
"show": true
},
{
"format": "short",
"label": null,
"logBase": 1,
"max": null,
"min": null,
"show": true
}
],
"yaxis": {
"align": false,
"alignLevel": null
}
},
{
"aliasColors": {},
"bars": false,
"dashLength": 10,
"dashes": false,
"datasource": "$datasource",
"description": "Canal client 请求响应时间的概况。",
"fill": 1,
"gridPos": {
"h": 5,
"w": 6,
"x": 18,
"y": 13
},
"id": 18,
"legend": {
"alignAsTable": false,
"avg": false,
"current": false,
"max": false,
"min": false,
"rightSide": false,
"show": true,
"total": false,
"values": false
},
"lines": true,
"linewidth": 1,
"links": [],
"nullPointMode": "null",
"percentage": false,
"pointradius": 5,
"points": false,
"renderer": "flot",
"seriesOverrides": [
{
"alias": "25.0",
"yaxis": 1
},
{
"alias": "100.0",
"yaxis": 1
}
],
"spaceLength": 10,
"stack": false,
"steppedLine": false,
"targets": [
{
"expr": "rate(canal_instance_client_request_latency_bucket{destination=~\"$destination\"}[2m])",
"format": "time_series",
"hide": false,
"interval": "15s",
"intervalFactor": 2,
"legendFormat": "{{le}}ms",
"refId": "A"
}
],
"thresholds": [],
"timeFrom": null,
"timeShift": null,
"title": "Response time",
"tooltip": {
"shared": true,
"sort": 0,
"value_type": "individual"
},
"transparent": false,
"type": "graph",
"xaxis": {
"buckets": null,
"mode": "time",
"name": null,
"show": true,
"values": []
},
"yaxes": [
{
"format": "short",
"label": null,
"logBase": 1,
"max": null,
"min": null,
"show": true
},
{
"format": "short",
"label": null,
"logBase": 1,
"max": null,
"min": null,
"show": true
}
],
"yaxis": {
"align": false,
"alignLevel": null
}
},
{
"collapsed": false,
"gridPos": {
"h": 1,
"w": 24,
"x": 0,
"y": 18
},
"id": 36,
"panels": [],
"title": "Store",
"type": "row"
},
{
"aliasColors": {},
"bars": false,
"dashLength": 10,
"dashes": false,
"datasource": "$datasource",
"description": "Canal instance ringbuffer内未释放的events数量。",
"fill": 1,
"gridPos": {
"h": 5,
"w": 6,
"x": 0,
"y": 19
},
"id": 20,
"legend": {
"avg": false,
"current": false,
"max": false,
"min": false,
"show": true,
"total": false,
"values": false
},
"lines": true,
"linewidth": 1,
"links": [],
"nullPointMode": "null",
"percentage": false,
"pointradius": 5,
"points": false,
"renderer": "flot",
"seriesOverrides": [],
"spaceLength": 10,
"stack": false,
"steppedLine": false,
"targets": [
{
"expr": "canal_instance_store_produce_seq{destination=~\"$destination\"} - canal_instance_store_consume_seq{destination=~\"$destination\"}",
"format": "time_series",
"interval": "15s",
"intervalFactor": 2,
"legendFormat": "events",
"refId": "A"
}
],
"thresholds": [],
"timeFrom": null,
"timeShift": null,
"title": "Store remain events",
"tooltip": {
"shared": true,
"sort": 0,
"value_type": "individual"
},
"type": "graph",
"xaxis": {
"buckets": null,
"mode": "time",
"name": null,
"show": true,
"values": []
},
"yaxes": [
{
"decimals": null,
"format": "none",
"label": "",
"logBase": 1,
"max": null,
"min": null,
"show": true
},
{
"decimals": null,
"format": "short",
"label": null,
"logBase": 1,
"max": null,
"min": null,
"show": true
}
],
"yaxis": {
"align": false,
"alignLevel": null
}
},
{
"aliasColors": {},
"bars": false,
"dashLength": 10,
"dashes": false,
"datasource": "$datasource",
"description": "Canal instance ringbuffer 内未释放events占用内存。",
"fill": 1,
"gridPos": {
"h": 5,
"w": 6,
"x": 6,
"y": 19
},
"id": 22,
"legend": {
"avg": false,
"current": false,
"max": false,
"min": false,
"show": true,
"total": false,
"values": false
},
"lines": true,
"linewidth": 1,
"links": [],
"nullPointMode": "null",
"percentage": false,
"pointradius": 5,
"points": false,
"renderer": "flot",
"seriesOverrides": [],
"spaceLength": 10,
"stack": false,
"steppedLine": false,
"targets": [
{
"expr": "(canal_instance_store_produce_mem{destination=~\"$destination\"} - canal_instance_store_consume_mem{destination=~\"$destination\"}) / 1024",
"format": "time_series",
"interval": "15s",
"intervalFactor": 2,
"legendFormat": "memsize",
"refId": "A"
}
],
"thresholds": [],
"timeFrom": null,
"timeShift": null,
"title": "Store remain mem",
"tooltip": {
"shared": true,
"sort": 0,
"value_type": "individual"
},
"type": "graph",
"xaxis": {
"buckets": null,
"mode": "time",
"name": null,
"show": true,
"values": []
},
"yaxes": [
{
"format": "deckbytes",
"label": null,
"logBase": 1,
"max": null,
"min": null,
"show": true
},
{
"format": "short",
"label": null,
"logBase": 1,
"max": null,
"min": null,
"show": true
}
],
"yaxis": {
"align": false,
"alignLevel": null
}
}
],
"refresh": false,
"schemaVersion": 16,
"style": "dark",
"tags": [
"canal"
],
"templating": {
"list": [
{
"current": {
"text": "prometheus",
"value": "prometheus"
},
"hide": 0,
"label": "datasource",
"name": "datasource",
"options": [],
"query": "prometheus",
"refresh": 1,
"regex": "",
"type": "datasource"
},
{
"allValue": null,
"current": {},
"datasource": "$datasource",
"hide": 0,
"includeAll": false,
"label": "destination",
"multi": false,
"name": "destination",
"options": [],
"query": "label_values(canal_instance, destination)",
"refresh": 1,
"regex": "",
"sort": 0,
"tagValuesQuery": "",
"tags": [],
"tagsQuery": "",
"type": "query",
"useTags": false
}
]
},
"time": {
"from": "now-6h",
"to": "now"
},
"timepicker": {
"refresh_intervals": [
"5s",
"10s",
"30s",
"1m",
"5m",
"15m",
"30m",
"1h",
"2h",
"1d"
],
"time_options": [
"5m",
"15m",
"1h",
"6h",
"12h",
"24h",
"2d",
"7d",
"30d"
]
},
"timezone": "",
"title": "Canal instances",
"uid": "8vh8NGpiz",
"version": 103
}
三、参考链接
1、https://github.com/alibaba/canal/wiki/Prometheus-QuickStart
Prometheus监控Canal的更多相关文章
- prometheus监控系统
关于Prometheus Prometheus是一套开源的监控系统,它将所有信息都存储为时间序列数据:因此实现一种Profiling监控方式,实时分析系统运行的状态.执行时间.调用次数等,以找到系统的 ...
- Kubernetes集群部署史上最详细(二)Prometheus监控Kubernetes集群
使用Prometheus监控Kubernetes集群 监控方面Grafana采用YUM安装通过服务形式运行,部署在Master上,而Prometheus则通过POD运行,Grafana通过使用Prom ...
- SpringCloud使用Prometheus监控(基于Eureka)
本文介绍SpringCloud使用Prometheus,基于Eureka服务发现. 1.Prometheus介绍 在之前写过两篇有关Prometheus使用的文章,如下: <SpringBoot ...
- SpringBoot使用prometheus监控
本文介绍SpringBoot如何使用Prometheus配合Grafana监控. 1.关于Prometheus Prometheus是一个根据应用的metrics来进行监控的开源工具.相信很多工程都在 ...
- Prometheus 监控Haproxy
Prometheus 监控Haproxy 普罗米修斯是一个完整的监控和趋势系统,包括基于时间序列数据的内置和主动刮削,存储,查询,绘图和警报,以下使用Prometheus+grafana对Haprox ...
- 使用 Docker 部署 Grafana + Prometheus 监控 MySQL 数据库
一.背景 在平时开发过程当中需要针对 MySQL 数据库进行监控,这里我们可以使用 Grafana 和 Prometheus 来实现监控功能.Grafana 是一款功能强大的仪表盘面板,支持多种数据源 ...
- Prometheus监控学习记录
官方文档 Prometheus基础文档 从零开始:Prometheus 进阶之路:Prometheus —— 技巧篇 进阶之路:Prometheus —— 理解篇 prometheus的数据类型介绍 ...
- Prometheus监控学习笔记之prometheus的federation机制
0x00 概述 有时候对于一个公司,k8s集群或是所谓的caas只是整个技术体系的一部分,往往这个时候监控系统不仅仅要k8s集群以及k8s中部署的应用,而且要监控传统部署的项目.也就是说整个监控系统不 ...
- Prometheus监控学习笔记之Prometheus不完全避坑指南
0x00 概述 Prometheus 是一个开源监控系统,它本身已经成为了云原生中指标监控的事实标准,几乎所有 k8s 的核心组件以及其它云原生系统都以 Prometheus 的指标格式输出自己的运行 ...
随机推荐
- JUnit5快速入门指南-2
重复测试中容易产生的问题 //结果类 private static int result = 0; public static int count(int x) throws InterruptedE ...
- Golang入门学习(二):控制分支
文章目录 @[TOC] 1. 控制分支 1.1 if-else分支 1.2 switch分支 1.4 while 和do...while循环结构 1.5 多种循环结构 1.6 break 1.7 co ...
- JDBC管理事务
一.事务概念:打包一起的多个步骤的业务操作,要么同事成功,要么同时失败,则需要用事务管理: 二.代码实现
- wrap()包裹被选元素的内容
<!doctype html><html><head><meta charset="utf-8"><title>修改代码 ...
- Prism+WPF使用DependencyInjection实现AutoMapper的依赖注入功能
前言 在使用PRISM+WPF开发项目的过程中,需要使用AutoMapper实现对象-对象的映射功能.无奈PRISM没有相关对AutoMapper相关的类库,于是转换一下思想,在nuget 中存在有关 ...
- Weblogic漏洞分析之JNDI注入-CVE-2020-14645
Weblogic漏洞分析之JNDI注入-CVE-2020-14645 Oracle七月发布的安全更新中,包含了一个Weblogic的反序列化RCE漏洞,编号CVE-2020-14645,CVS评分9. ...
- oracle报错注入的一些函数
oracle 报错注入 select dbms_xmltranslations.extractxliff((select banner from sys.v_$version where rownum ...
- 【PHP数据结构】图的应用:最短路径
上篇文章的最小生成树有没有意犹未尽的感觉呀?不知道大家掌握得怎么样,是不是搞清楚了普里姆和克鲁斯卡尔这两种算法的原理了呢?面试的时候如果你写不出,至少得说出个大概来吧,当然,如果你是要考研的学生,那就 ...
- PHP中的PDO操作学习(二)预处理语句及事务
今天这篇文章,我们来简单的学习一下 PDO 中的预处理语句以及事务的使用,它们都是在 PDO 对象下的操作,而且并不复杂,简单的应用都能很容易地实现.只不过大部分情况下,大家都在使用框架,手写的机会非 ...
- goto语法在PHP中的使用
在C++.Java及很多语言中,都存在着一个神奇的语法,就是goto.顾名思义,它的使用是直接去到某个地方.从来代码的角度来说,也就是直接跳转到指定的地方.我们的PHP中也有这个功能,我们先来看看它是 ...