ggplot2 texts : Add text annotations to a graph in R software
http://www.sthda.com/english/wiki/ggplot2-texts-add-text-annotations-to-a-graph-in-r-software
- Install required packages
- Create some data
- Text annotations using geom_text and geom_label
- Change the text color and size by groups
- Add a text annotation at a particular coordinate
- annotation_custom : Add a static text annotation in the top-right, top-left, …
- ggrepel: Avoid overlapping of text labels
- Infos
This article describes how to add a text annotation to a plot generated using ggplot2 package.
The functions below can be used :
- geom_text(): adds text directly to the plot
- geom_label(): draws a rectangle underneath the text, making it easier to read.
- annotate(): useful for adding small text annotations at a particular location on the plot
- annotation_custom(): Adds static annotations that are the same in every panel
It’s also possible to use the R package ggrepel, which is an extension and provides geom for ggplot2 to repel overlapping text labels away from each other.
We’ll start by describing how to use ggplot2 official functions for adding text annotations. In the last sections, examples using ggrepel extensions are provided.
Install required packages
# Install ggplot2

install.packages("ggplot2")

# Install ggrepel

install.packages("ggrepel")
Create some data
We’ll use a subset of mtcars data. The function sample() can be used to randomly extract 10 rows:
# Subset 10 rows

set.seed(1234)

ss <- sample(1:32, 10)

df <- mtcars[ss, ]
Text annotations using geom_text and geom_label
library(ggplot2)
# Simple scatter plot
sp <- ggplot(df, aes(wt, mpg, label = rownames(df)))+
geom_point()
# Add texts
sp + geom_text()
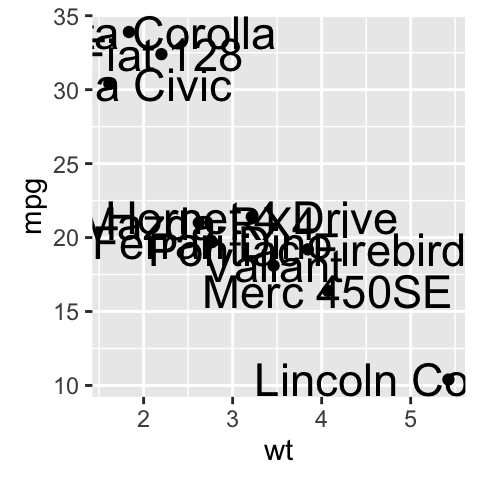
# Change the size of the texts
sp + geom_text(size=6)
# Change vertical and horizontal adjustement
sp + geom_text(hjust=0, vjust=0)
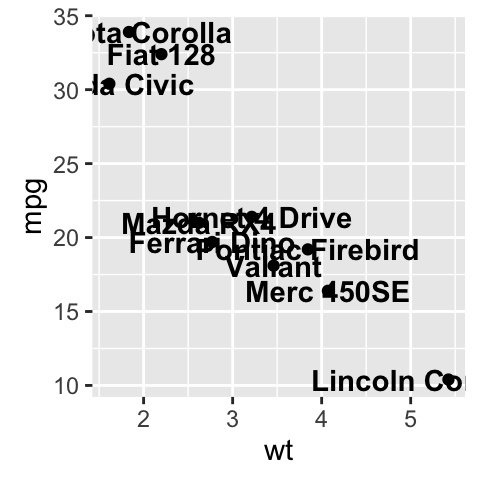
# Change fontface. Allowed values : 1(normal),
# 2(bold), 3(italic), 4(bold.italic)
sp + geom_text(aes(fontface=2))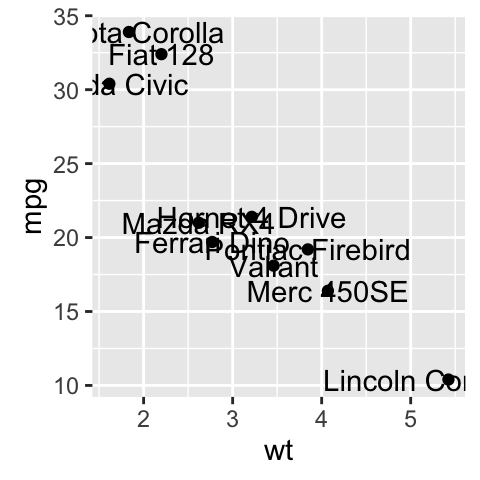
- Change font family
sp + geom_text(family = "Times New Roman")- geom_label() works like geom_text() but draws a rounded rectangle underneath each label. This is useful when you want to label plots that are dense with data.
sp + geom_label()
Others useful arguments for geom_text() and geom_label() are:
- nudge_x and nudge_y: let you offset labels from their corresponding points. The function position_nudge() can be also used.
- check_overlap = TRUE: for avoiding overplotting of labels
- hjust and vjust can now be character vectors (ggplot2 v >= 2.0.0): “left”, “center”, “right”, “bottom”, “middle”, “top”. New options include “inward” and “outward” which align text towards and away from the center of the plot respectively.
Change the text color and size by groups
It’s possible to change the appearance of the texts using aesthetics (color, size,…) :
sp2 <- ggplot(mtcars, aes(x=wt, y=mpg, label=rownames(mtcars)))+

  geom_point()

# Color by groups

sp2 + geom_text(aes(color=factor(cyl)))
# Set the size of the text using a continuous variable

sp2 + geom_text(aes(size=wt))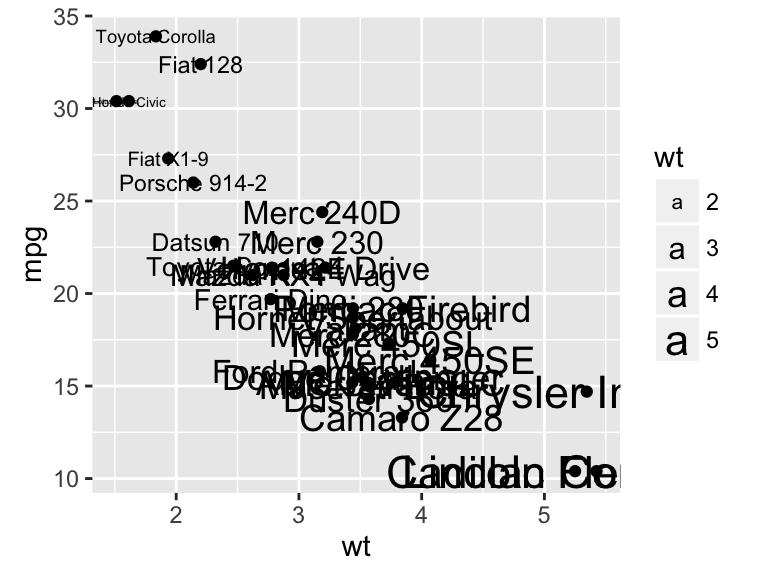
# Define size range

sp2 + geom_text(aes(size=wt)) + scale_size(range=c(3,6))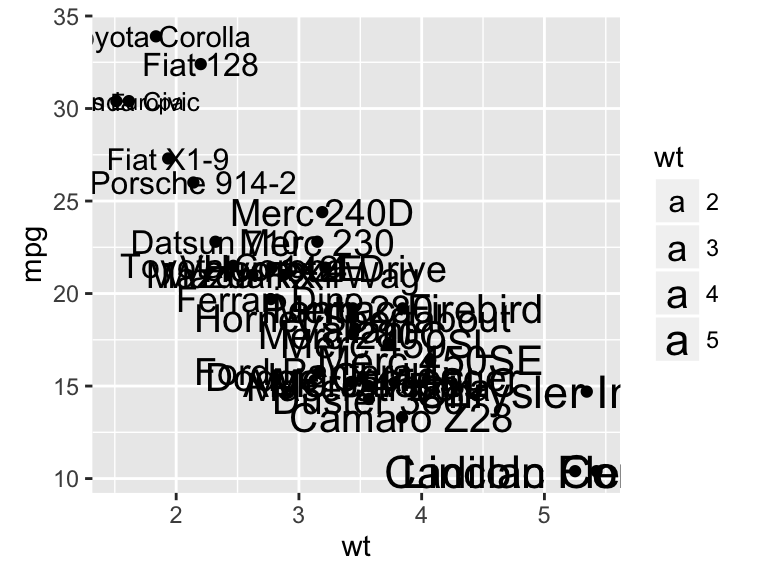
Add a text annotation at a particular coordinate
The functions geom_text() and annotate() can be used :
# Solution 1
sp2 + geom_text(x=3, y=30, label="Scatter plot")
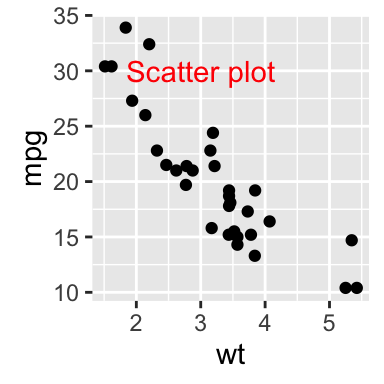
# Solution 2
sp2 + annotate(geom="text", x=3, y=30, label="Scatter plot",
color="red")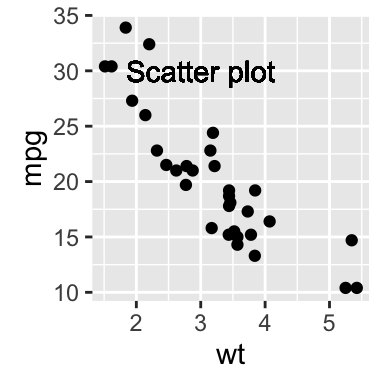
annotation_custom : Add a static text annotation in the top-right, top-left, …
The functions annotation_custom() and textGrob() are used to add static annotations which are the same in every panel.Thegrid package is required :
library(grid)

# Create a text

grob <- grobTree(textGrob("Scatter plot", x=0.1,  y=0.95, hjust=0,

  gp=gpar(col="red", fontsize=13, fontface="italic")))

# Plot

sp2 + annotation_custom(grob)
Facet : In the plot below, the annotation is at the same place (in each facet) even if the axis scales vary.
sp2 + annotation_custom(grob)+facet_wrap(~cyl, scales="free")
ggrepel: Avoid overlapping of text labels
There are two important functions in ggrepel R packages:
- geom_label_repel()
- geom_text_repel()
Scatter plots with text annotations
We start by creating a simple scatter plot using a subset of the mtcars data set containing 15 rows.
- Prepare some data:
# Take a subset of 15 random points

set.seed(1234)

ss <- sample(1:32, 15)

df <- mtcars[ss, ]- Create a scatter plot:
p <- ggplot(df, aes(wt, mpg)) +

  geom_point(color = 'red') +

theme_classic(base_size = 10)- Add text labels:
# Add text annotations using ggplot2::geom_text

p + geom_text(aes(label = rownames(df)),

              size = 3.5)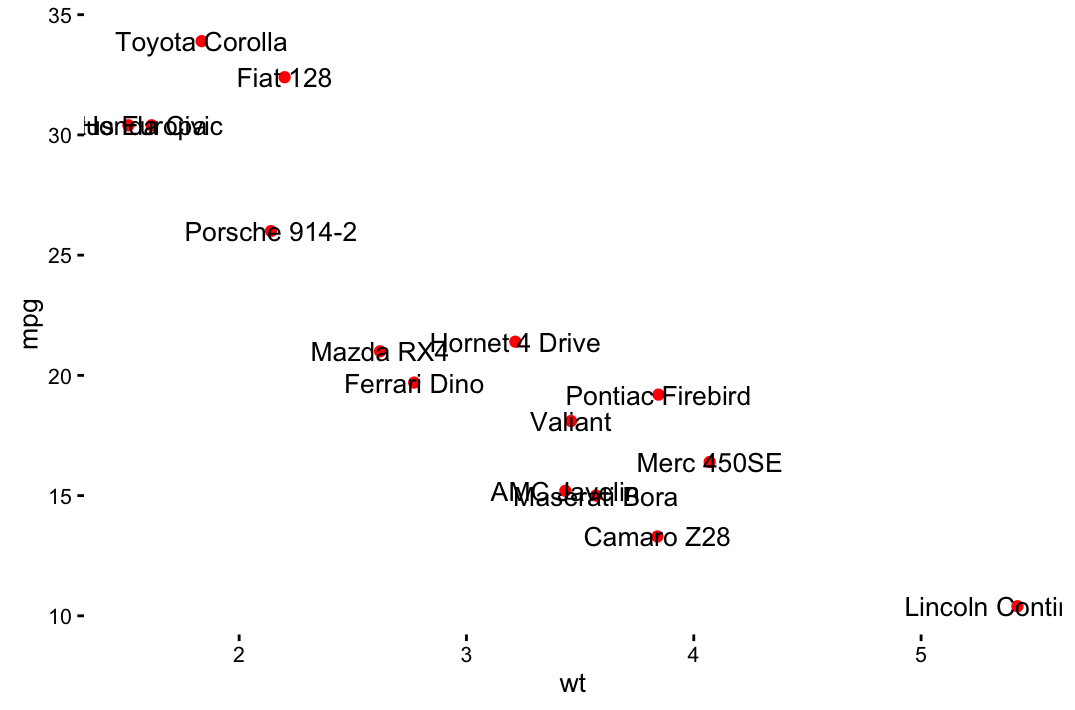
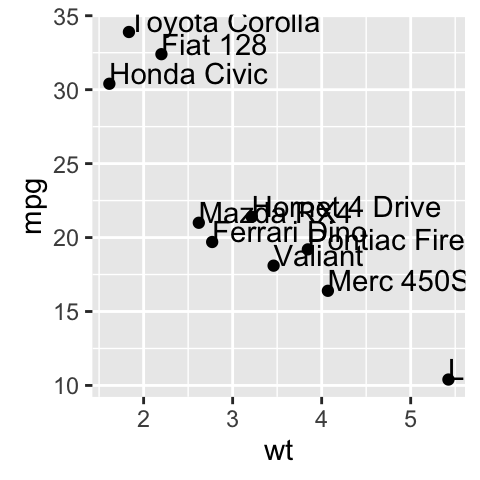
# Use ggrepel::geom_text_repel

require("ggrepel")

set.seed(42)

p + geom_text_repel(aes(label = rownames(df)),

size = 3.5) 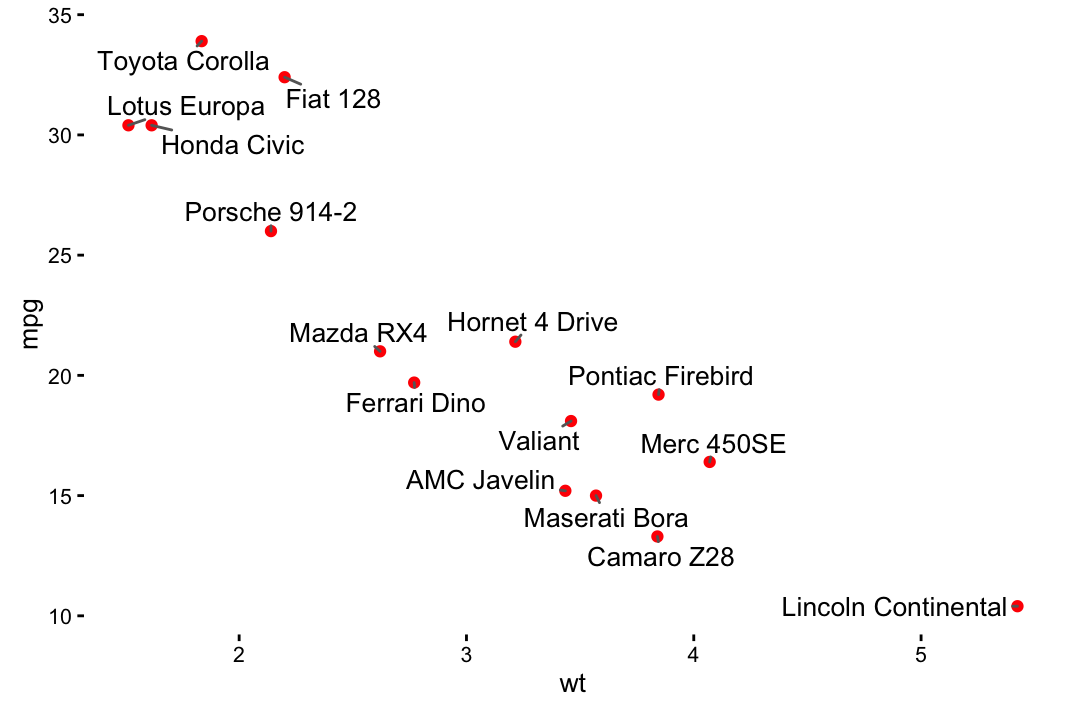
# Use ggrepel::geom_label_repel and

# Change color by groups

set.seed(42)

p + geom_label_repel(aes(label = rownames(df),

                    fill = factor(cyl)), color = 'white',

                    size = 3.5) +

   theme(legend.position = "bottom")
Volcano plot
genes <- read.table("https://gist.githubusercontent.com/stephenturner/806e31fce55a8b7175af/raw/1a507c4c3f9f1baaa3a69187223ff3d3050628d4/results.txt", header = TRUE)

genes$Significant <- ifelse(genes$padj < 0.05, "FDR < 0.05", "Not Sig")

ggplot(genes, aes(x = log2FoldChange, y = -log10(pvalue))) +

  geom_point(aes(color = Significant)) +

  scale_color_manual(values = c("red", "grey")) +

  theme_bw(base_size = 12) + theme(legend.position = "bottom") +

  geom_text_repel(

    data = subset(genes, padj < 0.05),

    aes(label = Gene),

    size = 5,

    box.padding = unit(0.35, "lines"),

    point.padding = unit(0.3, "lines")

  )
ggplot2 texts : Add text annotations to a graph in R software的更多相关文章
- Add text to 'Ready Page' in Inno Setup
https://stackoverflow.com/questions/1218411/add-text-to-ready-page-in-inno-setup
- Unsupervised Learning and Text Mining of Emotion Terms Using R
Unsupervised learning refers to data science approaches that involve learning without a prior knowle ...
- C# 利用TextBox的Text属性实现换行加字符 "\r\n"
要让一个TextBox显示多行文本就得把它的Multiline属性设置为true,可是如果你是要把TextBox的Text属性设置多行文本时,换行符由两个字符组成:"\r\n". ...
- Create and format Word documents using R software and Reporters package
http://www.sthda.com/english/wiki/create-and-format-word-documents-using-r-software-and-reporters-pa ...
- [D3] Add label text
If we want to add text to a node or a image // Create container for the images const svgNodes = svg ...
- IREP_SOA Integration程序注释语法Annotations(概念)
20150506 Created By BaoXinjian
- R绘图 第七篇:绘制条形图(ggplot2)
使用geom_bar()函数绘制条形图,条形图的高度通常表示两种情况之一:每组中的数据的个数,或数据框中列的值,高度表示的含义是由geom_bar()函数的参数stat决定的,stat在geom_ba ...
- Sublime Text 全程指引 by Lucida
作者:Lucida 微博:@peng_gong 豆瓣:@figure9 博客园:@figure9 原文链接:http://zh.lucida.me/blog/sublime-text-complete ...
- iOS"Request failed: unacceptable content-type: text/html"
接口访问出错了,用浏览器测试,发现可以正常返回数据. 下面是错误信息: 获取服务器响应出错 error=Error Domain=com.alamofire.error.serialization.r ...
随机推荐
- CAP原则和BASE理论
CAP原则 CAP原则又称CAP定理,是一个经典的分布式系统理论.CAP理论告诉我们:一个分布式系统不可能同时满足一致性(C:Consistency).可用性(A:Availability)和分区容错 ...
- 开发集成环境Devilbox安装
一.Devilbox概述 devilbox是一款现代化且高度可定制的开发环境集成,基于docker和docker-compose,支持所有主要平台(win & linux). 它不限制项目的数 ...
- localStorage(本地存储)使用总结
1.https://www.cnblogs.com/st-leslie/p/5617130.html (localStorage使用总结)
- curl使用记录
$header = array("Connection: Keep-Alive", "Accept: text/html,application/xhtml+xml,ap ...
- 黑暗世界的搜索引擎 https://fofa.so/ https://www.shodan.io https://www.zoomeye.org 查找设备漏洞
from:http://www.freebuf.com/sectool/121339.html 什么是 Shodan? 首先,Shodan 是一个搜索引擎,但它与 Google 这种搜索网址的搜索引擎 ...
- vsftpd日志配置及查看——可以将vsftpd记录在系统日志里
vsftpd日志配置及查看 vsftpd ftp服务器的日志设置,可以通过修改主配置文件/etc/vsftpd.conf实现.主配置文件中与日志设置有关的选项包括xferlog_enable .xfe ...
- poj 2096 Collecting Bugs 概率dp 入门经典 难度:1
Collecting Bugs Time Limit: 10000MS Memory Limit: 64000K Total Submissions: 2745 Accepted: 1345 ...
- c/c++指针常见错误
一 #include <bits/stdc++.h> using namespace std; void f(char *str) { char *s = str; str[] = ' / ...
- 配置Yaf
pecl里面的yaf最新测试版http://pecl.php.net/package/Yaf 安装pcre 要先安装pcre, Debian ubuntu执行 sudo apt-get install ...
- Linux下定时切割Mongodb数据库日志并删除指定天数前的日志记录
此为在网络上找来的,觉得很好! 实现目的: 对Mongodb数据库日志按天保存,并且只保留最近7天的日志记录. 具体操作: 使用Mongodb数据库自带的命令来切割日志 ps -def | grep ...