《DSP using MATLAB》示例 Example 9.8

代码:
%% ------------------------------------------------------------------------

%%            Output Info about this m-file

fprintf('\n***********************************************************\n');

fprintf('        <DSP using MATLAB> Exameple 9.8 \n\n');

time_stamp = datestr(now, 31);

[wkd1, wkd2] = weekday(today, 'long');

fprintf('      Now is %20s, and it is %7s  \n\n', time_stamp, wkd2);

%% ------------------------------------------------------------------------

I = 5; Rp = 0.1; As = 30; wp = pi/I; ws = wp+pi*0.12;

[delta1, delta2] = db2delta(Rp, As); weights = [delta2/delta1, 1];

F = [0, wp, ws, pi]/pi; A = [I, I, 0, 0];

h = firpm(30, F, A, weights); n = [0:length(h)-1];

[Hr, w, a, L] = Hr_Type1(h); Hr_min = min(Hr); w_min = find(Hr == Hr_min);

H = abs(freqz(h, 1, w)); Hdb = 20*log10(H/max(H)); min_attn = Hdb(w_min);

%% -----------------------------------------------------------------

%%                             Plot

%% -----------------------------------------------------------------

Hf1 = figure('units', 'inches', 'position', [1, 1, 8, 6], ...

	'paperunits', 'inches', 'paperposition', [0, 0, 6, 4], ...

	'NumberTitle', 'off', 'Name', 'Exameple 9.8');

set(gcf,'Color','white');

TF = 10;

subplot(2, 2, 1);

Hs1 = stem(n, h, 'filled'); set(Hs1, 'markersize', 2);

axis([-1, length(n), -0.5, 1.5]); grid on;

xlabel('n', 'vertical', 'bottom'); ylabel('Amplitude');

title('Impulse Response', 'fontsize', TF);

subplot(2, 2, 3);

plot(w/pi, Hr, 'm', 'linewidth', 1.0); axis([0, 1, -1, 6]); grid on;

xlabel('frequency in \pi units', 'fontsize', 10); ylabel('Amplitude');

title(' Amplitude Response ', 'fontsize', TF);

set(gca, 'xtick', [0, wp/pi, ws/pi, 1]);

set(gca, 'ytick', [0, I]);

subplot(2, 2, 2);

plot(w/pi, Hdb, 'm', 'linewidth', 1.0); axis([0, 1, -50, 10]); grid on;

xlabel('frequency in \pi units '); ylabel('Decibels');

title('Log-mag Response ', 'fontsize', TF);

set(gca, 'xtick', [0, wp/pi, ws/pi, 1]);

set(gca, 'ytick', [-50, round(min_attn), 0]);

subplot(2, 2, 4);

lw = length(w)-1; PB = [0:floor(wp/pi*lw)]; HrPB = Hr(PB+1)-I;

SB = [ceil(ws/pi*lw):lw]; HrSB = Hr(SB+1);

[AX, H1, H2] = plotyy(PB/lw, HrPB, SB/lw, HrSB);

delta1 = round(delta1*I*100)/100; delta2 = round(delta2*I*100)/100;

set(AX(1), 'xtick', [0, wp/pi, ws/pi, 1]);

set(AX(1), 'ytick', [-delta1, 0, delta1], 'Ycolor', 'g');

set(AX(2), 'xtick', [0, wp/pi, ws/pi, 1]);

set(AX(2), 'ytick', [-delta2, 0, delta2], 'Ycolor', 'r');

set(H1, 'color', 'g', 'linewidth', 1);

set(H2, 'color', 'r', 'linewidth', 1);

title('scaled ripples', 'fontsize', TF);

xlabel('Frequency in \pi units');
运行结果:
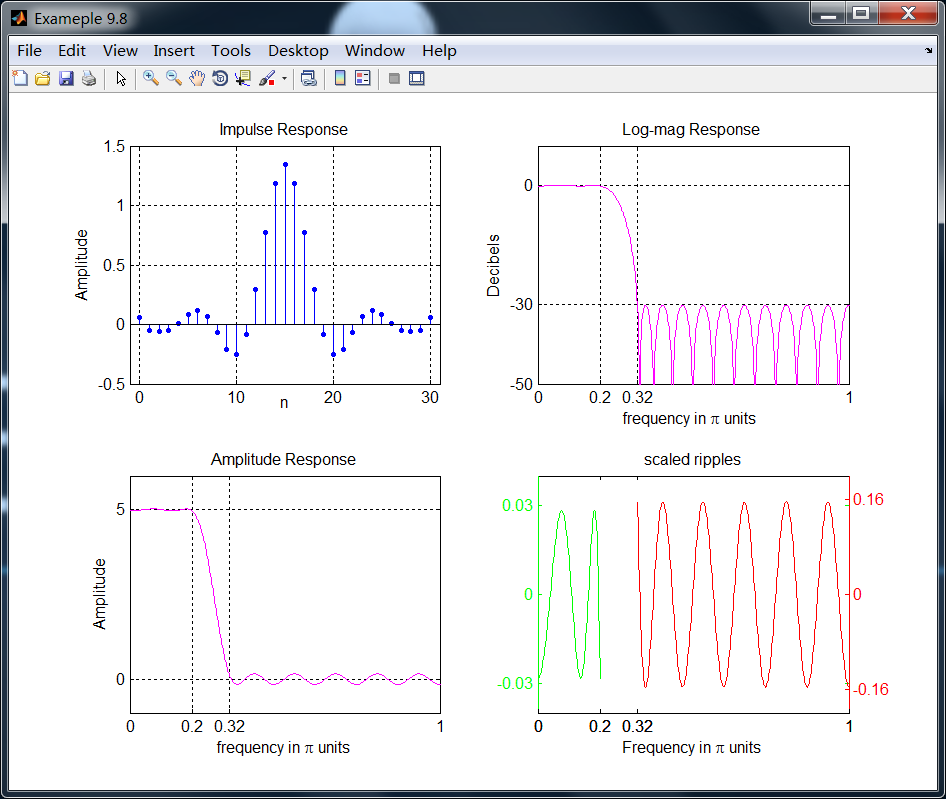
尽管该滤波器通过了原始信号,如果信号是全频带π弧度的,那么邻近的谱能量可能发生泄漏。因此需要更好的设计指标,本节的后面有讨论。
《DSP using MATLAB》示例 Example 9.8的更多相关文章
- DSP using MATLAB 示例Example3.21
代码: % Discrete-time Signal x1(n) % Ts = 0.0002; n = -25:1:25; nTs = n*Ts; Fs = 1/Ts; x = exp(-1000*a ...
- DSP using MATLAB 示例 Example3.19
代码: % Analog Signal Dt = 0.00005; t = -0.005:Dt:0.005; xa = exp(-1000*abs(t)); % Discrete-time Signa ...
- DSP using MATLAB示例Example3.18
代码: % Analog Signal Dt = 0.00005; t = -0.005:Dt:0.005; xa = exp(-1000*abs(t)); % Continuous-time Fou ...
- DSP using MATLAB 示例Example3.23
代码: % Discrete-time Signal x1(n) : Ts = 0.0002 Ts = 0.0002; n = -25:1:25; nTs = n*Ts; x1 = exp(-1000 ...
- DSP using MATLAB 示例Example3.22
代码: % Discrete-time Signal x2(n) Ts = 0.001; n = -5:1:5; nTs = n*Ts; Fs = 1/Ts; x = exp(-1000*abs(nT ...
- DSP using MATLAB 示例Example3.17
- DSP using MATLAB示例Example3.16
代码: b = [0.0181, 0.0543, 0.0543, 0.0181]; % filter coefficient array b a = [1.0000, -1.7600, 1.1829, ...
- DSP using MATLAB 示例 Example3.15
上代码: subplot(1,1,1); b = 1; a = [1, -0.8]; n = [0:100]; x = cos(0.05*pi*n); y = filter(b,a,x); figur ...
- DSP using MATLAB 示例 Example3.13
上代码: w = [0:1:500]*pi/500; % freqency between 0 and +pi, [0,pi] axis divided into 501 points. H = ex ...
- DSP using MATLAB 示例 Example3.12
用到的性质 代码: n = -5:10; x = sin(pi*n/2); k = -100:100; w = (pi/100)*k; % freqency between -pi and +pi , ...
随机推荐
- MyBatis—mybatis-config.xml配置介绍
在定义sqlSessionFactory时需要指定MyBatis主配置文件: Xml代码 说明: 收藏代码 1. <bean id="sqlSessionFactory" ...
- shoes的安装前后(一)
最近看到一个模型用到了shoes,准备自己试一试.搞了半天,也安装不成功.直接安装包,gem install shoes,失败, 从rubygems上下载最新版本的shoes 然后安装,成功了.随便写 ...
- linux改变apt-get安装源
最近自己装了个ubuntu kylin 在使用的过程中发现,系统的apt-get 的源有毛病,总是安装不了软件. 感觉应该是传说中的墙的原因,所以准备换到阿里云的源. 下面是步骤: 1.复制原文件备份 ...
- Yahoo Programming Contest 2019
A - Anti-Adjacency 签. #include <bits/stdc++.h> using namespace std; int main() { int n, k; whi ...
- ng-深度学习-课程笔记-11: 卷积神经网络(Week1)
1 边缘检测( edage detection ) 下图是垂直边缘检测的例子,实际上就是用一个卷积核进行卷积的过程. 这个例子告诉我们,卷积可以完成垂直方向的边缘检测.同理卷积也可以完成水平方向的边缘 ...
- UI自动化测试框架之Selenium关键字驱动
一.原理及特点 1. 关键字驱动测试是数据驱动测试的一种改进类型 2. 主要关键字包括三类:被操作对象(Item).操作(Operation)和值(value),用面向对象形式可将其表现为Item.O ...
- Core Java 4
p272~p273 1.除捕获异常外的另一种异常处理方式:将异常继续传递给方法调用者. 即:在方法首部添加throws说明符号,取代 try catch语句. 对于方法的调用者而言:要么处理异常,要么 ...
- POJ 1780 Code(欧拉回路+非递归dfs)
http://poj.org/problem?id=1780 题意:有个保险箱子是n位数字编码,当正确输入最后一位编码后就会打开(即输入任意多的数字只有最后n位数字有效)……要选择一个好的数字序列,最 ...
- Codeforces Round #390 (Div. 2) D. Fedor and coupons(区间最大交集+优先队列)
http://codeforces.com/contest/754/problem/D 题意: 给定几组区间,找k组区间,使得它们的公共交集最大. 思路: 在k组区间中,它们的公共交集=k组区间中右端 ...
- 学习mybatis-3 step by step 篇一
一.搭建简单mybatis-3环境(详细的中文文档) 集成开发环境:IDEA 项目:maven + mybatis-3 1.创建maven结构项目 含简单,如下图: 下一步后,填写groupid和ar ...