SpringBoot2.X&Prometheus使用
1、启动Prometheus
[root@ip101 prometheus-2.12.0.linux-amd64]# pwd

/opt/app/prometheus-2.12.0.linux-amd64

./prometheus --config.file=prometheus.yml  &

ps -ef|grep prometheus |grep -v grep
2、Prometheus 查看
2.1、Prometheus自身metrics
http://192.168.8.101:9090/metrics
2.2、 Prometheus自身graph
http://192.168.8.101:9090/graph
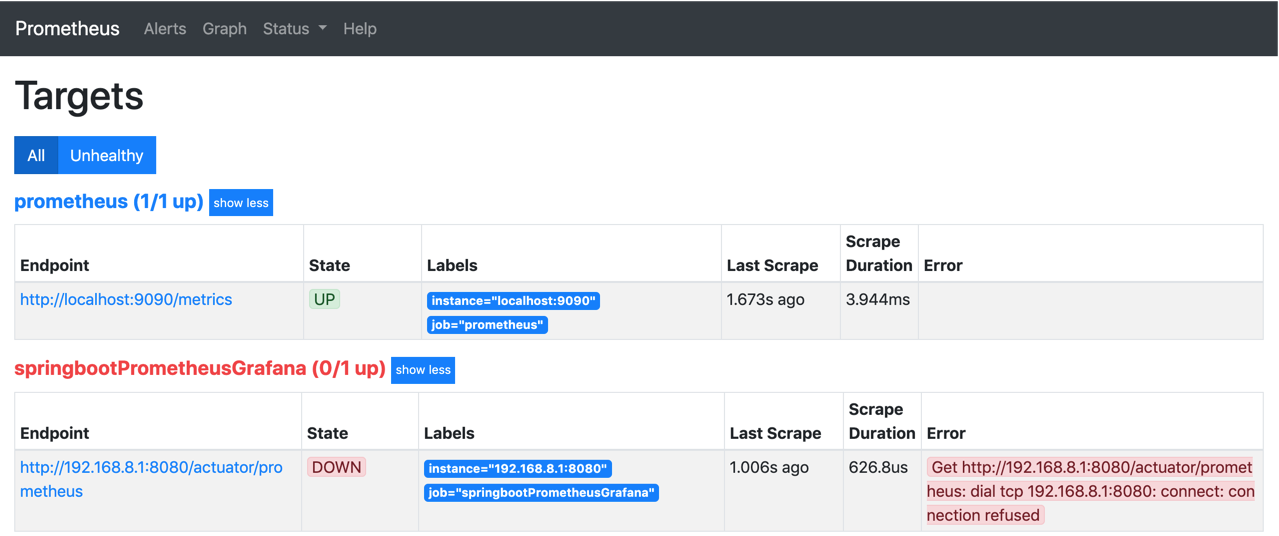
2.3、Prometheus自身targets
http://192.168.8.101:9090/targets
3、SpringBoot Actuator
server.port=8080

spring.application.name=springboot_prometheus

management.endpoints.web.exposure.include=*

management.metrics.tags.application=${spring.application.name}

#注意此处 如何配置为根目录的话,直接访问http://192.168.8.1:8080/prometheus

#http://192.168.8.1:8080/actuator/prometheus

management.endpoints.web.base-path=/actuator
Prometheus配置
global:

  scrape_interval: 15s

  scrape_timeout: 10s

  evaluation_interval: 15s

alerting:

  alertmanagers:

  - static_configs:

    - targets: []

    scheme: http

    timeout: 10s

    api_version: v1

scrape_configs:

- job_name: prometheus

  honor_timestamps: true

  scrape_interval: 15s

  scrape_timeout: 10s

  metrics_path: /metrics

  scheme: http

  static_configs:

  - targets:

    - localhost:9090

- job_name: springbootPrometheusGrafana

  honor_timestamps: true

  scrape_interval: 5s

  scrape_timeout: 5s

  metrics_path: /actuator/prometheus

  scheme: http

  static_configs:

  - targets:

    - 192.168.8.1:8080
访问SpringBoot的metrics_path: /actuator/prometheus
http://192.168.8.1:8080/actuator/prometheus
SpringBoot2.X&Prometheus使用的更多相关文章
- SpringBoot2配置prometheus浏览器访问404
背景:SpringBoot2的项目要配置 actuator + prometheus的健康检查,按照教程配置好之后再浏览器测试 http://localhost:port/prometheus 后40 ...
- SpringBoot2.x整合Prometheus+Grafana【附源码+视频】
图文并茂,新手入门教程,建议收藏 SpringBoot2.x整合Prometheus+Grafana[附源码+视频] 附源码+视频 目录 工程简介 简介 Prometheus grafana Spri ...
- Springboot2新特性概述
官方说明: https://github.com/spring-projects/spring-boot/wiki/Spring-Boot-2.0-Release-Notes 起码 JDK 8 和支持 ...
- Grafana+Prometheus打造springboot监控平台
1. 环境 springboot 1.5.10.RELEASE Grafana 5.4.2 Prometheus 2.6.0 jdk 1.8 2.通过micrometer与springboot应用和p ...
- 基于Docker+Prometheus+Grafana监控SpringBoot健康信息
在微服务体系当中,监控是必不可少的.当系统环境超过指定的阀值以后,需要提醒指定的运维人员或开发人员进行有效的防范,从而降低系统宕机的风险.在CNCF云计算平台中,Prometheus+Grafana是 ...
- 基于Prometheus搭建SpringCloud全方位立体监控体系
前提 最近公司在联合运维做一套全方位监控的系统,应用集群的技术栈是SpringCloud体系.虽然本人没有参与具体基础架构的研发,但是从应用引入的包和一些资料的查阅大致推算出具体的实现方案,这里做一次 ...
- 基于Prometheus和Grafana的监控平台 - 环境搭建
相关概念 微服务中的监控分根据作用领域分为三大类,Logging,Tracing,Metrics. Logging - 用于记录离散的事件.例如,应用程序的调试信息或错误信息.它是我们诊断问题的依据. ...
- 第七模块 :微服务监控告警Prometheus架构和实践
119.监控模式分类~1.mp4 logging:日志监控,Logging 的特点是,它描述一些离散的(不连续的)事件. 例如:应用通过一个滚动的文件输出 Debug 或 Error 信息,并通过日志 ...
- 3W字干货深入分析基于Micrometer和Prometheus实现度量和监控的方案
前提 最近线上的项目使用了spring-actuator做度量统计收集,使用Prometheus进行数据收集,Grafana进行数据展示,用于监控生成环境机器的性能指标和业务数据指标.一般,我们叫这样 ...
随机推荐
- 一个简单的创建xml方式
, matnr LIKE mara-matnr , maktx LIKE makt-maktx , END OF itab_matnr . , class LIKE m_wwgha-class,&qu ...
- JQuery 判断复选框是否选中
$("input").attr("checked") == "checked" or "undefined" $(&qu ...
- Spring Boot WebFlux整合mongoDB
引入maven文件 <dependency> <groupId>org.springframework.boot</groupId> <artifactId& ...
- 【Day1】1.了解Python
视频地址(全部) https://edu.csdn.net/course/detail/26057 课件地址(全部) https://download.csdn.net/download/gentl ...
- Asp.Net Zero轻量级审核流设计
复杂的业务系统中往往会集成工作流或审核流,但有些轻量及的业务系统对这些功能的需求并不大,有的系统甚至只需要审核功能就够了.这里给大家介绍在Asp.Net Zero中通用轻量及审核流设计,功能具备审核权 ...
- QTP(9)
常用的Windows控件 WinEdit---Set "数据值" SetSecure "加密数值" WinButton---Click WinComboBox- ...
- P4149 距离为K的点对(最少边数) n=200000 点分治
这题数据范围变成了200000 n^2就过不了 同时要求求的是最少的边数 不能容斥 #include<bits/stdc++.h> using namespace std; ; ; ], ...
- want
2-SAT POJ3683 操作树 仙人掌 HDU3594 平衡树 916D 可持久化Trie https://www.cnblogs.com/jszkc/p/7309468.html Lindstr ...
- (五) 结构化查询语言SQL——3
4. 数据更新 1)增 对应INSERT语句.格式为INSERT INTO T[(A1,…,Ak)] VALUES (C1,…,Ck),其中A代表表T的属性,C代表常量,A可以缺省,此时C必须严格按 ...
- 如何判断元素是否在可视区域ViewPort
个性签名: 生如夏花,逝如冬雪:人生如此,何悔何怨. 前言: 经常需要计算元素的大小或者所在页面的位置,offsetWidth,clientWidth,scrollWidth,scrollTop这几个 ...