matplotlib实现三维柱状图
matplotlib实现三维柱状图
import cv2
img = cv2.imread("1.png", 0)
#特征点在图片中的坐标位置
m = 448
n = 392
import numpy as np
import matplotlib.pyplot as plt
# This import registers the 3D projection, but is otherwise unused.
from mpl_toolkits.mplot3d import Axes3D # noqa: F401 unused import
# setup the figure and axes
fig = plt.figure(figsize=(10, 5)) # 画布宽长比例
ax1 = fig.add_subplot(121, projection='3d')
ax2 = fig.add_subplot(122, projection='3d')
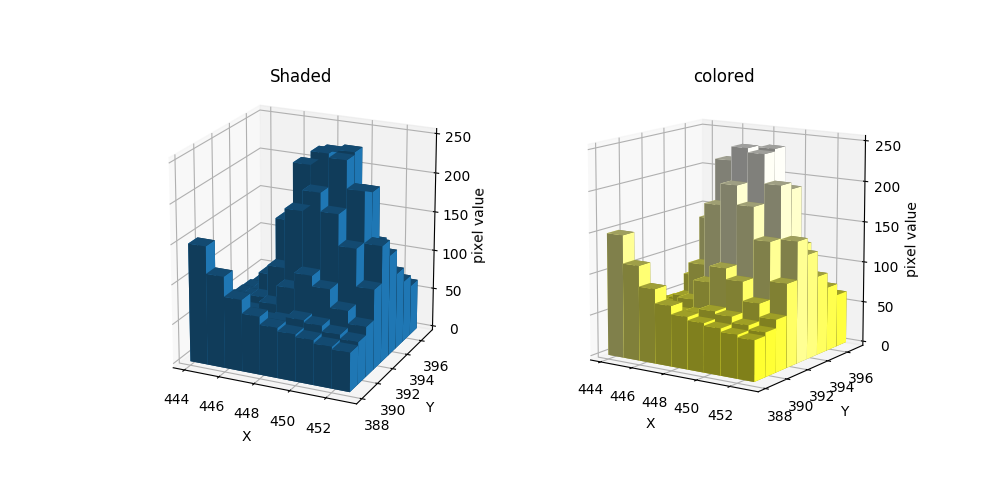
ax1.set_title('Shaded')
ax2.set_title("colored")
# fake data
_x = np.arange(444, 453)
_y = np.arange(388, 397)
_xx, _yy = np.meshgrid(_x, _y)
x, y = _xx.ravel(), _yy.ravel()#ravel扁平化
# 函数
top = []
for i in range(-4, 5):
for j in range(-4, 5):
top.append(img[i+n][j+m])
bottom = np.zeros_like(top)#每个柱的起始位置
width = depth = 1#x,y方向的宽厚
ax1.bar3d(x, y, bottom, width, depth, top, shade=True) #x,y为数组
ax1.set_xlabel('X')
ax1.set_ylabel('Y')
ax1.set_zlabel('pixel value')
for i in range(-4, 5):
for j in range(-4, 5):
z = img[i+n][j+m] #该柱的高
color = np.array([255, 255, z])/255.0#颜色 其中每个元素在0~1之间
ax2.bar3d(j+m, i+n, 0, width, depth, z, color=color) #每次画一个柱
ax2.set_xlabel('X')
ax2.set_ylabel('Y')
ax2.set_zlabel('pixel value')
plt.show()
以上程序将特征点周围四个像素的像素点三维化,ax1用数组的方式画柱状图,同时绘制多个柱。ax2用数值的方式画柱状图,每次画一个柱。
结果:
matplotlib实现三维柱状图的更多相关文章
- Python学习(一) —— matplotlib绘制三维轨迹图
在研究SLAM时常常需要对其输出的位姿进行复现以检测算法效果,在ubuntu系统中使用Python可以很好的完成相关的工作. 一. Ubuntu下Python的使用 在Ubuntu下使用Python有 ...
- Python使用matplotlib绘制三维曲线
本文主要演示如何使用matplotlib绘制三维图形 代码如下: # -*- coding: UTF-8 -*- import matplotlib as mpl from mpl_toolkits. ...
- 机器学习-Matplotlib绘图(柱状图,曲线图,点图)
matplotlib 作为机器学习三大剑客之一 ,比热按时无比强大的 matplotlib是绘图库,所以呢我就分享一下简单的绘图方式 #柱状图 #导报 柱状图 import matplotlib. ...
- 使用matplotlib 制图(柱状图、箱型图)
柱状图: import pandas as pd import matplotlib.pyplot as plt data = pd.read_csv('D:\\myfiles\\study\\pyt ...
- matplotlib绘制三维图
本文参考官方文档:http://matplotlib.org/mpl_toolkits/mplot3d/tutorial.html 起步 新建一个matplotlib.figure.Figure对象, ...
- matplotlib表面三维图
1.basic numpy.meshgrid 由一维数组到二维数组,用于生成网格数据 matplotlib python绘图库 2.code In [88]: from mpl_toolkits.mp ...
- 用Matplotlib画三维图片的一个实例
from mpl_toolkits.mplot3d import Axes3D import matplotlib.pyplot as plt import numpy as np from matp ...
- matplotlib 中的柱状图
def drawBar(): pyplot.bar(range(5),[100,200,300,400,400]) pyplot.xticks(range(5),['A','B','C','D','E ...
- matplotlib 柱状图 Bar Chart 样例及参数
def bar_chart_generator(): l = [1,2,3,4,5] h = [20, 14, 38, 27, 9] w = [0.1, 0.2, 0.3, 0 ...
随机推荐
- Python打杂之路
1.任务要落到纸上好记性不如烂笔头,再好的记性也不如写到纸上明确无误,写到纸上就不用担心会漏掉哪项工作.平时,我们总是在忙着一项工作的同时还惦记着下一项工作,把工作都记下后,我们就可以专注于一项工作, ...
- linux下给php安装memcached及memcache扩展(转)
http://kimi.it/257.html (另外的方法)linux安装memcached及memcache扩展一.安装libevent函数库下载地址:http://libevent.org默认被 ...
- [Jmeter]通过批处理调用java,java从CSV动态读取登录的用户名和密码,并将其作为参数组合成字符串,写入外部.bat文件,然后通过Java执行这个外部批处理文件
问题1:怎样通过批处理调用java代码? 问题2:怎样通过java从CSV文件获取到用户名和密码存入变量? 问题3:怎样将获取到的用户名和密码组合成字符串,写入外部批处理文件? 问题4:怎样在批处理文 ...
- 深入浅出 JMS(一) - JMS 基本概念
深入浅出 JMS(一) - JMS 基本概念 一.JMS 是个什么鬼 JMS 是 Java Message Service 的简称,即 Java 消息服务.什么是消息服务呢,我们来看一下 Oracle ...
- 第十届Mockplus ▪ UXPA用户体验西南赛区决赛成功举行
九月的重庆,秋意渐浓. 伴随着凉爽的秋风,第十届Mockplus·UXPA国际用户体验创新大赛(UXD Award2018)西南赛区决赛于9月16日下午在四川美术学院-虎溪校区成功举办.来自西南区域各 ...
- Task构造
//原文:http://www.tuicool.com/articles/IveiQbQ 创建并且初始化Task 使用lambda表达式创建Task Task.Factory.StartNew(() ...
- 让IIS 7 如同IIS 8 第一次请求不变慢
当我们把网站部署在IIS7或IIS6S的时候,每当IIS或是Application Pool重启后,第一次请求网站反应总是很慢,原因大家都知道(不知道可以参考这个动画说明ASP.NET网页第一个Req ...
- Linux shell脚本的字符串截取
http://blog.csdn.net/gumanren/article/details/5601544 Linux 的字符串截取很有用.有八种方法. 假设有变量 var=http://www.ha ...
- 前端之JavaScript笔记4
一 按键事件 <!DOCTYPE html> <html lang="en"> <head> <meta charset="UT ...
- Linux下安装配置 Jdk1.6+Tomcat6+Apache2.2.x+jk_mod1.2 详解
本篇以Redhat AS5,内核为Linux 2.6.18-8.el5 为例,其中Redhat/Fedora系列基本一致,其他Linux或者版本均可以参考. STEP 1 软件下载:1. jdk1.6 ...