[转帖]Active Session History (ASH)
- Introduction
- V$ACTIVE_SESSION_HISTORY
- DBA_HIST_ACTIVE_SESS_HISTORY
- Enterprise Manager Performance Pages
- ASH Report
- SQL Developer and ASH Reports
- ASH Viewer
Related articles.
- Automatic Workload Repository (AWR) in Oracle Database 10g
- AWR Baseline Enhancements in Oracle Database 11g Release 1
- Automatic Database Diagnostic Monitor (ADDM) in Oracle Database 10g
- Active Session History (ASH) Analytics in Oracle Enterprise Manager Cloud Control 12c
Introduction
For a long time DBAs have been encouraged to use variations on the YAPP method of performance tuning, which focuses on wait event monitoring, rather than hit ratios. Tools like Statspack, AWR, ADDM and SQL Trace are all very useful for gathering wait event information during tuning, but they tend to focus on looking back at what has happened, rather than what is currently happening. The [G]V$ dynamic performance views provide masses of real-time information, but it can be difficult for beginners and experienced people alike to make good use of this information.
Oracle 10g introduced the Active Session History (ASH) as part of the Diagnostics and Tuning Pack. It samples information from the [G]V$ views allowing you to see current and historical information about active sessions on the database.
Being part of the Diagnostics and Tuning Pack means ASH is only available as a paid option on top of Oracle Database Enterprise Edition.
V$ACTIVE_SESSION_HISTORY
Samples of wait event information are taken once per second and made available using the V$ACTIVE_SESSION_HISTORY view. An active session is one that is waiting on CPU or any event that does not belong to the "Idle" wait class at the time of the sample. The sample information is written to a circular buffer in the SGA, so the greater the database activity, the less time the information will remain available for.
The V$ACTIVE_SESSION_HISTORY view is essentially a fact table, which can be linked to a number of dimensions to provide statistics specific to a variety of things including SQL statements, execution plans, objects, wait events, sessions, modules, actions, client identifiers, services and consumer groups etc. This makes it an incredibly flexible way of identifying what active sessions are doing, or have done. For example, if I wanted to see the main activity on the database for the last 5 minutes, I could use the following query.
SELECT NVL(a.event, 'ON CPU') AS event,

       COUNT(*) AS total_wait_time

FROM   v$active_session_history a

WHERE  a.sample_time > SYSDATE - 5/(24*60) -- 5 mins

GROUP BY a.event

ORDER BY total_wait_time DESC;

EVENT                                                            TOTAL_WAIT_TIME

---------------------------------------------------------------- ---------------

db file sequential read                                                      750

log file parallel write                                                       43

log file sync                                                                 42

db file parallel read                                                         32

control file sequential read                                                  22

ON CPU                                                                        21

db file parallel write                                                        21

log file switch (private strand flush incomplete)                              8

Disk file operations I/O                                                       1

control file parallel write                                                    1

buffer busy waits                                                              1

11 rows selected.

SQL>
Notice how the count of the samples is used to determine the time waited, not the WAIT_TIME or TIME_WAITED columns. Why is this done? Remember, this is sample data, so wait times are accumulating with each sample. Merely summing them will give a falsely high value. To explain this, imagine simplified case where a single session is waiting on "db file sequential read" for 5 seconds. That means we would have 5 samples, that may look like this.
EVENT                   SAMPLE_ID TIME_SEC

======================= ========= ========

db file sequential read         1        1

db file sequential read         2        2

db file sequential read         3        3

db file sequential read         4        4

db file sequential read         5        5
We know the total wait time is 5 seconds. If we count the number of samples, we get 5, which we equate to 5 seconds. If we sum the time for all 5 samples get 15 seconds.
The time columns in the ASH data are a little more complicated than they first appear, so check the documentation when using them. Incorrect usage of these columns is probably the most common mistake people make when using ASH views.
The fact ASH uses samples can of course mean certain bits of information slip through the net, but this is not really a problem. The chances are your main concerns will be those sessions or statements that are taking lots of time. The longer things take to run, the more samples they are likely to be picked up in. It is unlikely that anything of major concern will completely fail to register in the ASH views, but that doesn't mean you can ignore its limitations.
DBA_HIST_ACTIVE_SESS_HISTORY
To allow for historical access to the ASH data, one in ten samples are persisted to disk and made available using the DBA_HIST_ACTIVE_SESS_HISTORY view. So this is a sample of a sample. Using this view is similar to using the V$ACTIVE_SESSION_HISTORY view, but remember the sample time is now 10 seconds, so use (count*10) to measure time, rather than just the count.
SELECT NVL(a.event, 'ON CPU') AS event,

       COUNT(*)*10 AS total_wait_time

FROM   dba_hist_active_sess_history a

WHERE  a.sample_time > SYSDATE - 1

GROUP BY a.event

ORDER BY total_wait_time DESC;

EVENT                                                            TOTAL_WAIT_TIME

---------------------------------------------------------------- ---------------

db file sequential read                                                     3860

ON CPU                                                                      1500

control file sequential read                                                 990

direct path read temp                                                        580

direct path read                                                             560

log file parallel write                                                      280

db file parallel write                                                       270

Disk file operations I/O                                                     240

log file switch completion                                                   150

log file sync                                                                130

db file parallel read                                                        130

.

.

.

26 rows selected.

SQL>
Enterprise Manager Performance Pages
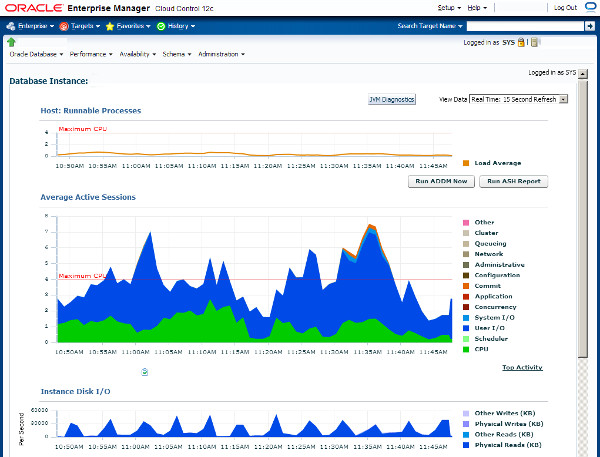
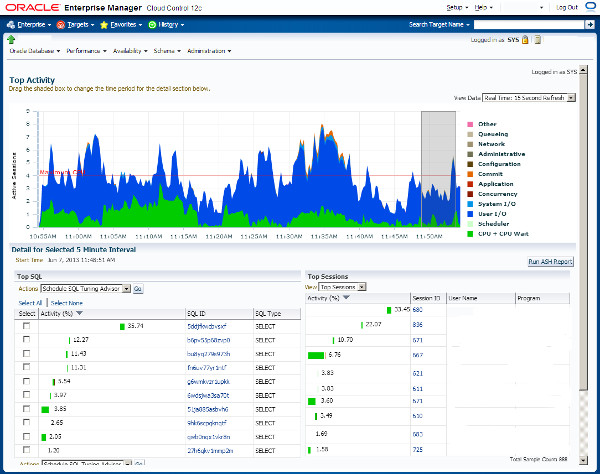
Accessing the ASH information directly can be very useful, but there are a number of more efficient ways to get to some of this information. The performance pages of Enterprise Manager (Grid Control and Cloud Control) are fantastic. They are based on the ASH information, giving you easy access to real-time and historical performance information.
The following picture is an example of the Enterprise Manager performance home page.
An example of the Top activity page is shown below.
ASH Report
ASH reports can be displayed using Enterprise Manager, or generated from SQL*Plus. To manually generate them using SQL*Plus, run the following script, while logged in as a privileged user.
$ORACLE_HOME/rdbms/admin/ashrpt.sql
The script prompts you for the following details:
- Report Type: [ html | text ]
- Instance number: [all | n ] - On single instance databases, this defaults to "1". On RAC databases you can report on a specific instance number or "all" instances.
- Begin Time: The script describes the formats for this value. It can be an explicit date string or an offset of the current datetime. The default is -15 minutes.
- Duration: The number of minutes to report on. The default duration is (SYSDATE - begin_time).
- Report Name: A default name is provided. Change this if required.
The script produces either text or HTML output as requested. Examples of these are shown below.
Depending on the options selected, the ASH report scripts call one of several table functions from the DBMS_WORKLOAD_REPOSITORY package.
ASH_REPORT_TEXTASH_REPORT_HTMLASH_GLOBAL_REPORT_TEXTASH_GLOBAL_REPORT_HTML
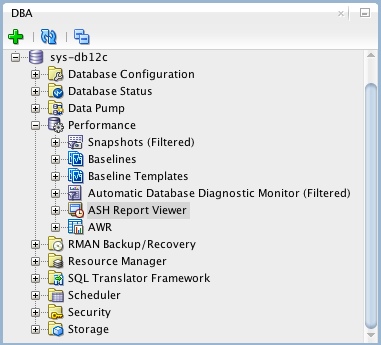
SQL Developer and ASH Reports
If you are using SQL Developer 4 onward, you can view ASH reports directly from SQL Developer. If it is not already showing, open the DBA pane "View > DBA", expand the connection of interest, then expand the "Performance" node. The ASH reports are available from the "ASH Reports Viewer" node.
ASH Viewer
The ASH Viewer tool gives a graphical view of active session history data within the Oracle instance. Interestingly, it is supports Oracle 8i onward. In releases prior to Oracle 10g, or if you don't have a Diagnostic and Tuning Pack license, you can connect using the "Standard" connection and the tool will mimic the functionality of ASH. If you have the necessary licenses, you can make "Enterprise" connections, which use ASH to provide the data.
For more information see:
- Active Session History
- V$ACTIVE_SESSION_HISTORY
- DBA_HIST_ACTIVE_SESS_HISTORY
- Generating Active Session History Reports
- Automatic Workload Repository (AWR) in Oracle Database 10g
- AWR Baseline Enhancements in Oracle Database 11g Release 1
- Automatic Database Diagnostic Monitor (ADDM) in Oracle Database 10g
- Active Session History (ASH) Analytics in Oracle Enterprise Manager Cloud Control 12c
Hope this helps. Regards Tim...
[转帖]Active Session History (ASH)的更多相关文章
- Active Session History (ASH) Performed An Emergency Flush Messages In The Alert Log
Active Session History (ASH) Performed An Emergency Flush Messages In The Alert Log (文档 ID 1385872.1 ...
- Session History 属性和方法
History 接口允许操作浏览器的曾经在标签页或者框架里访问的会话历史记录. js通过window.history来访问和操作的,操作的范围是某个tab的会话历史记录. 这个tab打开后,tab内的 ...
- Design Doc: Session History for Out-of-Process iframes
Design Doc: Session History for Out-of-Process iframes Charlie Reis, May 2014 This document outlines ...
- [转帖]linux 清空history以及记录原理
linux 清空history以及记录原理 自己的linux 里面总是一堆 乱七八槽输错的命令 用这个办法 可以清空 linux的内容. 清爽一些. 1.当前session执行的命令,放置缓存中,执行 ...
- 查找当前SQL Server下的Active Session正连接着哪个数据库
今天碰到个事.原本想把数据库设为单用户模式然后把REMOVE FILE.没想到悲剧了.因为很多进程都是需要远程连接这个库,导致别的进程抢在我前面连接了这个数据库,反到我连不上了.想把数据库切回MULT ...
- Oracle性能调整ASH,AWR,ADDM
ASH (Active Session History)ASH以V$SESSION为基础,每秒采样一次,记录活动会话等待的事件.不活动的会话不会采样,采样工作由新引入的后台进程MMNL来完成.ASH ...
- ORACLE等待事件:read by other session
read by other session简介 官方关于read by other session的介绍如下: When information is requested from the datab ...
- ORACLE 10g AWR报告设置总结
1:查看.修改AWR报告快照数据的采样间隔.保存策略 SQL> COL DBID FOR 999999999999 SQL> COL SNAP_INTERVAL FOR A26 SQL ...
- ocp11g培训内部教材_053课堂笔记(043)_数据备份
053:数据库高级管理: 目录 第一部分:数据库备份与恢复... 4 第一章:备份恢复概述... 4 1.1 备份的意义: 4 1.2 数据库故障的类型:... 4 1.3 制定你的备份和恢复的计划. ...
- Database hang and Row Cache Lock concurrency troubleshooting
http://www.dadbm.com/database-hang-row-cache-lock-concurrency-troubleshooting/ Issue backgroundThis ...
随机推荐
- struts2 Filter中无法转发请求
struts2 Filter中无法转发请求 项目升级struts2版本为最新以修复漏洞,由于一些历史原因,部分访问在升级后访问404,直接对历史代码改造代价太大. 于是使用拦截器对其转发.重定向,但是 ...
- Asp .Net Core系列:Exceptionless简介和部署(Windows、Linux、Docker)
目录 一.简介 二.版本 三.运行说明 1.Exceptionless 2.Elasticsearch 3.Exceptionless.UI 四.打包Exceptionless.UI 五.window ...
- LeetCode206反转链表、24两两交换节点
206. 反转链表 反转一个单链表. 示例: 输入: 1->2->3->4->5->NULL 输出: 5->4->3->2->1->NULL ...
- 【福利活动】华为云“上云之路”征文大赛开启,FreeBuds3无线耳机等重磅好礼送不停
各位关注华为云的开发者们,达嘎猴啊~ 今天带给你们一个好消息,大家心心念念的华为云"上云之路"征文大赛已经正式开启啦. 举办本次华为云"上云之路"征文大赛的目的 ...
- PPT 稳妥选用字体
字体怎么选 商务报告PPT字体怎么选 广告宣传PPT字体怎么选 发布会PPT字体怎么选 教学课件PPT字体怎么选--小学以下 教学课件PPT字体怎么选--中学以上 印刷阅读PPT字体怎么选--数据公司 ...
- 创建一个简单的Docker镜像
1. 创建 Dockerfile 文件.index.html测试页面 [root@localhost docker]# vi Dockerfile FROM nginx:1.17.6 #基于 ngin ...
- pod内部网络实现
k8s主题系列: 一.k8s网络之设计与实现 二.k8s网络之pod内部网络 三.k8s网络之Flannel网络 四.k8s网络之Calico网络 pod特性 Pod 是 K8S 的最小工作单元.每个 ...
- 【JAVA基础】Swagger使用
Swagger使用 刷新权限 自定标签名称
- <vue 路由 3、路由代码跳转>
说明:在上一节的工程下继续讲解 一. 知识点说明 业务开发中更多的是使用代码方式进行页面的跳转会用到this.$router.push('/') 和this.$router.replace(' ...
- 深度学习(三)——Transforms的使用
一.Transforms的结构及用法 导入transforms from torchvision import transforms 作用:图片输入transforms后,可以得到一些预期的变换 1. ...