prometheus学习系列十一: Prometheus 采集器的编写
在前面的文章已经写了官方的几个exporter的使用了。 在实际使用环境中,我们可能需要收集一些自定义的数据, 这个时候我们一般是需要自己编写采集器的。
快速入门编写一个入门的demo
编写代码
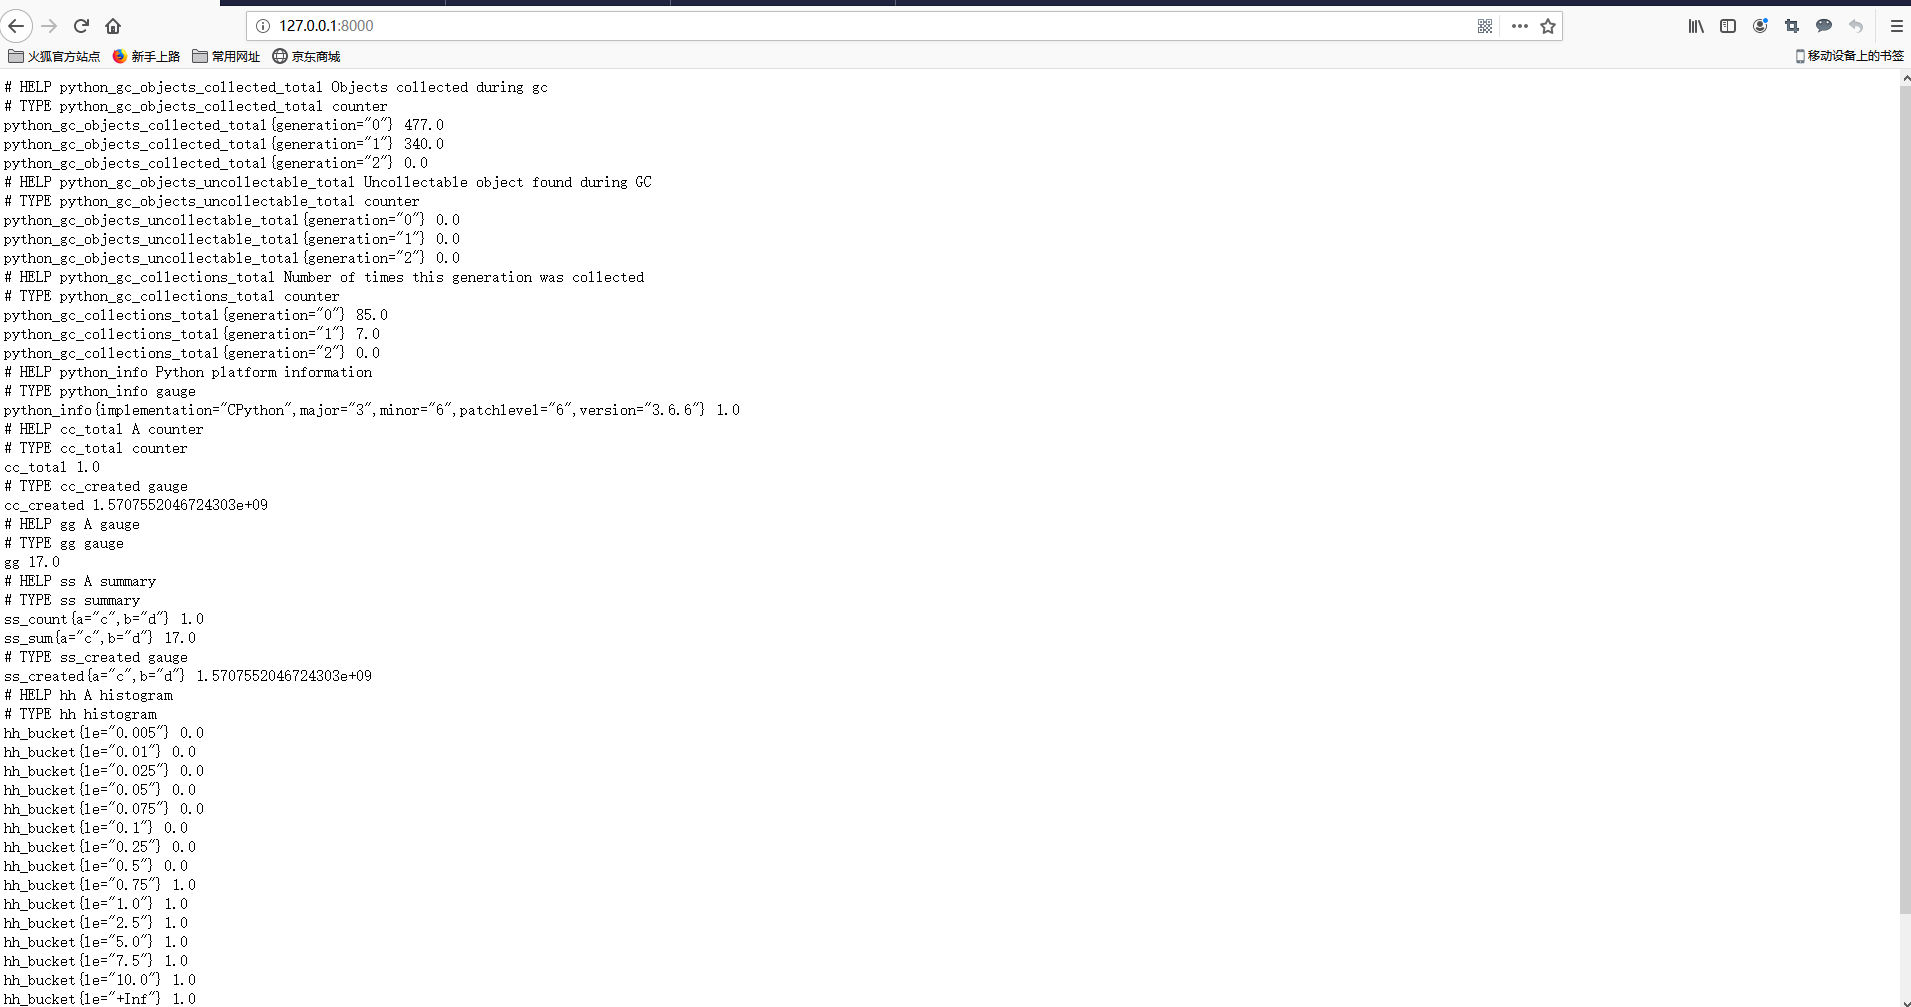
from prometheus_client import Counter, Gauge, Summary, Histogram, start_http_server

# need install prometheus_client

if __name__ == '__main__':

    c = Counter('cc', 'A counter')

    c.inc()

    g = Gauge('gg', 'A gauge')

    g.set(17)

    s = Summary('ss', 'A summary', ['a', 'b'])

    s.labels('c', 'd').observe(17)

    h = Histogram('hh', 'A histogram')

    h.observe(.6)

    start_http_server(8000)

    import time

    while True:

        time.sleep(1)
只需要一个py文件, 运行起来, 会监听在8000端口,访问127.0.0.1:8000端口。
效果图
其实一个导出器就已经写好了, 就是这么简单的,我们只需要在prometheus配置来采集对应的导出器就可以了。 不过我们的导出的数据都是没有实际意义了。
数据类型介绍
Counter 累加类型, 只能上升,比如记录http请求的总数或者网络的收发包累计值。
Gauge: 仪表盘类型, 适合有上升有下降的, 一般网络流量,磁盘读写这些,会有波动和变化的采用这个数据类型。
Summary: 基于采样的,在服务端完成统计。我们在统计平均值的时候,可能以为某个值异常导致计算平均值不能准确反映实际值, 就需要特定的点位置。
Histogram: 基于采样的,在客户端完成统计。我们在统计平均值的时候,可能以为某个值异常导致计算平均值不能准确反映实际值, 就需要特定的点位置。
采集内存使用数据
编写采集类代码
from prometheus_client.core import GaugeMetricFamily, REGISTRY

from prometheus_client import start_http_server

import psutil

class CustomMemoryUsaggeCollector():

    def format_metric_name(self):

        return 'custom_memory_'

    def collect(self):

        vm = psutil.virtual_memory()

        #sub_metric_list = ["free", "available", "buffers", "cached", "used", "total"]

        sub_metric_list = ["free", "available", "used", "total"]

        for sub_metric in sub_metric_list:

            gauge = GaugeMetricFamily(self.format_metric_name() + sub_metric, '')

            gauge.add_metric(labels=[], value=getattr(vm, sub_metric))

            yield gauge

if __name__ == "__main__":

    collector = CustomMemoryUsaggeCollector()

    REGISTRY.register(collector)

    start_http_server(8001)

    import time

    while True:

        time.sleep(1)
暴露数据情况

部署代码和集成prometheus
# 准备python3 环境 参考: https://virtualenvwrapper.readthedocs.io/en/latest/

yum install python36 -y

 pip3 install virtualenvwrapper

vim /usr/local/bin/virtualenvwrapper.sh

# 文件最前面添加如下行

# Locate the global Python where virtualenvwrapper is installed.

VIRTUALENVWRAPPER_PYTHON="/usr/bin/python3"

# 文件生效

source /usr/local/bin/virtualenvwrapper.sh

# 配置workon

[root@node01 ~]# echo "export WORKON_HOME=~/Envs" >>~/.bashrc

[root@node01 ~]# mkvirtualenv  custom_memory_exporter

(custom_memory_exporter) [root@node01 ~]# pip install prometheus_client psutil

yum install python36-devel

(custom_memory_exporter) [root@node01 ~]# chmod a+x custom_memory_exporter.py

(custom_memory_exporter) [root@node01 ~]# ./custom_memory_exporter.py

# 测试是否有结果数据

[root@node00 ~]# curl http://192.168.100.11:8001/

prometheus.yml 加入如下片段
  - job_name: "custom-memory-exporter"
    static_configs:
    - targets: ["192.168.100.11:8001"]

[root@node00 prometheus]# systemctl restart prometheus
[root@node00 prometheus]# systemctl status prometheu
查询效果图

prometheus学习系列十一: Prometheus 采集器的编写的更多相关文章
- prometheus学习系列十一: Prometheus pushgateway的使用
由于网络问题或者安全问题,可能我们的数据无法直接暴露出一个entrypoint 给prometheus采集. 这个时候可能就需要一个pushgateway来作为中间者完成中转工作. promethe ...
- prometheus学习系列十一: Prometheus 安全
prometheus安全 我们这里说的安全主要是基本认证和https2种, 目前这2种安全在prometheus中都没有的, 需要借助第三方软件实现, 这里以nginx为例. 基本认证 配置基本认证 ...
- prometheus学习系列十一: Prometheus exporter详解
exporter详解 前面的系列中,我们在主机上面安装了node_exporter程序,该程序对外暴露一个用于获取当前监控样本数据的http的访问地址, 这个的一个程序成为exporter,Expor ...
- prometheus学习系列十一: Prometheus和AlertManager的高可用
前面的系列中, prometheus和alertmanager都是单机部署的,会有单机宕机导致系统不可用情况发生.本文主要介绍下prometheus和alertmanager的高可用方案. 服务的高可 ...
- prometheus学习系列十一: Prometheus 报警规则配置
prometheus监控系统的的报警规则是在prometheus这个组件完成配置的. prometheus支持2种类型的规则,记录规则和报警规则, 记录规则主要是为了简写报警规则和提高规则复用的, 报 ...
- Prometheus学习系列(九)之Prometheus 联盟、迁移
前言 本文来自Prometheus官网手册 和 Prometheus简介 FEDERATION 允许Prometheus服务器从另一台Prometheus服务器抓取选定的时间序列. 一,用例 联盟有不 ...
- Prometheus学习系列(六)之Prometheus 查询说明
前言 本文来自Prometheus官网手册和 Prometheus简介 Prothetheus查询 Prometheus提供一个函数式的表达式语言PromQL (Prometheus Query La ...
- Prometheus学习系列(五)之Prometheus 规则(rule)、模板配置说明
前言 本文来自Prometheus官网手册1.2.3.4和 Prometheus简介1.2.3.4 记录规则 一.配置规则 Prometheus支持两种类型的规则,这些规则可以定期配置,然后定期评估: ...
- Prometheus学习系列(二)之Prometheus FIRST STEPS
前言 本文来自Prometheus官网手册 和 Prometheus简介 说明 Prometheus是一个监控平台,通过在监控目标上的HTTP端点来收集受监控目标的指标.本指南将向您展示如何使用Pro ...
随机推荐
- Splay的基本操作(插入/删除,查询)
Splay的基本操作(插入/删除,查询) 概述 这是一棵二叉查找树 让频繁访问的节点尽量靠近根 将查询,插入等操作的点"旋转"至根 树的高度均摊为$log_n$ 变量 int ro ...
- Python语言基础考察点:python语言基础常见考题(一)
一.python是静态还是动态类型?是强类型还是弱类型? 1.动态强类型语言(不少人误以为是弱类型) 不要傻傻分不清 2.动态还是静态指的是编译期还是运行期确定类型 3.强类型指的是不会发生隐式类型转 ...
- ES6基础-ES6的扩展
进行对字符串扩展,正则扩展,数值扩展,函数扩展,对象扩展,数组扩展. 开发环境准备: 编辑器(VS Code, Atom,Sublime)或者IDE(Webstorm) 浏览器最新的Chrome 字符 ...
- Centos开发小计
1. 生成静态库,linux下库的规则是lib开头 g++ -c code.cpp ar cr libcode.a code.o
- mysql统计当前月和近30天每天的数据
1,当前月 SELECT DATE_FORMAT(check_time,'%Y-%m-%d') as time, COUNT(*) FROM dw_rule WHERE check_state = 3 ...
- 【视频开发】【计算机视觉】相机标定(Camera calibration)《二》
简介 摄像机标定(Camera calibration)简单来说是从世界坐标系换到图像坐标系的过程,也就是求最终的投影矩阵 P 的过程,下面相关的部分主要参考UIUC的计算机视觉的课件(网址Sprin ...
- winform 通用自动更新程序
通用自动更新程序 主要功能: 1. 可用于 C/S 程序的更新,集成到宿主主程序非常简单和配置非常简单,或不集成到主程序独立运行. 2. 支持 HTTP.FTP.WebService等多种更新下载方式 ...
- MySql Packet for query is too large问题解决方案
MySQL会限制Server接受的数据包大小.有时候插入.更新或查询时数据包的大小,会受 max_allowed_packet 参数限制,导致操作失败.报错信息为: Caused by: com.my ...
- 『7.3 NOIP模拟赛题解』
T1 gift Description 夏川的生日就要到了.作为夏川形式上的男朋友,季堂打算给夏川买一些生日礼物. 商店里一共有种礼物.夏川每得到一种礼物,就会获得相应喜悦值Wi(每种礼物的喜 ...
- 揭秘丨7分钟看懂华为云鲲鹏Redis背后的自研技术【华为云技术分享】
2019年5月,华为云发布全球首个基于自研ARM架构的分布式缓存鲲鹏Redis,搭载华为LibOS+华为编译器+安全容器引擎三项黑科技,在保证Redis强劲高性能外,还降低客户30%的使用成本,真正实 ...