
监控命令之tsar
1.1 tsar是什么?
tsar是淘宝自己开发的一个采集工具(类似于sar工具),主要用来收集服务器的系统信息(如cpu,io,mem,tcp等),以及应用数据(如squid haproxy nginx等)。
收集到的数据存储在磁盘上,可以随时查询历史信息,输出方式灵活多样,另外支持将数据存储到mysql中,也可以将数据发送到nagios报警服务器。
tsar在展示数据时,可以指定模块,并且可以对多条信息的数据进行merge输出,带--live参数可以输出秒级的实时信息。
tsar可以通过编写模块轻松扩展,这使得它成为一个功能强大且多功能的报告工具。
github地址:https://github.com/alibaba/tsar
1.1.1 总体架构
tsar是基于模块化设计的程序,程序有两部分组成:框架和模块。
框架程序源代码主要在src目录,而模块源代码主要在modules目录中。
框架提供对配置文件的解析,模块的加载,命令行参数的解析,应用模块的接口对模块原始数据的解析与输出。 模块提供接口给框架调用。
tsar依赖与cron每分钟执行采集数据,因此它需要系统安装并启用crond,安装后,tsar每分钟会执行tsar --cron来定时采集信息,并且记录到原始日志文件。
1.1.2 tsar的运行流程图
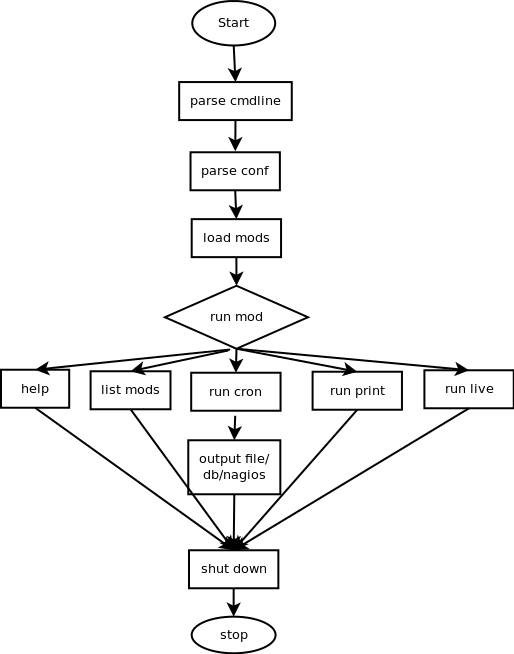
主要执行流程有:
(1)解析输入
根据用户的输入,初始化一些全局信息,如间隔时间,是否merge,是否指定模块,运行模式
(2)读取配置文件信息
主要解析tsar的配置文件,如果include生效,则会解析include的配置文件
配置文件用来获得tsar需要加载的模块,输出方式,每一类输出方式包含的模块,和此输出方式的接收信息,如mod_cpu on代表采集cpu的信息
output_interface file,nagios表示向文件和nagios服务器发送采集信息和报警信息
(3)加载相应模块
根据配置文件的模块开启关闭情况,将模块的动态库load到系统
(4)tsar的三种运行模式
tsar在运行的时候有三种模式:
print模式,仅仅输出指定的模块信息,默认显示最近一天的;
live模式,是输出当前信息,可以精确到秒级
cron模式,此一般是crontab定时执行,每一分钟采集一次所有配置的模块信息,并将数据写入原始文件,在cron运行的时候 会判断是否配置输出到db或者nagios,如果配置则将相应格式的数据输出到对应接口。
(5)释放资源
程序最后,释放动态库,程序结束
1.2 tsar的安装
1.2.1 使用git下载源码包
可以访问alibaba的github找到tsar进行下载
$ git clone git://github.com/kongjian/tsar.git

$ cd tsar

$ make

# make install
1.2.2 下载zip文件并安装
访问连接地址,获取源码包,进行编译安装
$ wget -O tsar.zip https://github.com/alibaba/tsar/archive/master.zip --no-check-certificate

$ unzip tsar.zip

$ cd tsar

$ make

# make install
1.2.3 目录文件说明
安装后,您可能会看到这些文件:
/etc/tsar/tsar.conf,这是tsar的主要配置文件;

/etc/cron.d/tsar,用于每分钟运行tsar收集信息;

/etc/logrotate.d/tsar 将每个月轮询tsar的日志文件;

/usr/local/tsar/modules 是所有模块库(* .so)所在的目录;

/usr/local/man/man8/ 帮助文件
1.2.4 tsar配置文件说明
[root@clsn6 tsar]# cat /etc/tsar/tsar.conf

####debug_level(INFO DEBUG WARN ERROR FATAL)

debug_level ERROR  #指定tsar的运行级别,主要用来调试使用

####[module]  ##on/off to enable mod

mod_cpu on

mod_mem on

mod_swap on

mod_tcp on

mod_udp on

mod_traffic on

mod_io on

mod_pcsw on

mod_partition on

mod_tcpx on

mod_load on

mod_apache off

mod_lvs off

mod_haproxy off

mod_squid off

mod_nginx off

mod_nginx_multiport off

mod_nginx_live off

#mod_nginx_sys_mport on 80 8080

mod_swift off

mod_swift_code off

mod_swift_domain off

mod_swift_esi off

mod_swift_fwd off

mod_swift_store off

mod_swift_swapdir off

mod_swift_purge off

mod_swift_sys off

mod_swift_tcmalloc off

mod_tmd off

mod_percpu off

mod_tcprt off

mod_proc off pidname

mod_pharos off

mod_tmd4 off

mod_keyserver off

#mod_erpc on /etc/tsar/erpc.conf

#mod_search on

####output_interface file,db,nagios

output_interface file   #设置输出类型,支持file,nagios,db

####[output_file] original data to store

output_file_path /var/log/tsar.data

####[output_stdio] these mod will be show as using tsar command  #设置用户终端默认显示的模块

output_stdio_mod mod_swap,mod_partition,mod_cpu,mod_mem,mod_lvs,mod_haproxy,mod_traffic,mod_squid,mod_load,mod_tcp,mod_udp,mod_tcpx,mod_apache,mod_pcsw,mod_io,mod_percpu

####[output_db]  #设置哪些模块输出到数据库

#output_db_mod mod_swap,mod_partition,mod_cpu,mod_mem,mod_traffic,mod_load,mod_tcp,mod_udp,mod_pcsw,mod_io

#output_db_addr console2:56677  #数据库的ip和端口

####[output_tcp]

#output_tcp_mod mod_swap,mod_cpu

#output_tcp_addr localhost:9666

#output_tcp_merge on

####support include other mod conf

include /etc/tsar/conf.d/*.conf

####The IP address or the host running the NSCA daemon

#server_addr nagios.server.com

####The port on which the daemon is running - default is 5667

#server_port 8086

####The cycle of send alert to nagios

#cycle_time 300  #指定上报的间隔时间,由于tsar每一分钟采集一次,上报时会判断是否符合时间间隔,如设置300的话,则在0,5等整点分钟会上报

####nsca client program

#send_nsca_cmd /usr/bin/send_nsca

#send_nsca_conf /home/a/conf/amon/send_nsca.conf

####tsar mod alert config file

####threshold servicename.key;w-min;w-max;c-min;cmax;

#threshold cpu.util;N;N;N;N;

#设置某个要报警项的阀值,前面是模块和要监控的具体名称,后面的四个数据代表报警的范围,warn和critical的范围。
1.3 tsar的使用
查看使用帮助
[root@clsn6 tsar]# tsar --help

Usage: tsar [options]

Options:

    -check         display last record for alert #检查显示警报的最后记录

    --check/-C     display last record for alert.example:tsar --check / tsar --check --cpu --io

    --watch/-w     display last records in N mimutes. example:tsar --watch 30 / tsar --watch 30 --cpu --io

    --cron/-c      run in cron mode, output data to file

    --interval/-i  specify intervals numbers, in minutes if with --live, it is in seconds  #指定间隔数字,如果使用--live,则以分钟为单位,以秒为单位

    --list/-L      list enabled modules

    --live/-l      running print live mode, which module will print

    --file/-f      specify a filepath as input

    --ndays/-n     show the value for the past days (default: 1)

    --date/-d      show the value for the specify day(n or YYYYMMDD)

    --merge/-m     merge multiply item to one

    --detail/-D    do not conver data to K/M/G  #不会将数据转换为K / M / G

    --spec/-s      show spec field data, tsar --cpu -s sys,util

    --item/-I      show spec item data, tsar --io -I sda

    --help/-h      help

Modules Enabled:

    --cpu               CPU share (user, system, interrupt, nice, & idle)

    --mem               Physical memory share (active, inactive, cached, free, wired)

    --swap              swap usage

    --tcp               TCP traffic     (v4)

    --udp               UDP traffic     (v4)

    --traffic           Net traffic statistics

    --io                Linux I/O performance

    --pcsw              Process (task) creation and context switch

    --partition         Disk and partition usage

    --tcpx              TCP connection data

    --load              System Run Queue and load average
1.3.1 常用命令
#以1秒钟为间隔,实时打印tsar的概述数据
[root@clsn6 tsar]#  tsar -i 1 -l

Time              ---cpu-- ---mem-- ---tcp-- -----traffic---- --sda---  ---load-

Time                util     util   retran    bytin  bytout     util     load1

04/06/18-21:09:22   0.00    18.48     0.00    60.00  278.00     0.00     0.00

04/06/18-21:09:23   1.96    18.48     0.00    60.00  198.00     0.00     0.00

04/06/18-21:09:24   0.00    18.48     0.00    60.00  198.00     0.00     0.00

04/06/18-21:09:25   0.00    18.48     0.00    60.00  198.00     0.00     0.00
# 检查磁盘io情况
[root@clsn6 tsar]# tsar --io  --check

clsn6    tsar    io:sda:rrqms=0.0 io:sda:wrqms=0.0 io:sda:rs=0.0 io:sda:ws=0.1 io:sda:rsecs=0.0 io:sda:wsecs=0.7 io:sda:rqsize=4.9 io:sda:qusize=0.0 io:sda:await=0.7 io:sda:svctm=0.6 io:sda:util=0.0
# tsar 显示1天内的历史汇总(summury)信息,以默认5分钟为间隔
[root@clsn6 tsar]# tsar --swap   --check

clsn6    tsar    swap:swpin=0.0 swap:swpout=0.0 swap:total=805302272.0 swap:util=0.0

[root@clsn6 tsar]# tsar

Time           ---cpu-- ---mem-- ---tcp-- -----traffic---- --sda---  ---load-

Time             util     util   retran    bytin  bytout     util     load1

04/06/18-20:45   0.16    18.39     0.00    72.00   89.00     0.15     0.00

04/06/18-20:50   0.16    18.41     0.00     5.00    3.00     0.03     0.00

04/06/18-20:55   0.15    18.39     0.00     4.00    3.00     0.01     0.00

04/06/18-21:00   0.15    18.54     0.00     4.00    3.00     0.02     0.00

04/06/18-21:05   0.16    18.24     0.00    21.00   32.00     0.10     0.00

04/06/18-21:10   0.18    18.27     0.00    19.00   24.00     0.01     0.00

MAX              0.16    18.54     0.00    72.00   89.00     0.15     0.00

MEAN             0.16    18.37     0.00    10.60   13.00     0.03     0.00

MIN              0.16    18.24     0.00     4.00    3.00     0.03     0.00
# tsar --cpu -i 1 显示一天内cpu的历史信息,以1分钟为间隔
[root@clsn6 tsar]# tsar --cpu -i 1

Time           -----------------------cpu----------------------

Time             user     sys    wait    hirq    sirq    util

04/06/18-20:37   0.01    0.10    0.02    0.00    0.03    0.14

04/06/18-20:38   0.00    0.13    0.30    0.00    0.02    0.15

04/06/18-20:39   0.02    0.12    0.00    0.00    0.05    0.18

04/06/18-20:40   0.02    0.13    0.00    0.00    0.03    0.18

04/06/18-20:41   0.00    0.08    0.00    0.00    0.03    0.12

04/06/18-20:42   0.02    0.10    0.00    0.00    0.03    0.15

···
# tsar --live --mem -i 2 以2秒钟为间隔,实时打印mem的数据。
[root@clsn6 tsar]# tsar --live --mem -i 2

Time              -----------------------mem----------------------

Time                free    used    buff    cach   total    util

04/06/18-21:14:47 142.1M   87.5M   51.2M  193.8M  474.6M   18.44

04/06/18-21:14:49 142.1M   87.5M   51.2M  193.8M  474.6M   18.44

04/06/18-21:14:51 142.1M   87.5M   51.2M  193.8M  474.6M   18.44

···
# tsar --cpu --mem -i 1 显示一天内的cpu和内存历史数据,以1分钟为间隔。
[root@clsn6 tsar]# tsar --cpu --mem -i 1

Time           -----------------------cpu---------------------- -----------------------

mem----------------------

Time             user     sys    wait    hirq    sirq    util     free    used    buff

   cach   total    util

04/06/18-20:37   0.01    0.10    0.02    0.00    0.03    0.14   148.0M   84.7M   50.3M

 191.6M  474.6M   17.85

04/06/18-20:38   0.00    0.13    0.30    0.00    0.02    0.15   147.6M   84.8M   50.4M

 191.8M  474.6M   17.87

04/06/18-20:39   0.02    0.12    0.00    0.00    0.05    0.18   147.6M   84.8M   50.4M

 191.8M  474.6M   17.88

04/06/18-20:40   0.02    0.13    0.00    0.00    0.03    0.18   146.3M   86.1M   50.4M

 191.8M  474.6M   18.15

04/06/18-20:41   0.00    0.08    0.00    0.00    0.03    0.12   147.5M   84.9M   50.4M

 191.8M  474.6M   17.89

···
1.4 tsar添加模块
1.4.1 模块开发
tsar编译安装后即可以进行自定义模块的开发
步骤如下
1.执行tsardevel mymod会在当前目录生成一个mymod文件夹
[root@clsn6 tsar]#  tsardevel mymod

build:make

install:make install

uninstall:make uninstall

test:tsar --list or tsar --mymod --live -i 1

[root@clsn6 tsar]#  tsardevel mymod

build:make

install:make install

uninstall:make uninstall

test:tsar --list or tsar --mymod --live -i 1
2.修改里面的mod_mymod.c成自己想要的采集程序开发手册,make make install即可以安装到系统
[root@clsn6 mymod]# make

gcc -I/usr/local/tsar/devel -Wall -fPIC --shared -g  mod_mymod.c -o mod_mymod.so

[root@clsn6 mymod]# make install

cp ./mod_mymod.so /usr/local/tsar/modules/

cp ./mod_mymod.conf /etc/tsar/conf.d/mymod.conf
3.这时系统即可以使用mymod的采集:
[root@clsn6 mymod]# tsar -i 1 -l --mymod

Time        ----------mymod---------

Time                  value1  value2  value3

04/06/18-21:32:19    1.0     1.0     1.0

04/06/18-21:32:20    1.0     1.0     1.0

04/06/18-21:32:21    1.0     1.0     1.0
4.自定义的模块配置:/etc/tsar/conf.d/mymod.conf 可以在这个文件配置模块开启关闭,是否输出到db/nagios,以及nagios的报警阀值 mod_mymod on
#add it to tsar default output

output_stdio_mod mod_mymod

#add it to center db

#output_db_mod mod_mymod

#add it to nagios send

#set nagios threshold for alert

output_nagios_mod mod_mymod

threshold mymod.value1;N;N;N;N;
1.4.2 安装nginx模块
tsar中可以添加很多的监控模块,这次添加nginx监控模块。
tsar的nginx扩展模块项目主页为:https://github.com/taobao/tsar-mod_nginx ,点击下载zip包。
[root@clsn6 tsar]#   unzip tsar-mod_nginx-master.zip

[root@clsn6 tsar]#   tsardevel nginx

build:make

install:make install

uninstall:make uninstall

test:tsar --list or tsar --nginx --live -i 1

[root@clsn6 tsar]#   cp tsar-mod_nginx-master/mod_nginx.c nginx/

cp:是否覆盖"nginx/mod_nginx.c"? y

[root@clsn6 tsar]#   cd nginx/

[root@clsn6 nginx]# ls

Makefile  mod_nginx.c  mod_nginx.conf

[root@clsn6 nginx]# make && make install
测试
[root@clsn6 nginx]# service nginx start

正在启动 nginx:                                           [确定]

[root@clsn6 nginx]# tsar --nginx --live -i 1
1.4.3 nginx模块不能用问题的处理
此时通过使用tsar --nginx --live -i 1 命令查看,若出现都是横线。是因为nginx没有开启status统计页面 。
因为该工具统计的原理是通过获取status页面的输出结果,并对输出内容进行统计和计算得出的结果。而且其获取状态页的url默认是http://127.0.0.1/nginx_status ,所以在nginx上你必须有如下的配置:
location /nginx_status {

          stub_status on;

          access_log   off;

          allow 127.0.0.1;

          deny all;

        }
注:以上的url并非不能更改,可以修改环境变量实现。其自带的几个环境变量如下。
export NGX_TSAR_HOST=192.168.0.1

export NGX_TSAR_PORT=8080

export NGX_TSAR_SERVER_NAME=status.taobao.com

export NGX_TSAR_URI=/nginx_status
1.5 参考文献
监控命令之tsar的更多相关文章
- 需要了解的 Linux 网络和监控命令
列出来的10个基础的每个linux用户都应该知道的网络和监控命令.网络和监控命令类似于这些: hostname, ping, ifconfig, iwconfig, netstat, nslookup ...
- 10个基础的linux网络和监控命令
配置zookeeper集群时,需要查看本机ip,输入命令 hostname -i 就会只显示主机ip, 下边搜了一篇常用的 命令,闲的时候多敲敲命令,以便用的时候再找! 我下面列出来的10个 ...
- Linux系统监控命令及如何定位到Java线程
>>PID.TID的区分 uid是user id,即用户id,root用户的uid是0,0为最高权限,gid是group id,用户组id,使用 id 命令可以很简单的通过用户名查看UID ...
- 注意啦!10 个你需要了解的 Linux 网络和监控命令
下面列出来的10个基础的每个Linux用户都应该知道的网络和监控命令.网络和监控命令类似于这些:hostname, ping, ifconfig, iwconfig, netstat, nslooku ...
- JVM监控命令详解(转)
JVM监控命令基本就是 jps.jstack.jmap.jhat.jstat 几个命令的使用就可以了 JDK本身提供了很多方便的JVM性能调优监控工具,除了集成式的VisualVM和jConsole外 ...
- 总结:常用的Linux系统监控命令
记录一下自己常用的linux系统命令,方便以后查阅,发觉记忆越来越不行了 找到最耗CPU的java线程 ps命令 命令: ps -mp pid -o THREAD,tid,time 或者 ps -Lf ...
- Linux中监控命令top命令使用方法详解
收集了两篇关于介绍Linux中监控命令top命令的详细使用方法的文章.总的来说,top命令主要用来查看Linux系统的各个进程和系统资源占用情况,在监控Linux系统性能方面top显得非常有用,下面就 ...
- [转载]你需要知道的 16 个 Linux 服务器监控命令
转载自: 你需要知道的 16 个 Linux 服务器监控命令 如果你想知道你的服务器正在做干什么,你就需要了解一些基本的命令,一旦你精通了这些命令,那你就是一个 专业的 Linux 系统管理员. 有些 ...
- 常用的linux系统监控命令整理
找到最耗CPU的java线程ps命令 命令:ps -mp pid -o THREAD,tid,time 或者 ps -Lfp pid 结果展示: 这个命令的作用,主要是可以获取到对应一个进程下的线程的 ...
随机推荐
- hdu3966 树链剖分点权模板+线段树区间更新/树状数组区间更新单点查询
点权树的模板题,另外发现树状数组也是可以区间更新的.. 注意在对链进行操作时方向不要搞错 线段树版本 #include<bits/stdc++.h> using namespace std ...
- python接口自动化测试十二:对返回的json的简单操作
# 1.requests里面自带解析器转字典 print(r.json()) print(type(r.json())) # 取出json中的'result_sk_temp'字段 # {"r ...
- 步步为营-11-List<T>泛型的简单练习
using System; using System.Collections.Generic; using System.Linq; using System.Text; using System.T ...
- swich使用
package demo; import java.util.Scanner; /** * swich(变量){//byte\shore\char\int'枚举(jdk1.5)/String(1.7) ...
- 《剑指offer》-青蛙跳台阶II
一只青蛙一次可以跳上1级台阶,也可以跳上2级--它也可以跳上n级.求该青蛙跳上一个n级的台阶总共有多少种跳法. 其实题目很水...就是一个等比数列通项公式嘛 f(0)=1 f(1)=1 f(n)=f( ...
- 《LINQ技术详解C#》-2.查询表达式翻译为标准查询操作符
(1)透明标识符 有些翻译步骤要使用透明标识符(*)插入枚举变量. 透明标识符只在翻译过程中存在,翻译结束将不再出现. (2)翻译步骤 ①带有into连续语句的Select和Group语句 from. ...
- P2152 [SDOI2009]SuperGCD 未完成
辗转相减求a,b的gcd其实可以优化的: 1.若a为偶数,b为奇数:gcd(a,b)=gcd(a/2,b) 2.若a为奇数,b为偶数:gcd(a,b)=gcd(a,b/2) 3.若a,b都是偶数:gc ...
- springmvc中登录过滤器使用
前言 一般的javaWeb项目中我们肯定会使用过滤器来实现对一些请求的过滤,通过过滤来实现对一些请求参数的设置和校验,比如我们比较熟悉的CharacterEncodingFilter就是一个字符编 ...
- Codeforces 585D Lizard Era: Beginning
Lizard Era: Beginning 折半之后搜就完事了, 直接存string字符串卡空间, 随便卡卡空间吧. #include<bits/stdc++.h> #define LL ...
- 消息确认机制---confirm异步
一:介绍 1.异步模式介绍 Channel对象提供ConfirmListener()回调方法只包含deliverTag(当前Channel发出的序列号),我们需要自己为每一个Channel维护一个un ...