掌握VS2010调试 -- 入门指南
1 导言
在软件开发周期中,测试和修正缺陷(defect,defect与bug的区别:Bug是缺陷的一种表现形式,而一个缺陷是可以引起多种Bug的)的时间远多于写代码的时间。通常,debug是指发现缺陷并改正的过程。修正缺陷紧随debug之后,或者说二者是相关的。如果代码中存在缺陷,我们首先要识别造成缺陷的根本原因(root cause),这个过程就称作调试(debugging)。找到根本原因后,就可以修正缺陷。
那么如何调试代码呢?Visual Studio提供了很多用于调试的工具。有时调试需要花费大量时间去识别root cause。VS提供了许多辅助调试的便捷的工具。调试器(Debugger)包含错误列表、添加断点、可视化的程序流程、控制执行流程、Data Tips、监视窗口(watch windows)、多线程调试、线程窗口、并行调试概览以及IntelliTrace调试概览。我希望本文能够对调试功能的使用者有所裨益。请注意,本文使用VS2010。某些功能在旧版本中也是一致的,但是VS2010新增了许多features(Labeling breakpoint, Pinned DataTip, Multithreaded Debugging, Parallel debugging and IntelliTrace)。
2 如何启动调试?
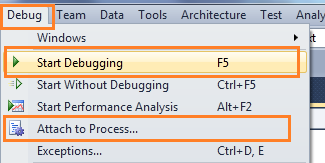 图 启动调试(Start Debugging)
“附加到进程(Attach to Process)”是另一种启动调试的方法。Attach Process会为应用程序启动一个调试会话。可能我们更熟悉ASP.NET Web应用的Attach Process调试。我发了另外两篇相关的帖子。如下:
- Debug Your ASP.NET Application that Hosted on IIS
- Remote IIS Debugging: Debug your ASP.NET Application which is hosted on "Remote IIS Server"
通常我们通过在可能存在问题代码处加断点来启动调试。因此,我们从断点开始讲起。
3 断点(Breakpoints)
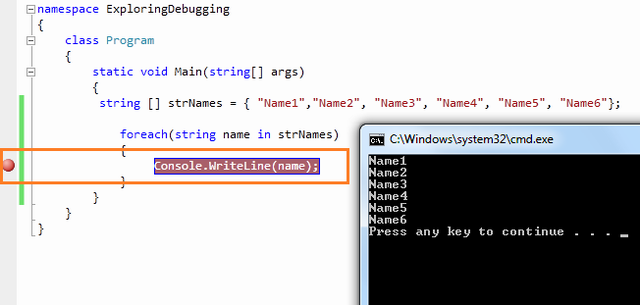 图 设置断点(Set Breakpoint)
3.1 使用断点进行调试
在中断模式下,你有多条可使用的命令,使用相应命令进行进一步的调试。
 图 断点工具条(Breakpoint Toolbar)
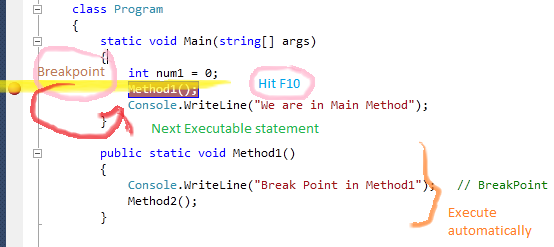
3.1.1 逐过程(Step Over)
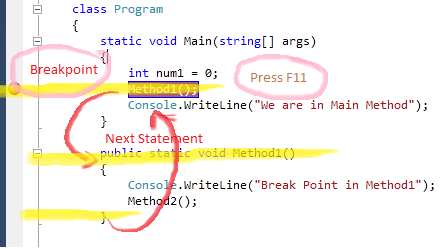
3.1.2 逐语句(Step Into)
3.1.3 跳出(Step Out)
3.1.4 继续(Continue)
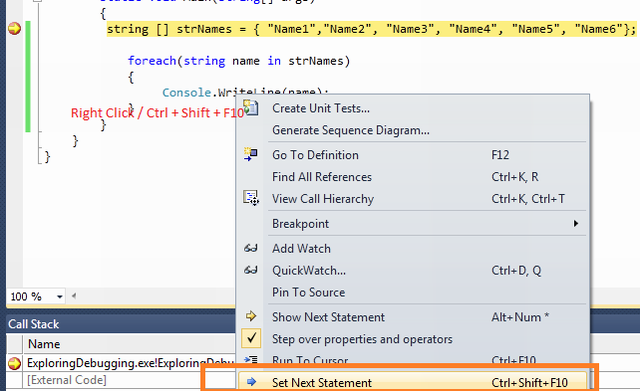
3.1.5 设置下一语句(Set Next Statement)
3.1.6 显示下一语句(Show Next Statement [Ctrl+*])
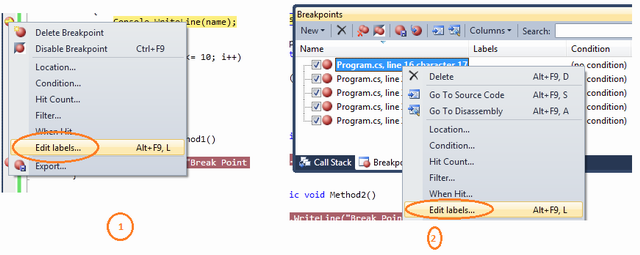
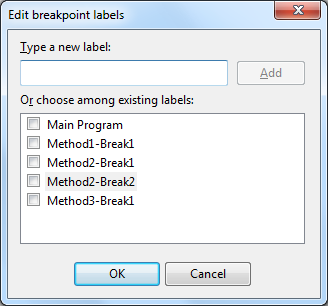
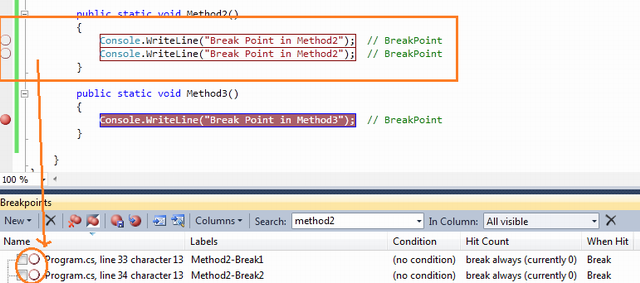
3.2 断点标签(Labeling in Break Point)
- class Program
- {
- static void Main(string[] args)
- {
- string[] strNames = { "Name1", "Name2", "Name3", "Name4", "Name5", "Name6" };
- foreach (string name in strNames)
- {
- Console.WriteLine(name); // BreakPoint
- }
- int temp = 4;
- for (int i = 1; i <= 10; i++)
- {
- if (i > 6)
- temp = 5;
- }
- }
- public static void Method1()
- {
- Console.WriteLine("Break Point in Method1"); // BreakPoint
- }
- public static void Method2()
- {
- Console.WriteLine("Break Point in Method2"); // BreakPoint
- Console.WriteLine("Break Point in Method2"); // BreakPoint
- }
- public static void Method3()
- {
- Console.WriteLine("Break Point in Method3"); // Breakpoint
- }
- }
class Program

    {

        static void Main(string[] args)

        {

            string[] strNames = { "Name1", "Name2", "Name3", "Name4", "Name5", "Name6" };

            foreach (string name in strNames)

            {

                Console.WriteLine(name);   // BreakPoint

            }

            int temp = 4;

            for (int i = 1; i <= 10; i++)

            {

                if (i > 6)

                    temp = 5;

            }

        }

        public static void Method1()

        {

            Console.WriteLine("Break Point in Method1");   // BreakPoint

        }

        public static void Method2()

        {

            Console.WriteLine("Break Point in Method2");  // BreakPoint

            Console.WriteLine("Break Point in Method2");  // BreakPoint

        }

        public static void Method3()

        {

            Console.WriteLine("Break Point in Method3");  // Breakpoint

        }

    }
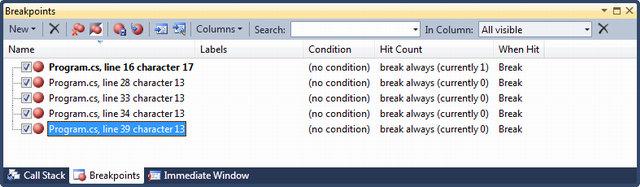
执行程序将停在第一个断点处。下图给出了断点列表。
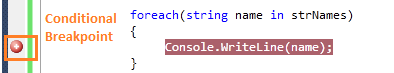
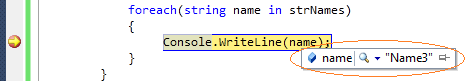
3.3 条件断点(Conditional Breakpoint)
- class Program
- {
- static void Main(string[] args)
- {
- string [] strNames = { "Name1","Name2", "Name3", "Name4", "Name5", "Name6"};
- foreach(string name in strNames)
- {
- Console.WriteLine(name); // Breakpoint is here
- }
- }
- }
class Program

    {

        static void Main(string[] args)

        {

         string [] strNames = { "Name1","Name2", "Name3", "Name4", "Name5", "Name6"};

            foreach(string name in strNames)

            {

                 Console.WriteLine(name); // Breakpoint is here

            }

        }

    }
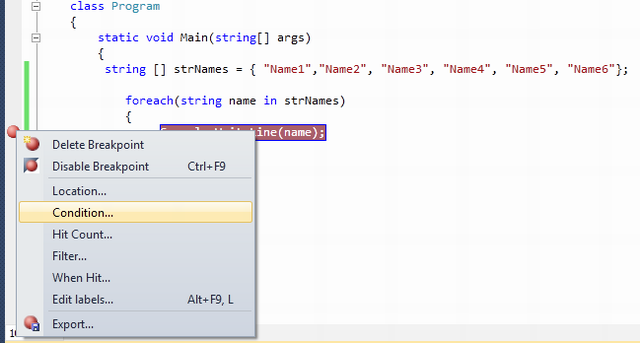
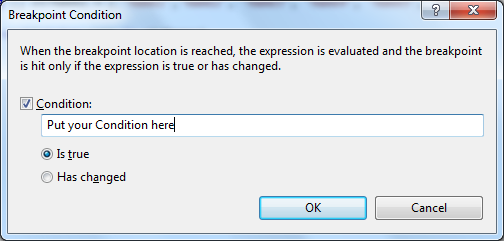
你在Console.WriteLine()语句处设置了断点。当执行程序时,每次for-each循环都会停住。如果你想让代码只在name="Name3"时停住,该怎么办呢?非常简单,你只需使用条件name.Equals("Name3")。 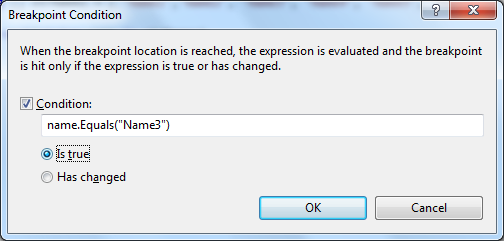
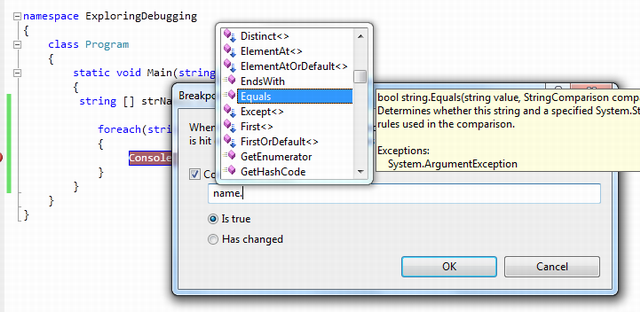
- Is True
- Has Changed
3.4 导入/导出断点(Import / Export Breakpoint)
3.5 断点命中计数(Breakpoint Hit Count)
3.6 Breakpoint When Hit
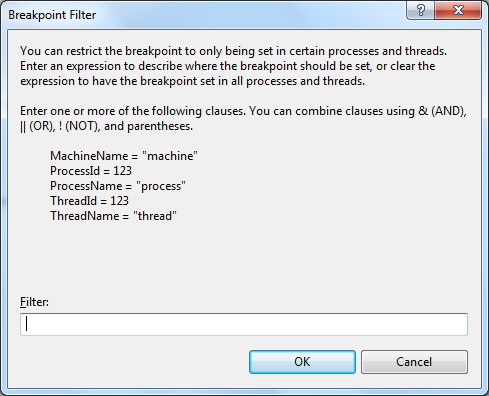
3.7 断点筛选器(Breakpoint Filter)
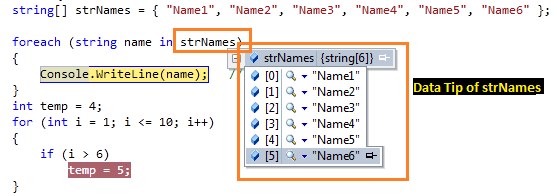
4 数据便签(Data Tip)
4.1 Pin Inspect Value During Debugging
4.2 Drag-Drop Pin Data Tip
4.3 Adding Comments
4.4 Last Session Debugging Value
4.5 Import Export Data Tips
4.6 Change Value Using Data Tips
4.7 Clear Data Tips
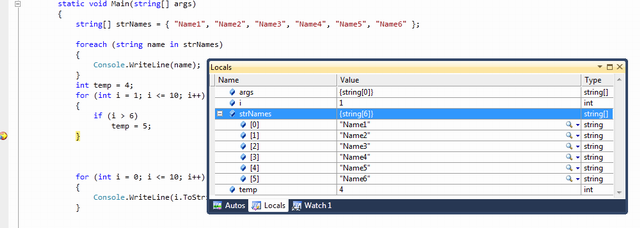
5 监视窗口(Watch Windows)
5.1 局部变量(Locals)
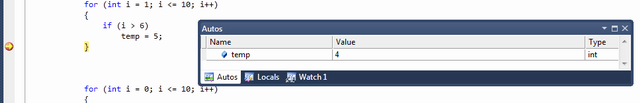
5.2 自动窗口(Autos)
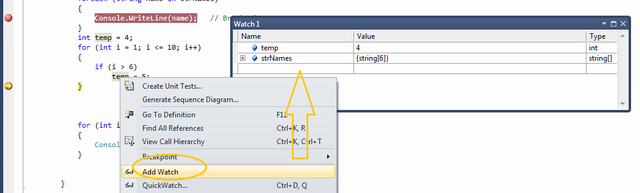
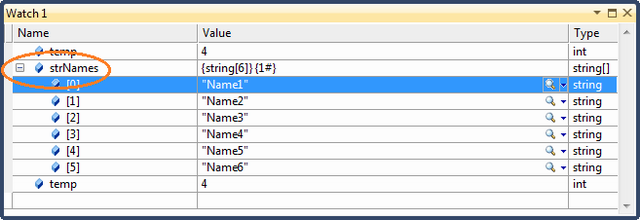
5.3 监视(Watch)
有4个可同时使用的监视窗口。 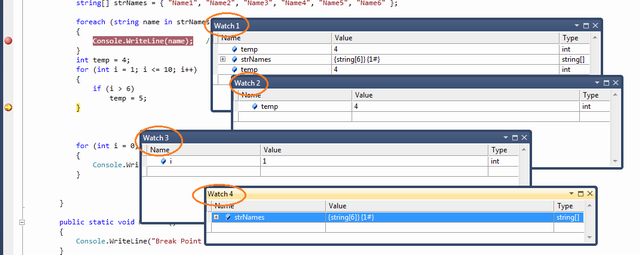 图:多个监视窗口
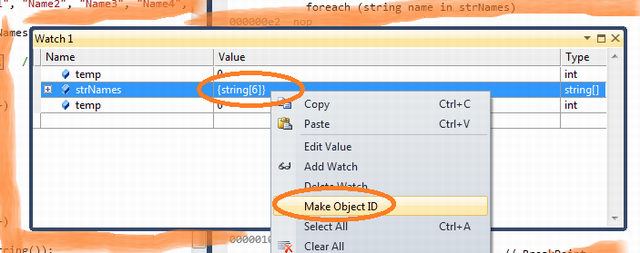
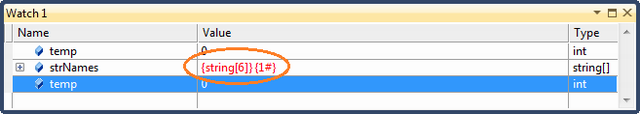
5.3.1 Creating Object ID
5.4
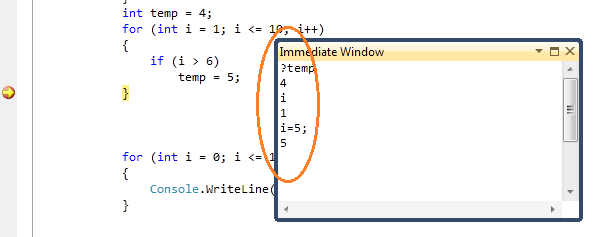
6 即时窗口(Immediate Window)
7 调用堆栈(Call Stack)
8 调试多线程程序(Debugging Multithreaded Program)
8.1 Exploring Threads Window
8.2 Flag Just My Code
8.3 Break Point Filter - Multithread Debugging
9 调试并行程序(Debugging Parallel Program)
9.1 Parallel Task and Parallel Stacks
10 Debugging with IntelliTrace
10.1 Overview
10.2 Mapping with IntelliTrace
10.3 Filter IntelliTrace Data
11 调试常用快捷键(Useful Shortcut Keys For VS Debugging)
| Shortcut Keys | Descriptions |
| Ctrl-Alt-V, A | Displays the Auto window |
| Ctrl-Alt-B | Displays the Breakpoints dialog |
| Ctrl-Alt-C | Displays the Call Stack |
| Ctrl-Shift-F9 | Clears all of the breakpoints in the project |
| Ctrl-F9 | Enables or disables the breakpoint on the current line of code |
| Ctrl-Alt-E | Displays the Exceptions dialog |
| Ctrl-Alt-I | Displays the Immediate window |
| Ctrl-Alt-V, L | Displays the Locals window |
| Ctrl-Alt-Q | Displays the Quick Watch dialog |
| Ctrl-Shift-F5 | Terminates the current debugging session, rebuilds if necessary, and starts a new debugging session. |
| Ctrl-F10 | Starts or resumes execution of your code and then halts execution when it reaches the selected statement. |
| Ctrl-Shift-F10 | Sets the execution point to the line of code you choose |
| Alt-NUM * | Highlights the next statement |
| F5 | If not currently debugging, this runs the startup project or projects and attaches the debugger. |
| Ctrl-F5 | Runs the code without invoking the debugger |
| F11 | Step Into |
| Shift-F11 | Executes the remaining lines out from procedure |
| F10 | Executes the next line of code but does not step into any function calls |
| Shift-F5 | Available in break and run modes, this terminates the debugging session |
| Ctrl-Alt-H | Displays the Threads window to view all of the threads for the current process |
| F9 | Sets or removes a breakpoint at the current line |
| Ctrl-Alt-W, 1 | Displays the Watch 1 window to view the values of variables or watch expressions |
| Ctrl-Alt-P | Displays the Processes dialog, which allows you to attach or detach the debugger to one or more running processes |
| Ctrl-D,V | IntelliTrace Event |
到此本文结束。希望你喜欢本文。请分享你的反馈和建议。
12 深入学习(Further Study)
13 总结(Summary)
“自动窗口”(Autos):当前使用的变量
“局部窗口”(Locals):在范围内的所有变量
“监视N”(Watch):可定制(N从1到4)
Step Into(逐语句):执行并移动到下一条语句(实际上,跳入上一条语句的代码块,此代码块的第一条)
Step Over(逐过程):执行并跳到下一条语句,但不进入上一条语句的代码块
Step Out(跳出):执行到代码块结尾
命令窗口(Command)
即时窗口(Immediate):主要用于计算表达式
参考资料:
[1] Mastering Debugging in Visual Studio 2010 - A Beginner's Guide
[2] bug和缺陷的区别
掌握VS2010调试 -- 入门指南的更多相关文章
- VS2010调试入门指南
1 导言 在软件开发周期中,测试和修正缺陷(defect,defect与bug的区别:Bug是缺陷的一种表现形式,而一个缺陷是可以引起多种Bug的)的时间远多于写代码的时间.通常,debug是指发现缺 ...
- 教程:VS2010 之TFS入门指南(转载)
[原文发表地址] Tutorial: Getting Started with TFS in VS2010 [原文发表时间] Wednesday, October 21, 2009 1:00 PM 本 ...
- Flume NG Getting Started(Flume NG 新手入门指南)
Flume NG Getting Started(Flume NG 新手入门指南)翻译 新手入门 Flume NG是什么? 有什么改变? 获得Flume NG 从源码构建 配置 flume-ng全局选 ...
- [转载]TFS入门指南
[原文发表地址] Tutorial: Getting Started with TFS in VS2010 [原文发表时间] Wednesday, October 21, 2009 1:00 PM 本 ...
- Microsoft Orleans 之 入门指南
Microsoft Orleans 在.net用简单方法构建高并发.分布式的大型应用程序框架. 原文:http://dotnet.github.io/orleans/ 在线文档:http://dotn ...
- Java Gradle入门指南之内建与定制任务类(buildSrc、Groovy等)
上一篇随笔介绍了Gradle的安装与任务管理,这篇着重介绍Gradle的内建任务(in-built tasks)与自定义任务(custom tasks),借助Gradle提供的众多内建任务类型 ...
- 5+ App开发入门指南
HTML5 Plus应用概述 HTML5 Plus移动App,简称5+App,是一种基于HTML.JS.CSS编写的运行于手机端的App,这种App可以通过扩展的JS API任意调用手机的原生能力,实 ...
- Windows 服务入门指南
有很多时候,我们需要创建Windows Service. 这篇文章可以算是一个入门指南吧,希望对初学者有帮助. 要创建Windows Service, 首先选择Windows服务项目,如下图: 这里我 ...
- (转载)李剑英的CSLight入门指南结合NGUI热更新
原地址:http://www.xuanyusong.com/archives/3075 李剑英的CSLight入门指南文档撰写者:GraphicQQ: 1065147807 一. CSLIGHT 作者 ...
随机推荐
- Unity3D
一.安装配置 1.下载页面:http://unity3d.com/get-unity 分个人版本和专业版,个人版免费,但少了很多功能(主要是渲染相关,具体请看官方说明), 专业版是每月 75$ 或一次 ...
- Markdown 写作工具选择
Markdown 写作工具选择 候选产品 参考了少数派网站 markdown 写作工具2015年度盘点 http://sspai.com/32483, Windows 下 Markdown 的编辑工具 ...
- ECshop安装及报错解决方案总结
一.安装ECshop ECShop是一款B2C独立网店系统 ,适合企业及个人快速构建个性化网上商店.系统是基于PHP语言及MYSQL数据库构架开发的跨平台开源程序.2006年3月推出以来1.0版以来, ...
- ZipArchive 打包下载压缩包
用php的header()方式下载压缩包. 要点:1.不能在header导出压缩包前向浏览器输出内容,否则文件下载压缩包成功,打开的压缩包也会显示被破坏. 2.在压缩文件包的php代码前不可以有js脚 ...
- hash-3.hashCode
1.有一个类Person,有两个字段age和name,我重写Object类的equal方法来比较两个对象的age和name是否相等,但是不重写hashCode. package com.hash; p ...
- Nginx反向代理多虚拟主机代理
根据http://www.cnblogs.com/zzzhfo/p/6032095.html这个环境配置 在web01和web02上配置基于域名的虚拟主机 web01 [root@web01 /]# ...
- android ListView嵌套GridView显示不全问题
只需重写GridView即可:public class MyGridView extends GridView{ public MyGridView(android.content.Context c ...
- View和ViewImage设置图片
1.view类的设置背景android:background --setBackgroundResource(int) --A drawable to use as the background. s ...
- (苹果AppleWWDRCA.cer证书过期)Failed to locate or generate matching signing assets
从2月14号开始,上传AppStore会碰到:Failed to locate or generate matching signing assets 字数462 阅读13571 评论16 喜欢61 ...
- [BZOJ3991][SDOI2015]寻宝游戏
[BZOJ3991][SDOI2015]寻宝游戏 试题描述 小B最近正在玩一个寻宝游戏,这个游戏的地图中有N个村庄和N-1条道路,并且任何两个村庄之间有且仅有一条路径可达.游戏开始时,玩家可以任意选择 ...