
kaggle数据集某咖啡店的营销数据分析
因为还处于数据分析的学习阶段(野生Python学者),所以在kaggle这个网站找了两个数据集来给自己练练手。
准备工作
import pandas as pd

import os

import matplotlib.pyplot as plt

import numpy as np

from random import choice
获取数据
这里我下载了两个数据集第一个是关于咖啡的销售情况,第二个是关于Instagram这个网站1000名最受欢迎的博主的数据。
我就从咖啡的销售情况这个表入手,因为我看了第二个表实在是没有什么眉目去做T.T
# 读取目录内的文件

directory = r'C:\Users\Admin\Desktop\demo\练习'

files = os.listdir(directory)

print(files)
['coffee_result.csv', 'Instagram-Data.csv']
# 存放文件

files_list = []

for file in files:

    if file.endswith('.csv'):

        directory_file = fr'{directory}\{file}'

        files_list.append(directory_file)

print(files_list)
['C:\\Users\\Admin\\Desktop\\demo\\练习\\coffee_result.csv', 'C:\\Users\\Admin\\Desktop\\demo\\练习\\Instagram-Data.csv']
# 读取需要的文件

df = pd.read_csv(files_list[0])
查看一些必要信息
df.info()

df
<class 'pandas.core.frame.DataFrame'>

RangeIndex: 1464 entries, 0 to 1463

Data columns (total 6 columns):

 #   Column       Non-Null Count  Dtype

---  ------       --------------  -----

 0   date         1464 non-null   object

 1   datetime     1464 non-null   object

 2   cash_type    1464 non-null   object

 3   card         1375 non-null   object

 4   money        1464 non-null   float64

 5   coffee_name  1464 non-null   object

dtypes: float64(1), object(5)

memory usage: 68.8+ KB
\3c pre>\3c code>.dataframe tbody tr th { vertical-align: top }
.dataframe thead th { text-align: right }
| date | datetime | cash_type | card | money | coffee_name | |
|---|---|---|---|---|---|---|
| 0 | 2024-03-01 | 2024-03-01 10:15:50.520 | card | ANON-0000-0000-0001 | 38.70 | Latte |
| 1 | 2024-03-01 | 2024-03-01 12:19:22.539 | card | ANON-0000-0000-0002 | 38.70 | Hot Chocolate |
| 2 | 2024-03-01 | 2024-03-01 12:20:18.089 | card | ANON-0000-0000-0002 | 38.70 | Hot Chocolate |
| 3 | 2024-03-01 | 2024-03-01 13:46:33.006 | card | ANON-0000-0000-0003 | 28.90 | Americano |
| 4 | 2024-03-01 | 2024-03-01 13:48:14.626 | card | ANON-0000-0000-0004 | 38.70 | Latte |
| ... | ... | ... | ... | ... | ... | ... |
| 1459 | 2024-09-05 | 2024-09-05 20:30:14.964 | card | ANON-0000-0000-0587 | 32.82 | Cappuccino |
| 1460 | 2024-09-05 | 2024-09-05 20:54:24.429 | card | ANON-0000-0000-0588 | 23.02 | Americano |
| 1461 | 2024-09-05 | 2024-09-05 20:55:31.429 | card | ANON-0000-0000-0588 | 32.82 | Cappuccino |
| 1462 | 2024-09-05 | 2024-09-05 21:26:28.836 | card | ANON-0000-0000-0040 | 27.92 | Americano with Milk |
| 1463 | 2024-09-05 | 2024-09-05 21:27:29.969 | card | ANON-0000-0000-0040 | 27.92 | Americano with Milk |
1464 rows × 6 columns
print(df['cash_type'].unique().tolist(),'\n',

len(df['card'].unique().tolist()),'\n',

df['coffee_name'].unique().tolist(),'\n',

len(df['coffee_name'].unique().tolist()))
['card', 'cash']

 589

 ['Latte', 'Hot Chocolate', 'Americano', 'Americano with Milk', 'Cocoa', 'Cortado', 'Espresso', 'Cappuccino']

 8
通过info返回的信息可以看到card列存在一些空值,那我就把空值处理一下
df[df['card'].isnull()]
\3c pre>\3c code>.dataframe tbody tr th { vertical-align: top }
.dataframe thead th { text-align: right }
| date | datetime | cash_type | card | money | coffee_name | |
|---|---|---|---|---|---|---|
| 12 | 2024-03-02 | 2024-03-02 10:30:35.668 | cash | NaN | 40.0 | Latte |
| 18 | 2024-03-03 | 2024-03-03 10:10:43.981 | cash | NaN | 40.0 | Latte |
| 41 | 2024-03-06 | 2024-03-06 12:30:27.089 | cash | NaN | 35.0 | Americano with Milk |
| 46 | 2024-03-07 | 2024-03-07 10:08:58.945 | cash | NaN | 40.0 | Latte |
| 49 | 2024-03-07 | 2024-03-07 11:25:43.977 | cash | NaN | 40.0 | Latte |
| ... | ... | ... | ... | ... | ... | ... |
| 657 | 2024-05-31 | 2024-05-31 09:23:58.791 | cash | NaN | 39.0 | Latte |
| 677 | 2024-06-01 | 2024-06-01 20:54:59.267 | cash | NaN | 39.0 | Cocoa |
| 685 | 2024-06-02 | 2024-06-02 22:43:10.636 | cash | NaN | 34.0 | Americano with Milk |
| 691 | 2024-06-03 | 2024-06-03 21:42:51.734 | cash | NaN | 34.0 | Americano with Milk |
| 692 | 2024-06-03 | 2024-06-03 21:43:37.471 | cash | NaN | 34.0 | Americano with Milk |
89 rows × 6 columns
空值是由支付类型为现金支付的那一列对应的行产生的
df['card'] = df['card'].fillna("-1")

df['card'].isnull().any()
np.False_
对数据进行处理
在info返回的信息看到date这一列的数值类型是对象,我就把它变成日期类型方便我自己后续操作
print(type(df.loc[1,'date']),type(df.loc[1,'datetime']))

df.loc[1,'date']
<class 'str'> <class 'str'>

'2024-03-01'
# 调整日期格式提取每行数据的月份

df['date'] = pd.to_datetime(df['date'])

df['datetime'] = pd.to_datetime(df['datetime'])

df['month'] = df['date'].dt.month

print(len(df['month'].unique()))
7
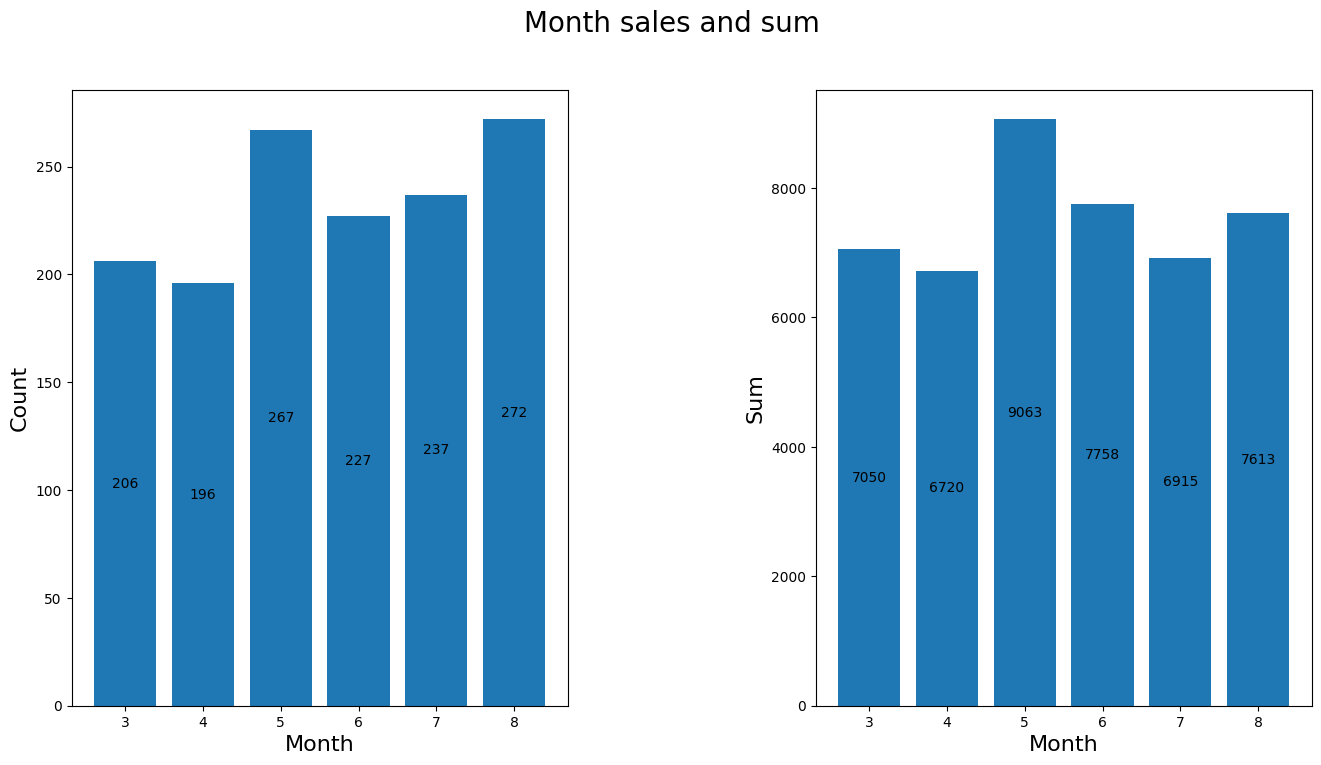
查看每月的销售情况
因为9月份的数据只有5天所以这个月就不纳入分析
# 查看每月的销量以及金额

df_six = df[df['month']!=9].copy()

month = df_six['month'].unique()    # 把月份单独拎出

month_sales = df_six.groupby('month')['money'].count()

month_sum = df_six.groupby('month')['money'].sum()

figure,axes = plt.subplots(1,2,figsize=[16,8])

figure.suptitle("Month sales and sum",size=20)

ax1 = axes[0].bar(month,month_sales)

axes[0].set_xlabel('Month',size=16)

axes[0].set_ylabel('Count',size=16)

ax2 = axes[1].bar(month,month_sum)

axes[1].set_xlabel('Month',size=16)

axes[1].set_ylabel('Sum',size=16)

axes[0].bar_label(ax1,fmt="%d",label_type="center")

axes[1].bar_label(ax2,fmt="%d",label_type="center")

plt.subplots_adjust(wspace=0.5)
统计每款咖啡的营销情况
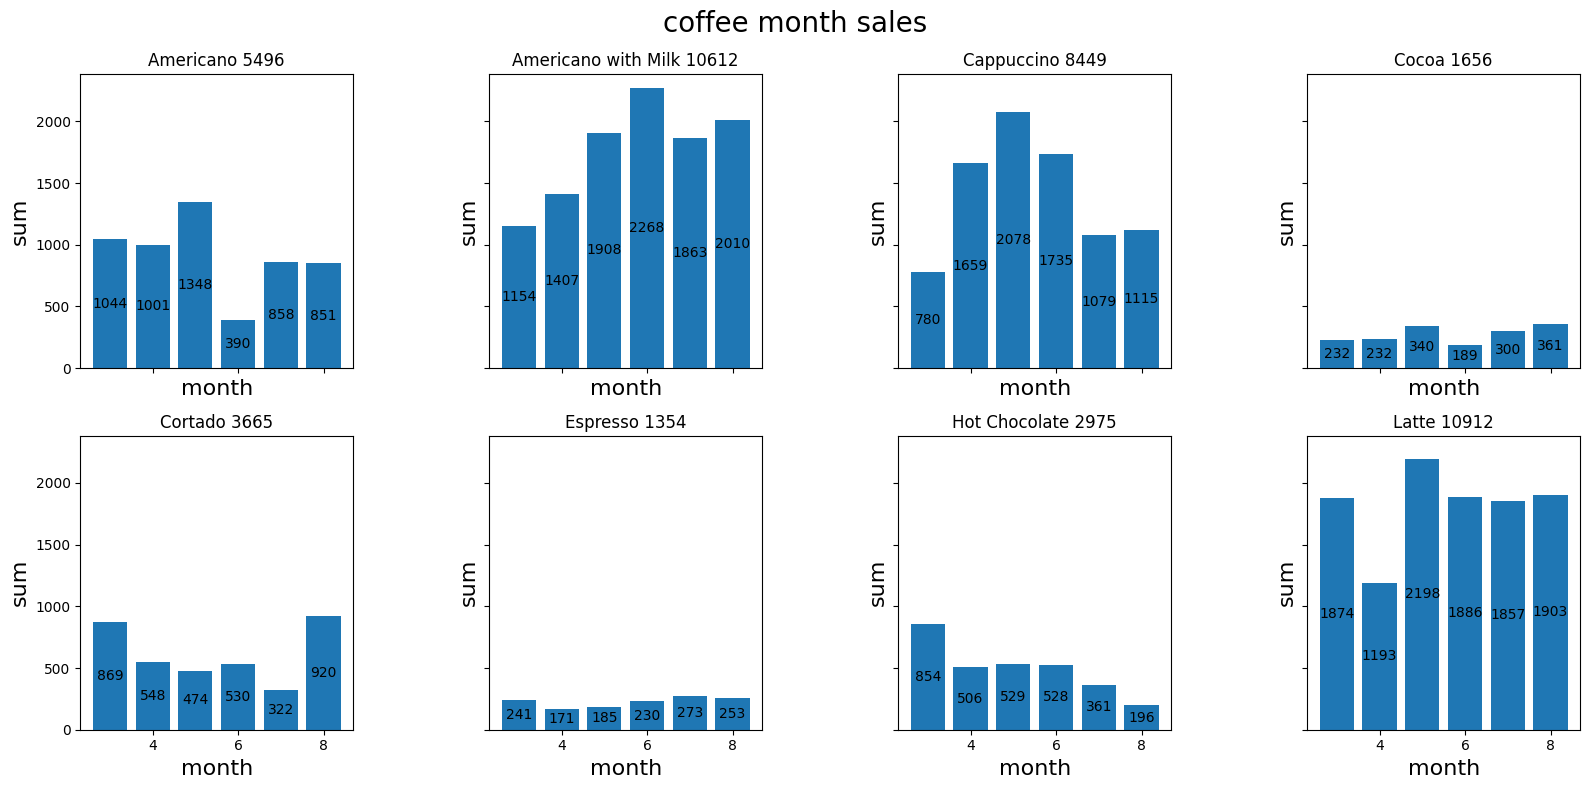
每款咖啡每月的营销额
nrows,ncols = 2,4

figure3,axes = plt.subplots(nrows,ncols,figsize=[16,8],sharex=True,sharey=True)

coffee_month_sales = df_six.groupby(['month','coffee_name'])['money'].sum().reset_index(name='sum')

coffee_names = coffee_month_sales['coffee_name'].unique().tolist()

for idx,coffee_name in enumerate(coffee_names):

    x,y = divmod(idx,ncols)

    coffee_data = coffee_month_sales[coffee_month_sales['coffee_name']==coffee_name]

    bars = axes[x,y].bar(coffee_data['month'],coffee_data['sum'])

    axes[x,y].bar_label(bars,fmt="%d",label_type="center")

    subtitle = f"{coffee_name} {int(coffee_data['sum'].sum())}"

    axes[x,y].set_title(subtitle)

    axes[x,y].set_xlabel('month',size=16)

    axes[x,y].set_ylabel('sum',size=16)

figure3.suptitle('coffee month sales',size=20)

plt.tight_layout()

plt.subplots_adjust(wspace=0.5)
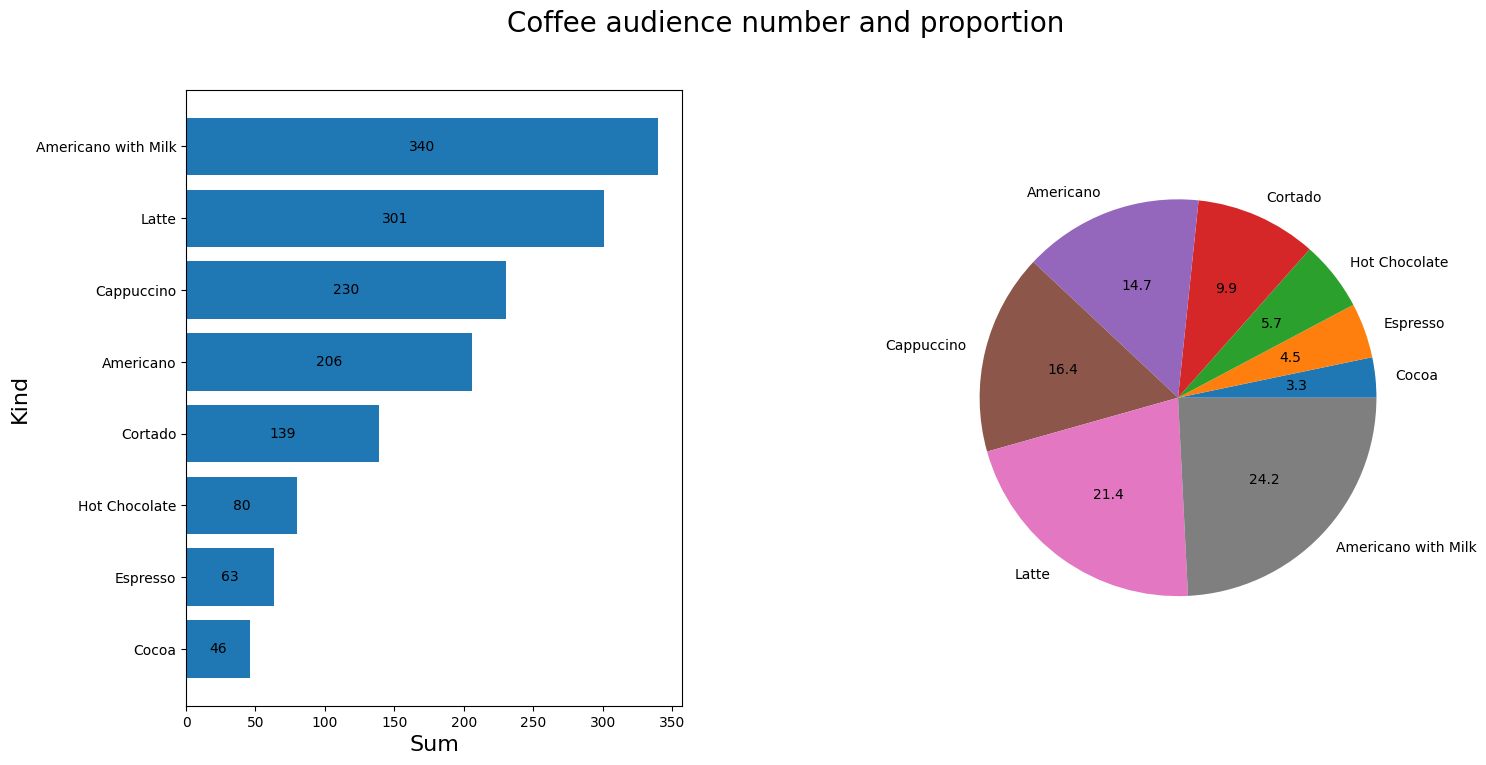
查看不同咖啡的受众人数以及占比
stati = df_six.groupby('coffee_name')['money'].count().reset_index(name='buyers')

stati.sort_values(by='buyers',ascending=True,inplace=True,ignore_index=True)

figure2,axes = plt.subplots(1,2,figsize=(16,8))

figure2.suptitle("Coffee audience number and proportion",size=20)

ax1 = axes[0].barh(stati.iloc[:,0],stati.iloc[:,1])

axes[0].bar_label(ax1,fmt="%d",label_type="center")

axes[0].set_ylabel("Kind",size=16)

axes[0].set_xlabel("Sum",size=16)

axes[1].pie(stati.iloc[:,1],labels=stati.iloc[:,0],autopct='%0.1f')

plt.subplots_adjust(wspace=0.5)
统计客户的实际消费情况
cardholder = df_six[df_six['card']!='-1'].copy()

cardholder['tag'] = 1

cardholder.drop(columns=['date','datetime','cash_type'],inplace=True)

cardholder['month_sum'] = cardholder.groupby('card')['tag'].transform('sum')
active_buyer = cardholder.groupby('card')['month_sum'].max().reset_index(name='buys')

active_buyer.sort_values(by='buys',inplace=True,ignore_index=True,ascending=False)

cardholder['money_sum'] = cardholder.groupby('card')['money'].transform('sum')

money_sum = cardholder.drop_duplicates(subset='card',ignore_index=True).copy()

money_sum.drop(columns=['money','coffee_name','month','tag','month_sum'],inplace=True)

money_sum.sort_values(by='money_sum',inplace=True,ignore_index=True,ascending=False)
result = pd.merge(active_buyer,money_sum)

print('总消费金额平均数:',result['money_sum'].mean(),'\n',

      result.head(10))
总消费金额平均数: 75.29034111310592

                   card  buys  money_sum

0  ANON-0000-0000-0012    96    2772.44

1  ANON-0000-0000-0009    67    2343.98

2  ANON-0000-0000-0141    44    1101.08

3  ANON-0000-0000-0097    38    1189.34

4  ANON-0000-0000-0040    30     910.12

5  ANON-0000-0000-0003    27     744.04

6  ANON-0000-0000-0001    17     646.14

7  ANON-0000-0000-0134    13     470.76

8  ANON-0000-0000-0024    12     422.26

9  ANON-0000-0000-0059    12     337.00
通过打印的数据可以看到这算是最活跃的一批用户了
程度大致就做到这种情况了,谢谢观看,如果有什么好的方法也可以在评论区评论!
kaggle数据集某咖啡店的营销数据分析的更多相关文章
- 下载kaggle数据集的小妙招
kaggle是很多数据分析和机器学习初学者非常喜爱的数据科学竞赛平台. 这个平台上有很多接近现实业务场景的数据集,非常适合练手. 今天向大家推荐一个下载kaggle数据集的小工具--kaggleAPI ...
- Kaggle数据集下载
Kaggle数据集下载步骤: 安装Kaggle库: 注册Kaggle账户: 找到数据集,接受rules: 在My Account>>API中,点击Create New API Token, ...
- kaggle数据挖掘竞赛初步--Titanic<原始数据分析&缺失值处理>
Titanic是kaggle上的一道just for fun的题,没有奖金,但是数据整洁,拿来练手最好不过啦. 这道题给的数据是泰坦尼克号上的乘客的信息,预测乘客是否幸存.这是个二元分类的机器学习问题 ...
- 下载kaggle数据集,验证手机号
https://blog.csdn.net/Tomxiaodai/article/details/80167765 kaggle上下载一下数据集必须手机验证,结果验证时一直提示错误输入的格式错误,试了 ...
- Python可视化查看数据集完整性: missingno库(用于数据分析前的数据检查)
数据分析之前首先要保证数据集的质量,missingno库提供了一个灵活易用的可视化工具来观察数据缺失情况,是基于matplotlib的,接受pandas数据源 快速开始 样例数据使用 NYPD Mot ...
- 通过kaggle api下载数据集
Kaggle API使用教程 https://www.kaggle.com 的官方 API ,可使用 Python 3 中实现的命令行工具访问. Beta 版 - Kaggle 保留修改当前提供的 A ...
- Iris数据集实战
本次主要围绕Iris数据集进行一个简单的数据分析, 另外在数据的可视化部分进行了重点介绍. 环境 win8, python3.7, jupyter notebook 目录 1. 项目背景 2. 数据概 ...
- Kaggle:Home Credit Default Risk 数据探索及可视化(1)
最近博主在做个 kaggle 竞赛,有个 Kernel 的数据探索分析非常值得借鉴,博主也学习了一波操作,搬运过来借鉴,原链接如下: https://www.kaggle.com/willkoehrs ...
- Kaggle案例分析1--Bestbuy
1. 引言 Kaggle是一个进行数据挖掘和数据分析在线竞赛网站, 成立于2010年. 与Kaggle合作的公司可以提供一个数据+一个问题, 再加上适当的奖励, Kaggle上的计算机科学家和数据科学 ...
- 教程 | 一文入门Python数据分析库Pandas
首先要给那些不熟悉 Pandas 的人简单介绍一下,Pandas 是 Python 生态系统中最流行的数据分析库.它能够完成许多任务,包括: 读/写不同格式的数据 选择数据的子集 跨行/列计算 寻找并 ...
随机推荐
- 强化学习是否可以AI4Science呢?
最近,华为和Google都推出了AI的天气预报系统(发表了nature.science论文,但是没开放公众使用),可以说这个传统的Science问题已经被AI算法解决,这也说明了传统Science问题 ...
- 【转载】 关于tf.stop_gradient的使用及理解
版权声明:本文为博主原创文章,遵循 CC 4.0 BY-SA 版权协议,转载请附上原文出处链接和本声明.本文链接:https://blog.csdn.net/u013745804/article/de ...
- 【转载】 windows python3 安装 openai gym 的 atari_py
版权声明:本文为CSDN博主「dai1056318647」的原创文章,遵循CC 4.0 BY-SA版权协议,转载请附上原文出处链接及本声明.原文链接:https://blog.csdn.net/dai ...
- java Hutool工具类之Excel的操作
1.背景 程序中上传下载excel是家常便饭,因此hutool给我们提供了非充强大的工具类,使用如下...... 2.使用 官方地址:https://hutool.cn/docs/#/poi/Exce ...
- Windows 修改本地hosts文件
在在使用win下面的一些php集成开发工具的时候(比如 phpstudy wampserver等) 有时候会有这样的需求:我不想通过localhost/xxx/xxx/xxx.php 这样的方式访问我 ...
- (数据科学学习手札163)ibis:极具潜力的Python数据分析框架
本文完整代码及附件已上传至我的Github仓库https://github.com/CNFeffery/DataScienceStudyNotes 1 简介 大家好我是费老师,今天要给大家介绍的Pyt ...
- JavaScript魔法:在线Excel附件上传与下载的完美解决方案
最新技术资源(建议收藏) https://www.grapecity.com.cn/resources/ 前言 在本地使用Excel时,经常会有需要在Excel中添加一些附件文件的需求,例如在Exce ...
- SMU 2024 spring 天梯赛3
SMU 2024 spring 天梯赛3 7-1 重要的话说三遍 - SMU 2024 spring 天梯赛3 (pintia.cn) I'm gonna WIN! I'm gonna WIN! I' ...
- md2pdf
https://www.pandoc.org/installing.html https://github.com/jgm/pandoc/releases/tag/2.18 https://blog. ...
- ArgoWorkflow教程(二)---快速构建流水线:Workflow & Template 概念
上一篇我们部署了 ArgoWorkflow,并创建了一个简单的流水线做了个 Demo.本篇主要分析 ArgoWorkflow 中流水线相关的概念,了解概念后才能更好使用 ArgoWorkflow. 本 ...