Aras简单报表
1.编辑Report对象类的窗体Report_Tab_Report,将xsl_stylesheet放到窗体上
2.新建报表
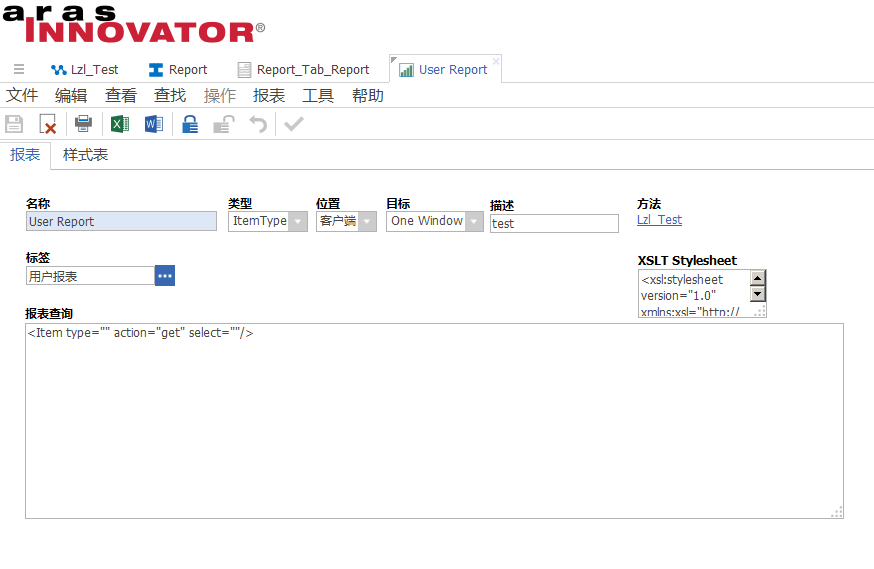
3.将编辑好的XSLT复制到xsl_stylesheet中。
<xsl:stylesheet version="1.0" xmlns:xsl="http://www.w3.org/1999/XSL/Transform" xmlns:msxsl="urn:schemas-microsoft-com:xslt" xmlns:user="urn:user-scripts" xmlns:aras="http://www.aras-corp.com">

 <xsl:output method="html" omit-xml-declaration="yes" standalone="yes" indent="yes"></xsl:output>

 <xsl:template match="/">

  <html>

   <head></head>

   <style type="text/css" userData="Global">

    .cellSolid {border-top:1px #000000 solid;border-right:1px #000000 solid;border-bottom:1px #000000 solid;border-left:1px #000000 solid;}

    .cellSolidTopRight {border-top:1px #000000 solid;border-right:1px #000000 solid;}

    .cellSolidTopLeft {border-top:1px #000000 solid;border-left:1px #000000 solid;}

    .cellSolidRightBottom {border-right:1px #000000 solid;border-bottom:1px #000000 solid;}

    .cellSolidBottomLeft {border-bottom:1px #000000 solid;border-left:1px #000000 solid;}

    .cellSolidTop {border-top:1px #000000 solid;}

    .cellSolidRight {border-right:1px #000000 solid;}

    .cellSolidBottom {border-bottom:1px #000000 solid;}

    .cellSolidLeft {border-left:1px #000000 solid;}

    .cellDashed {border-top:1px #666666 dashed;border-right:1px #666666 dashed;border-bottom:1px #666666 dashed;border-left:1px #666666 dashed;}

    .cellDashedTopRight {border-top:1px #666666 dashed;border-right:1px #666666 dashed;}

    .cellDashedTopLeft {border-top:1px #666666 dashed;border-left:1px #666666 dashed;}

    .cellDashedBottomRight {border-bottom:1px #666666 dashed;border-right:1px #666666 dashed;}

    .cellDashedBottomLeft {border-bottom:1px #666666 dashed;border-left:1px #666666 dashed;}

    .cellDashedTop {border-top:1px #666666 dashed;}

    .cellDashedRight {border-right:1px #666666 dashed;}

    .cellDashedBottom {border-bottom:1px #666666 dashed;}

    .cellDashedLeft {border-left:1px #666666 dashed;}

    .cellHeader {background-color:#CCCCCC;border-top:1px #000000 solid;border-right:1px #000000 solid;border-bottom:1px #000000 solid;padding:2px;text-align:center;text-transform:capitalize;text-align:center;font-family:helvetica;font-weight:bold;font-size:8pt;}

</style>

   <script>onload = function() {window.resizeTo(900,650);}

</script>

   <body topmargin="50" leftmargin="50">

    <table border="0" cellspacing="0" cellpadding="0" width="875">

     <tr>

      <td width="75"/>

      <td width="200"/>

      <td width="50"/>

      <td width="125"/>

      <td width="125"/>

      <td width="125"/>

      <td width="75"/>

      <td width="100"/>

     </tr>

     <tr valign="top">

      <td align="left" uniqueID="ms__id77" colspan="9">

       <img src="../imagesLegacy/Logos/aras_logo.gif" height="80"></img>

      </td>

     </tr>

     <tr valign="bottom">

      <td colspan="6" style="font-family:helvetica;font-size:15pt;color:#DA1943;padding:2px;" align="left" uniqueID="ms__id79">User Report</td>

      <td colspan="2" style="font-family:helvetica;font-size:10pt;padding:2px;" align="right" uniqueID="ms__id80">Generated on:

     <!--  <script>

      function m00(r, n){

        r += "";

        if (!n) n = 2;

        while(r.length < n){

            r = "0" + r;} return r;

        }

        var dt = new Date();

        var a = top.opener.top.aras;

        if (a){

            var s = m00(dt.getUTCFullYear(),4)+"-"+m00((dt.getUTCMonth()+1))+"-"+m00(dt.getUTCDate())+"T"+m00(dt.getUTCHours())+":"+m00(dt.getUTCMinutes())+":"+m00(dt.getUTCSeconds()); s = a.IomInnovator.GetI18NSessionContext().ConvertUtcDateTimeToNeutral(s, "yyyy-MM-ddTHH:mm:ss"); s = a.convertFromNeutral(s, "date", "short_date"); document.write(s);

        }

        </script> -->

        </td>

     </tr>

        <tr valign="top">

         <td class="cellHeader" uniqueID="ms__id81" align="left" colspan="" rowspan="" height="" width="" style="border-left:1px #666666 solid;">Name</td>

         <td class="cellHeader" uniqueID="ms__id82">Login Name</td>

         <td class="cellHeader" uniqueID="ms__id84">Date Reported</td>

         <td class="cellHeader" uniqueID="ms__id84">Reported By</td>

         <td class="cellHeader" uniqueID="ms__id85">Status</td>

        </tr>

        <xsl:for-each select="//Item">

         <xsl:sort select="name" order="ascending" case-order="upper-first" data-type="text"></xsl:sort>

         <tr valign="center">

          <td style="font-family:helvetica;font-size:8pt;font-weight:bold;border-left:1px #666666 solid;padding:2px;" class="cellSolidRightBottom" align="left" uniqueID="ms__id90" colspan="" rowspan="" height="" width="">

           <xsl:value-of select="first_name"></xsl:value-of>

           <xsl:if test="first_name='' or not(first_name)">

            <xsl:text> </xsl:text>

           </xsl:if>

          </td>

          <td style="font-family:helvetica;font-size:8pt;padding:2px;" class="cellSolidRightBottom" align="left" uniqueID="ms__id91">

           <xsl:value-of select="login_name"></xsl:value-of>

           <xsl:if test="login_name='' or not(login_name)">

            <xsl:text> </xsl:text>

           </xsl:if>

          </td>

          <td style="font-family:helvetica;font-size:8pt;padding:2px;" class="cellSolidRightBottom" align="left" uniqueID="ms__id93">

           <xsl:value-of select="created_on"></xsl:value-of>

           <xsl:if test="created_on='' or not(created_on)">

            <xsl:text> </xsl:text>

           </xsl:if>

          </td>

          <td style="font-family:helvetica;font-size:8pt;padding:2px;" class="cellSolidRightBottom" align="left" uniqueID="ms__id92">

           <xsl:value-of select="created_by_id/@keyed_name"></xsl:value-of>

           <xsl:if test="created_by_id/@keyed_name='' or not(created_by_id/@keyed_name)">

            <xsl:text> </xsl:text>

           </xsl:if>

          </td>

          <td style="font-family:helvetica;font-size:8pt;padding:2px;" class="cellSolidRightBottom" align="left" uniqueID="ms__id94">

           <xsl:value-of select="state"></xsl:value-of>

           <xsl:if test="state='' or not(state)">

            <xsl:text> </xsl:text>

           </xsl:if>

          </td>

         </tr>

        </xsl:for-each>

    </table>

   </body>

  </html>

 </xsl:template>

</xsl:stylesheet>
4.新增Method.放到第2步的报表中
var innovator = new Innovator();

var queryItem = innovator.newItem("User","get");

var prs = queryItem.apply();

var report = innovator.getItemByKeyedName("Report","User Report");

var style = report.getProperty("xsl_stylesheet");

var html = prs.applyStylesheet(style,"text");

return html;
5.将新增好的报表挂到User对象类的报表页签下面。
最终效果如图

Aras简单报表的更多相关文章
- 用stimulsoft Reports报表工具制作简单报表的过程
这是在数据库sql server中People表的数据
- FastReport.Net使用:[3]简单报表一
如何设置报表栏 1.右键报表栏相关模块进行删除. 2.使用菜单栏中的报表菜单进行添加/删除相应的栏目,选中栏目的背景会变得高亮. 3.使用报表栏编辑器. 可通过点击报表栏顶部的“设置报表栏”或者菜单栏 ...
- [deviceone开发]-echart的简单报表示例
一.简介 echart是一个常用的基于h5的报表库.这个例子简单展示了实现折线图,柱状图,圆环图和圆饼图的使用. 并实现和do的非html部分的数据交互. 二.效果图 三.相关下载 https://g ...
- Java开源报表Jasper入门(2) -- 使用JasperSoft Studio创建一个简单报表
在接下来的教程中,我们将实现一个简单的JasperReports示例,展现其基本的开发.使用流程.文章很长,不过是以图片居多,文字并不多. 实例中使用最新的Jasper Studio5.2进行报表设计 ...
- SAP 用事务码SQVI 做简单报表 .
集团计划总监要去德国参展,要一份离当前日期最近的出口欧美国家产品单价. 需要从A903,MARA,KONP,MATK 这4张表里取数. 1)Tcode:SQVI进入,如图 2) 在快速浏览处输入名称: ...
- Echarts 简单报表系列四:雷达图
代码如下: <!DOCTYPE html> <html lang="en"> <head> <meta charset="UTF ...
- Echarts 简单报表系列三:饼状图
代码如下: <!DOCTYPE html> <html lang="en"> <head> <meta charset="UTF ...
- Echarts 简单报表系列二:折线图
<!DOCTYPE html> <html lang="en"> <head> <meta charset="UTF-8&quo ...
- Echarts 简单报表系列一:柱状图
见代码: <!DOCTYPE html> <html lang="en"> <head> <meta charset="UTF- ...
随机推荐
- 【原】Java学习笔记032 - 多线程
package cn.temptation; public class Sample01 { public static void main(String[] args) { /* * [进程]:正在 ...
- 网络流 E - Escape HDU - 3605
2012 If this is the end of the world how to do? I do not know how. But now scientists have found tha ...
- 查询本地电脑IP地址
使用Windows+R键打开"运行"窗口,然后输入CMD进入命令提示窗口 进入命令窗口之后,输入:ipconfig/all 回车即可看到整个电脑的详细的IP配置信息
- RAC Wait Event: gcs log flush sync 等待事件 转
RAC Wait Event: gcs log flush sync https://www.hhutzler.de/blog/rac-wait-event_gcs_log_flush_sync/#o ...
- Idea中最最常见的快捷键
掌握如下快捷键,基本就够用了.没必要记那么多. Ø 命令:Ctrl+Shift+A可以查找所有Intellij的命令,并且每个命令后面还有其快捷键.所以它不仅是一大神键,也是查找学习快捷键的工具. ...
- [转帖]windows10,business版和consumer版本区别
windows10,business版和consumer版本区别 时间:2018-07-08 10:50来源:原创 作者:5分享 点击: 7113 次 windows10系统(1803)busines ...
- Linux查看用户所属用户组
1.查看当前用户所属用户组 [oracle@serverhl ~]$ groups oinstall dba 2.查看<user1>, <user2> 和 <user3& ...
- docker-lnmp dockerfile
code: FROM php:7.1.26-fpm WORKDIR /usr/share/nginx/html # bcmath pdo_mysql intl gd zip opcache xdebu ...
- MT【324】增量代换
实数$a,b,c$满足$a^2+b^2+c^2=1$求$f=\min\{(a-b)^2,(b-c)^2,(c-a)^2\}$的最大值 分析:由对称性不妨设$c\ge b\ge a$,令$b-a=s,c ...
- 钉钉相关功能介入开发系列一:获取access_token
获取access_token的基本代码,与微信不同的是钉钉的token正常情况下有效期为7200秒,有效期内重复获取返回相同结果,并自动续期,比微信方便多了 //基本信息 string appkey ...