
使用python解析nginx日志
性能测试时,需使用生产环境各接口请求比例分配接口请求比,nginx统计脚本如下:
import re

import pandas as pd

import xlwt

obj = re.compile(

    r'(?P<ip>.*?)- - \[(?P<time>.*?)\] "(?P<request>.*?)" (?P<request_time>.*?) (?P<status>.*?) (?P<bytes>.*?) "(?P<referer>.*?)" "(?P<ua>.*?)"')

def load_log(path):

    lst = []

    error_lst = []

    i = 0

    with open(path, mode="r", encoding="utf-8") as f:

        for line in f:

            line = line.strip()

            dic = parse(line)

            if dic:

                lst.append(dic)

            else:

                error_lst.append(line)

            i += 1

    return lst, error_lst

def NumIn(s):

    for char in s:

        if char.isdigit():

            return True

    return False

def parse(line):

    dic = {}

    try:

        result = obj.match(line)

        time = result.group("time")

        time = time.replace(" +0800", "")

        time_min = time[:17]

        time_10min = time[:16]

        time_hour = time[:14]

        dic['time'] = time

        dic['time_min'] = time_min

        dic['time_10min'] = time_10min

        dic['time_hour'] = time_hour

        request = result.group("request")

        a = request.split()[1].split("?")[0]

        c = '/'.join(a.split('/')[:5])

        b = request.split()[0]

        for item in c.split('/')[4]:

            if NumIn(item):

                c='/'.join(a.split('/')[:4])

        dic['request'] = b + " " + c

        return dic

    except:

        return False

def analyse(lst,project):

    df = pd.DataFrame(lst)

    df = df[df['request'].str.contains(project)]

    request_time_count = pd.value_counts(df['time']).reset_index().rename(columns={"index": "time", "time": "count"}).iloc[:100, :]

    request_time_min_count = pd.value_counts(df['time_min']).reset_index().rename(columns={"index": "time_min", "time_min": "count"}).iloc[:100, :]

    request_time_10min_count = pd.value_counts(df['time_10min']).reset_index().rename(columns={"index": "time_10min", "time_10min": "count"}).iloc[:100, :]

    request_time_hour_count = pd.value_counts(df['time_hour']).reset_index().rename(columns={"index": "time_hour", "time_hour": "count"}).iloc[:24, :]

    request_count = pd.value_counts(df['request']).reset_index().rename(columns={"index": "request", "request": "count"}).iloc[:, :]

    request_time_count_values = request_time_count.values

    request_time_min_count_values = request_time_min_count.values

    request_time_10min_count_values = request_time_10min_count.values

    request_time_hour_count_values = request_time_hour_count.values

    request_count_values = request_count.values

    wb = xlwt.Workbook()

    sheet = wb.add_sheet("url请求次数及占比")

    row = 0

    sheet.write(row, 0, "request_url")

    sheet.write(row, 1, "request_type")

    sheet.write(row, 2, "count")

    sheet.write(row, 3, "百分比")

    sheet.write(row, 4, "请求总数")

    row += 1

    sheet.write(row, 4, df.shape[0])

    for item in request_count_values:

        sheet.write(row, 0, item[0].split(" ")[1])

        sheet.write(row, 1, item[0].split(" ")[0])

        sheet.write(row, 2, item[1])

        sheet.write(row, 3, "%.2f%%" % (round(float(item[1]/df.shape[0]) * 100, 2)))

        row += 1

    sheet = wb.add_sheet("秒级请求数top100")

    row = 0

    sheet.write(row, 0, "time")

    sheet.write(row, 1, "count")

    row += 1

    for item in request_time_count_values:

        sheet.write(row, 0, item[0])

        sheet.write(row, 1, item[1])

        row += 1

    sheet = wb.add_sheet("分钟请求数top100")

    row = 0

    sheet.write(row, 0, "time_min")

    sheet.write(row, 1, "count")

    row += 1

    for item in request_time_min_count_values:

        sheet.write(row, 0, item[0]+':00'+"-"+item[0]+':59')

        sheet.write(row, 1, item[1])

        row += 1

    sheet = wb.add_sheet("10分钟请求数top100")

    row = 0

    sheet.write(row, 0, "time10")

    sheet.write(row, 1, "count")

    row += 1

    for item in request_time_10min_count_values:

        sheet.write(row, 0, item[0]+'0:00'+"-"+item[0]+'9:59')

        sheet.write(row, 1, item[1])

        row += 1

    sheet = wb.add_sheet("小时级请求数")

    row = 0

    sheet.write(row, 0, "timehour")

    sheet.write(row, 1, "count")

    row += 1

    for item in request_time_hour_count_values:

        sheet.write(row, 0, item[0]+':00:00'+"-"+item[0]+':59:59')

        sheet.write(row, 1, item[1])

        row += 1

    wb.save("nginx_log.xls")

if __name__ == '__main__':

    lst, error_lst = load_log(path="D:\Desktop\\****imc.log")

    analyse(lst,project='/SVC***/')
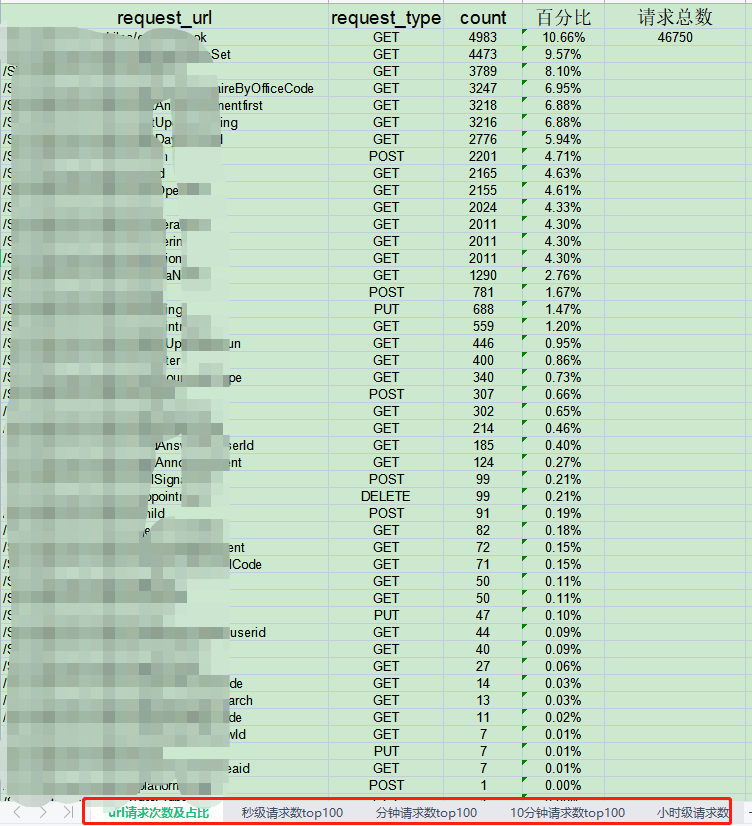
统计结果如下:
使用python解析nginx日志的更多相关文章
- python 解析nginx 日志 url
>>> import os>>> os.chdir('e:/')>>> log=open('access.log')//这两行是获取日志流> ...
- Python切割nginx日志_小组_ThinkSAAS
Python切割nginx日志_小组_ThinkSAAS Python切割nginx日志
- python解析Nginx访问日志
环境说明 python3+ pip install geoip2==2.9.0 nginx日志配置成json格式,配置如下: log_format json_log '{ "time&quo ...
- 利用python分析nginx日志
最近在学习python,写了个脚本分析nginx日志,练练手.写得比较粗糙,但基本功能可以实现. 脚本功能:查找出当天访问次数前十位的IP,并获取该IP来源,并将分析结果发送邮件到指定邮箱. 实现前两 ...
- 通过python统计nginx日志定位php网站响应慢的问题
# 公司网站反映很慢,可能是一些页面的访问方法或者页面引起,通过程序统计nginx访问日志的页面和具体的action方法访问次数以及平均响应时间可以为程序开发的同事提供参考定位具体的代码 # 默认的n ...
- Logstash使用grok插件解析Nginx日志
grok表达式的打印复制格式的完整语法是下面这样的: %{PATTERN_NAME:capture_name:data_type}data_type 目前只支持两个值:int 和 float. 在线g ...
- ELK+Redis 解析Nginx日志
一.ELK简介 Elk是指logstash,elasticsearch,kibana三件套,我们一般使用它们做日志分析. ELK工作原理图: 简单来讲ELK具体的工作流程就是客户端的logstash ...
- [日志分析]Graylog2进阶 通过正则解析Nginx日志
之前分享的 [日志分析]Graylog2采集Nginx日志 主动方式 这篇文章介绍了Graylog如何通过Graylog Collector Sidecar来采集nginx日志. 由于日志是未经处理的 ...
- Goaccess解析nginx日志备忘
参考 http://nginx.org/en/docs/http/ngx_http_log_module.html?&_ga=1.92028562.949762386.1481787781#l ...
- 使用Python 统计nginx日志前十ip访问量并以柱状图显示
脚本内容: import matplotlib.pyplot as plt # nginx_file = '10.6.11.91_access.log-2018-12-27' ip = {} #筛选n ...
随机推荐
- [DApp] ethers.js VS Moralis
ether.js 是 Web3 封装的 js 库,特别适合以太坊平台. Moralis 不仅是 Web3 的封装,还是一体化解决方案,包括服务端部署方案和适配各种链,使用范围更广. 在选择上,主要还是 ...
- [FE] uni-app 导航栏开发指南
一种是 原生导航栏添加自定义按钮.简单明了. pages.json 配置 { "path": "pages/log/log", "style" ...
- 12.prometheus监控之Domain域名过期监控
一.域名过期时间监控 域名的监控通过domain_exporter来完成 domain_exporter:https://github.com/caarlos0/domain_exporter/rel ...
- 在鼠标右键菜单中新增新建Markdown文件选项(VSCode)
引言 正常情况下,我们新建md文件有两种方式:一是通过Markdown编辑器新建,二是新建txt文件再修改后缀. 但是在Windows系统中,我们可以通过修改注册表来新增右键菜单选项.这里我们可以通过 ...
- ctfshow_web_1(困难题)
CTFshow web1(困难题) 根据前面做题经验,看见登录框基本都是跑一下爆破,弱口令等等 这里用 dirmap 目录爆破爆出来有一个 www.zip 把他下载下来 看了 login.php 和 ...
- Kubernetes:kubelet 源码分析之探针
0. 前言 kubernetes 提供三种探针,配置探针(Liveness),就绪探针(Readiness)和启动(Startup)探针判断容器健康状态.其中,存活探针确定什么时候重启容器,就绪探针确 ...
- 基于webapi的websocket聊天室(番外一)
上一篇我已经实现了聊天室,并且在协议中实现了4种类型的消息传输.其实还可以添加video,audio,live等等类型. 不过假如把目前的协议看作RCP1.0版的话,这个版本就只支持有限的4种消息.精 ...
- Java面试题:SpringBoot异常捕获,让程序“免疫”一切错误!
在Spring Boot应用程序中,捕获全局异常是一个重要的方面,它可以帮助我们处理在应用程序运行时可能发生的各种错误情况.通过适当地捕获和处理这些异常,我们可以改善用户体验并及时采取必要的措施. 使 ...
- vue xlsx组件 导出的excel表头插入内容
主要就是sheet_add_dom这个方法, dom是带有table标签元素的dom节点. timeData是个二维数组:[["条件1","条件2"],[&qu ...
- js 中你不知道的各种循环测速
在前端 js 中,有着多种数组循环的方式: for 循环: while 和 do-while 循环: forEach.map.reduce.filter 循环: for-of 循环: for-in 循 ...