
基于 Njmon + InfluxDB + Grafana 实现性能指标实时可视监控
引言
最近逛 nmon 官网时,发现了一个新工具 njmon,功能与 nmon 类似,但输出为 JSON 格式,可以用于服务器性能统计。
可以使用 njmon 来向 InfluxDB 存储服务器性能统计数据,再通过 Grafana 实时读取展示,来实现性能测试过程中的实时可视化监控服务器性能指标的目的。
当然,传统的 nmon、InfluxDB+Grafana+Jmeter等都可以实现。
验证环境
CentOS Linux release 7.6.1810 (Core)
整体架构
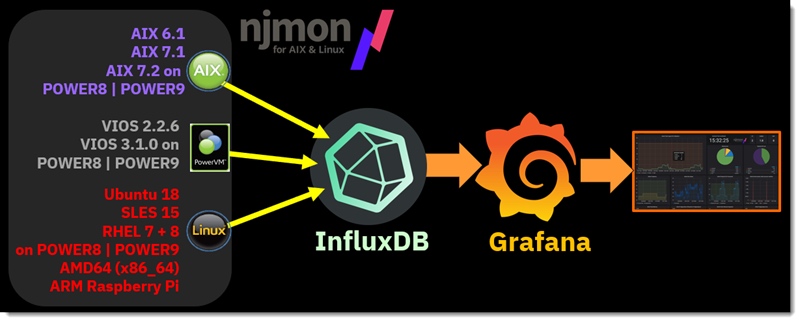

InfluxDB
InfluxDB 是一个由 InfluxData 开发的开源时序型数据。它由 Go 写成,着力于高性能地查询与存储时序型数据。InfluxDB 被广泛应用于存储系统的监控数据,IoT 行业的实时数据等场景。
InfluxDB 的语法是类 SQL 的,增删改查与 mysql 相同。InfluxDB 中的 measurement 对应的关系型数据库中的 table 。默认端口是 8086。
安装 & 启动
官方教程:https://docs.influxdata.com/influxdb/v1.7/introduction/installation/
配置 InfluxDB 的 yum 源:
$ cat <<EOF | sudo tee /etc/yum.repos.d/influxdb.repo

[influxdb]

name = InfluxDB Repository - RHEL \$releasever

baseurl = https://repos.influxdata.com/rhel/\$releasever/\$basearch/stable

enabled = 1

gpgcheck = 1

gpgkey = https://repos.influxdata.com/influxdb.key

EOF
yum 安装
# CentOS 7-, RHEL 7-

$ sudo yum install -y influxdb

$ sudo service influxdb start

# CentOS 7+, RHEL 7+

$ sudo yum install -y influxdb

$ sudo systemctl start influxdb
创建 njmon 库
$ influx

> create database njmon

> show databases

name: databases

name

----

_internal

njmon

> exit
启用用户认证
添加用户,设置权限。
# 查看所有用户

> show users

user admin

---- -----

# 创建 admin 用户,设置密码为 admin

> create user "admin" with password 'admin' with all privileges

# 再次查看用户信息,发现 admin 为 true

> show users

user admin

---- -----

admin true
InfluxDB 默认是禁用认证策略的。
# 编辑配置文件,把 [http] 下的 auth-enabled 选项设置为 true

$ vi /etc/influxdb/influxdb.conf

[http]

  ...

  auth-enabled = true

  ...

# 重启服务,配置生效

$ systemctl restart influxdb.service
njmon
njmon = nmon + JSON format + real-time push to a stats database + instant graphing of "all the stats you can eat" (AIX and Linux)
This njmon is a major overhaul of nmon for the next 10 years:
- Load more stats
- JSON format is self documenting, flexible and the performance stats format for many new tools
- Direct real-time loading of the JSON into modern open source time aware databases
- New age browser based graphing tools allow dynamic data choice and graph style per VM, per server or across the estateAll this will be covered and more including many demo's.
与 nmon 类似,但输出为 JSON 格式,可以用于服务器性能统计。
安装 njmon
官方下载总目录:https://sourceforge.net/projects/nmon/files/
# 下载

$ wget http://sourceforge.net/projects/nmon/files/njmon_linux_binaries_v53.zip

# 解压

$ unzip njmon_linux_binaries_v53.zip

# 选择相应版本,放到 local 的 bin 下

$ mv njmon_linux_RHEL7_AMD64_v53 /usr/local/bin/njmon

# 验证

$ njmon -?
njmon 统计的指标项
$ njmon -c 1 -s 1 | jq keys

[

  "cpu_total",

  "cpuinfo",

  "cpus",

  "disks",

  "filesystems",

  "identity",

  "lscpu",

  "networks",

  "os_release",

  "proc_meminfo",

  "proc_version",

  "proc_vmstat",

  "stat_counters",

  "timestamp",

  "uptime"

]
关于 jq 的功能和使用,可以参见我之前写的文章 “linux 下强大的 JSON 解析命令 jq”。
安装 njmon_tools
# 下载

$ wget http://sourceforge.net/projects/nmon/files/njmon_tools_v50.zip

# 解压

$ unzip njmon_tools_v50.zip

Archive:  njmon_tools_v50.zip

  inflating: line2pretty.py

  inflating: njmon2influx.py

  inflating: njmond.conf

  inflating: njmond.py

  inflating: njmonold2line.py

  inflating: pretty2line.py
采集数据到 InfluxDB
官方设置了多种采集方式,本教程基于 njmon2influx.py 采集方式。
修改配置文件 njmond.conf
{

    "njmon_port": 8181,

    "njmon_secret": "ignore",

    "data_inject": false,

    "data_json": true,

    "directory": "/home/njmon/data",

    "influx_host": "localhost",

    "influx_port": 8086,

    "influx_user": "admin",

    "influx_password": "admin",

    "influx_dbname": "njmon",

    "workers": 2,

    "debug": true,

    # for njmon2influx.py

    "batch": 100

}
采集数据
# 间隔 5 秒,一直采集数据

$ nohup njmon -s 5 | ./njmon2influx.py njmond.conf >/dev/null 2>&1 &

# 监控 log

$ tail -f /home/njmon/data/njmon2influx.log
InfluxDB 查询数据
# 用户名密码登录

$ influx -username admin -password admin

Connected to http://localhost:8086 version 1.7.10

InfluxDB shell version: 1.7.10

# 查看库

> show databases

name: databases

name

----

_internal

njmon

# 使用 njmon

> use njmon

Using database njmon

# 查看 measurements,有数据表示已经采集到

> show measurements

name: measurements

name

----

cpu_total

cpuinfo

cpus

disks

filesystems

identity

lscpu

networks

os_release

proc_meminfo

proc_version

proc_vmstat

stat_counters

timestamp

uptime
Grafana
Grafana 是一个跨平台的开源的度量分析和可视化工具,可以通过将采集的数据查询然后可视化的展示,并及时通知
安装
$ wget https://dl.grafana.com/oss/release/grafana-6.6.2-1.x86_64.rpm

$ sudo yum install -y grafana-6.6.2-1.x86_64.rpm
启动
# 启动并验证

$ sudo systemctl daemon-reload

$ sudo systemctl start grafana-server

$ sudo systemctl status grafana-server

# 配置自启动

$ sudo systemctl enable grafana-server.service
默认密码:admin / admin,登录地址:http://xx.xx.xx.xx:3000。
安装插件
# 安装插件 grafana-clock-panel

# 插件链接:https://grafana.com/grafana/plugins/grafana-clock-panel

$ grafana-cli plugins install grafana-clock-panel

# 安装插件 grafana-piechart-panel

# 插件链接:https://grafana.com/grafana/plugins/grafana-piechart-panel

$ grafana-cli plugins install grafana-piechart-panel

# 重启生效

$ service grafana-server restart
配置
添加数据源

选择 InfluxDB,并配置
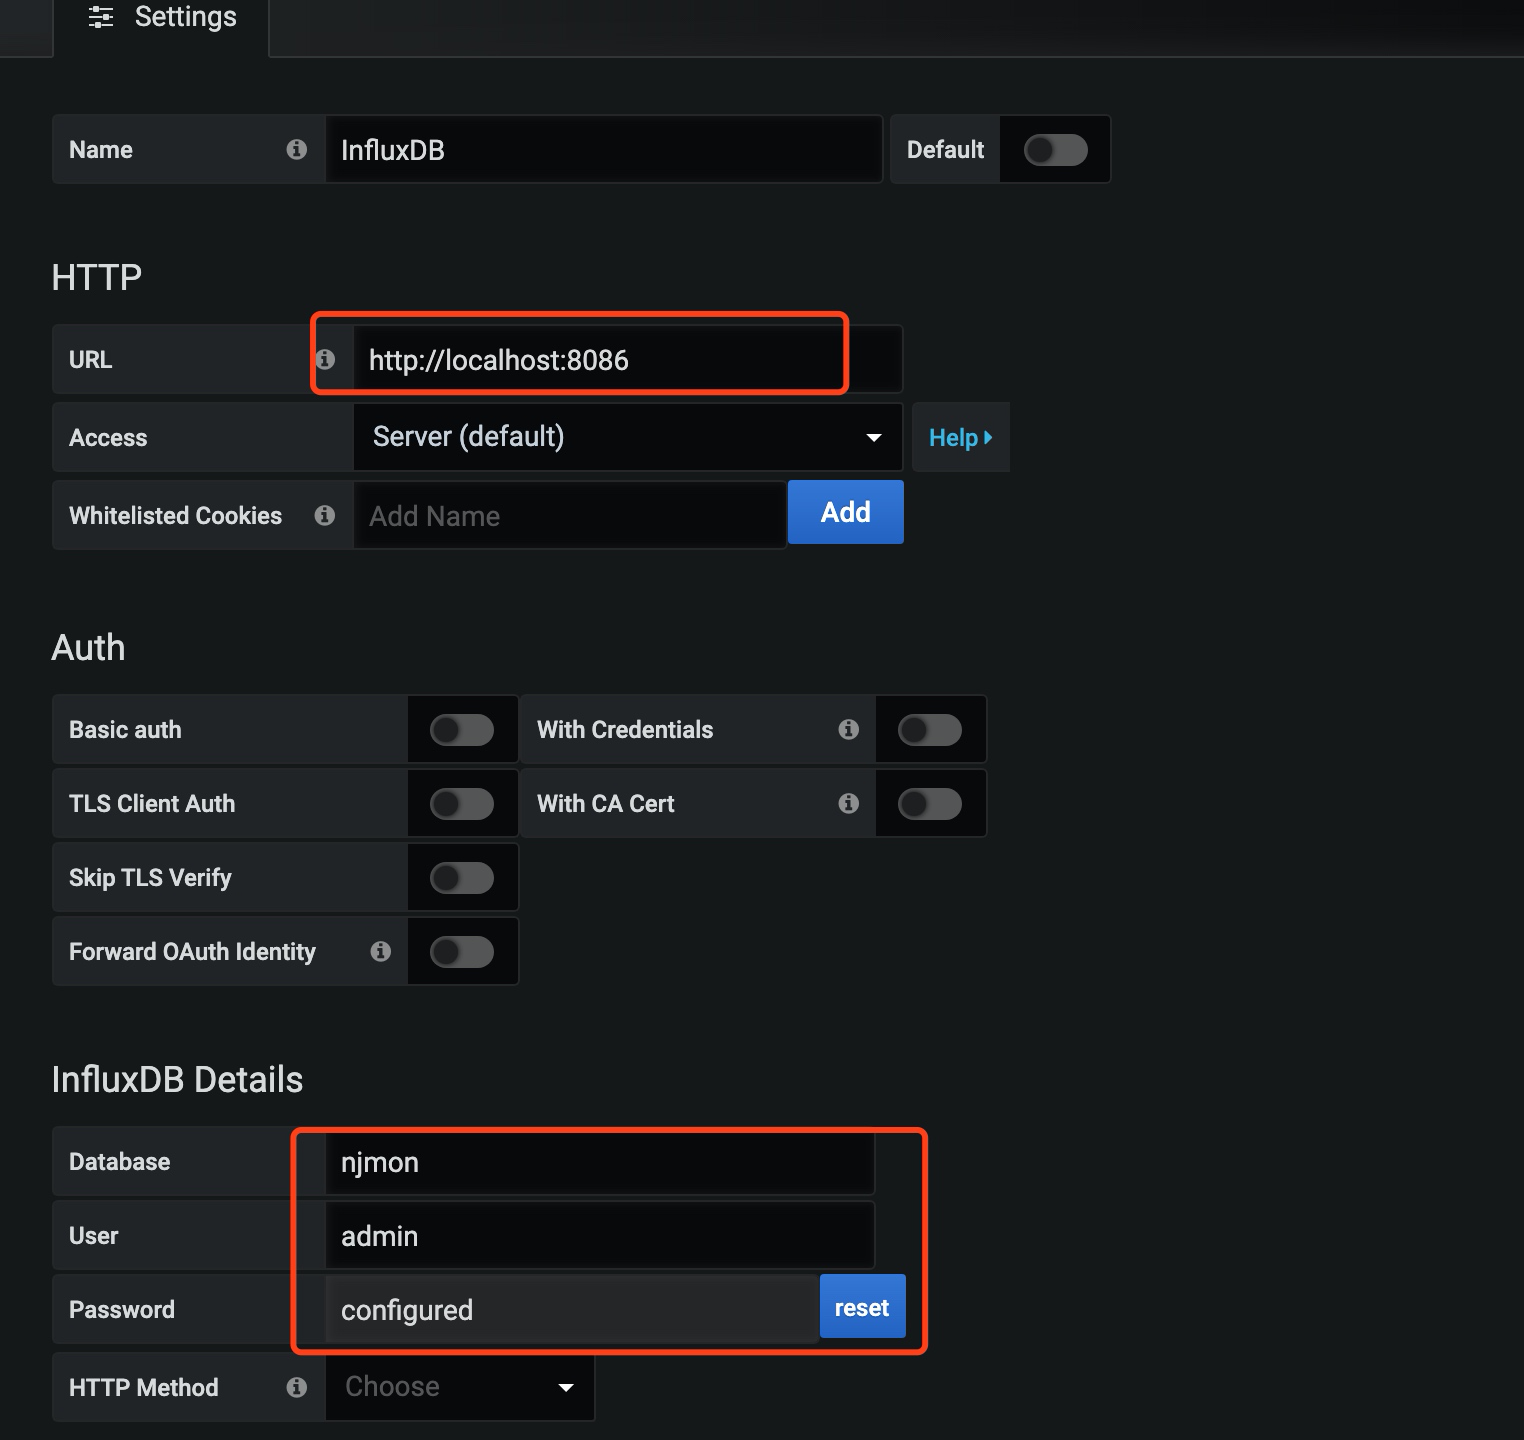
导入仪表盘模板
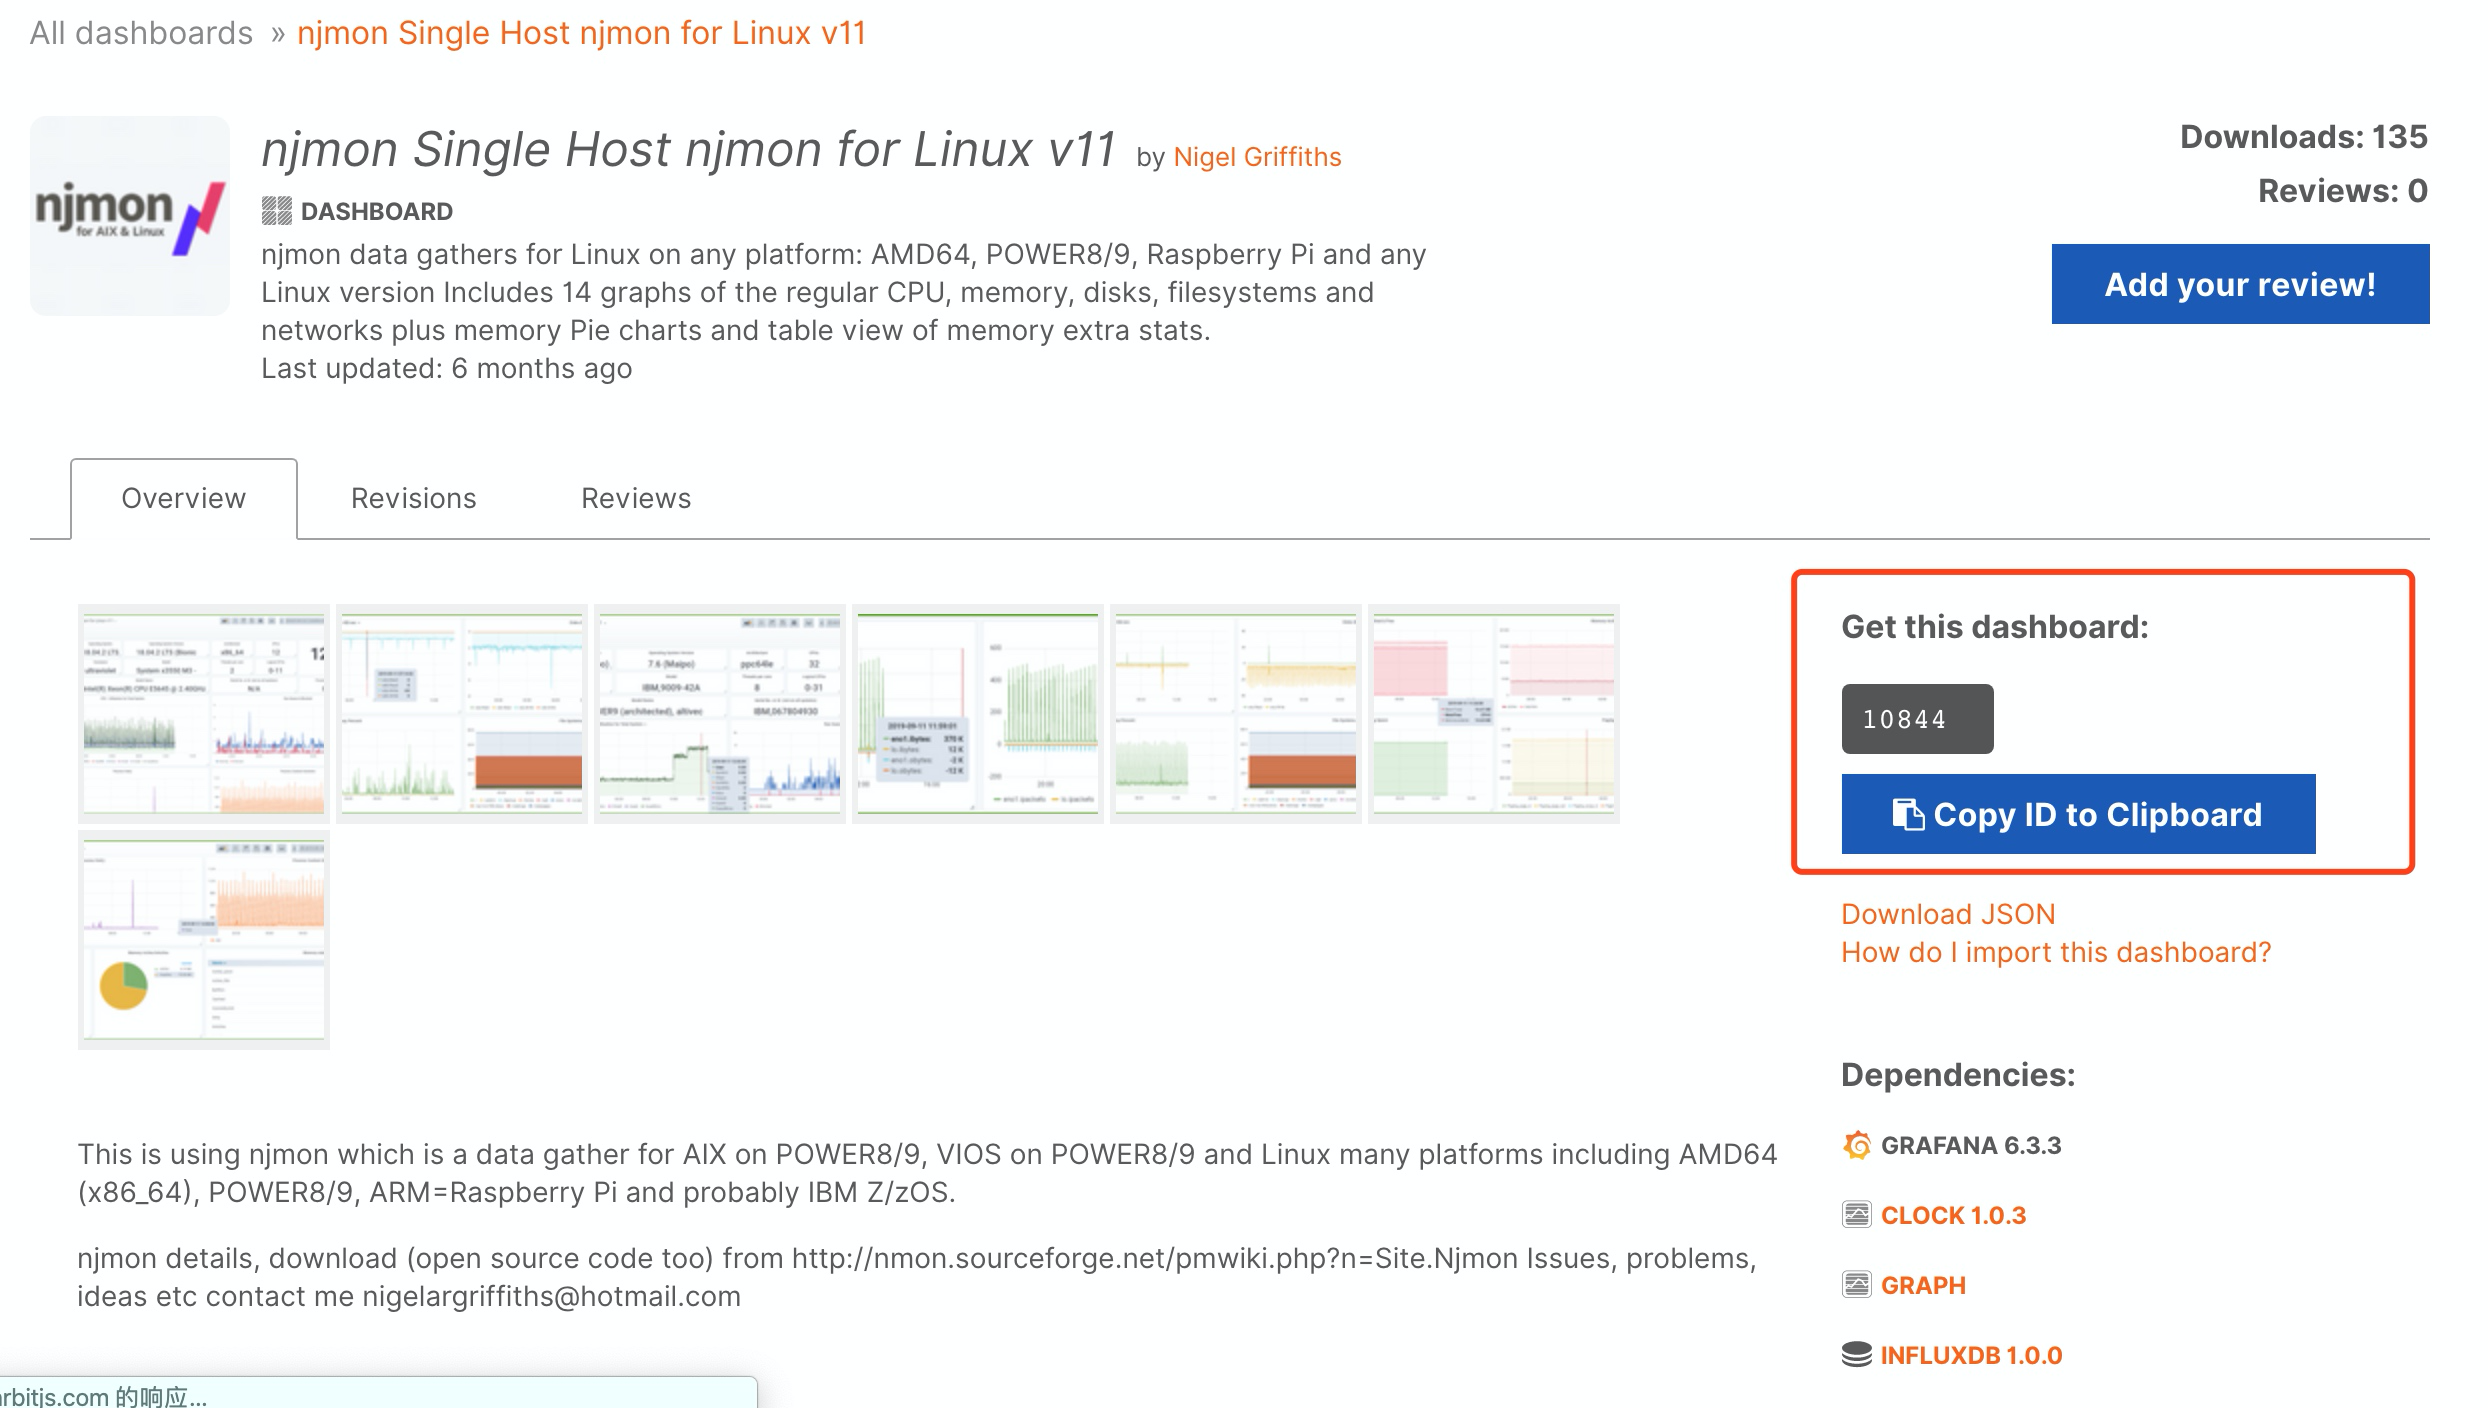
njmon 模板链接:https://grafana.com/grafana/dashboards?search=njmon
选择 “njmon Single Host njmon for Linux v11” 模板:

复制 ID ,在 Grafana 中导入即可:

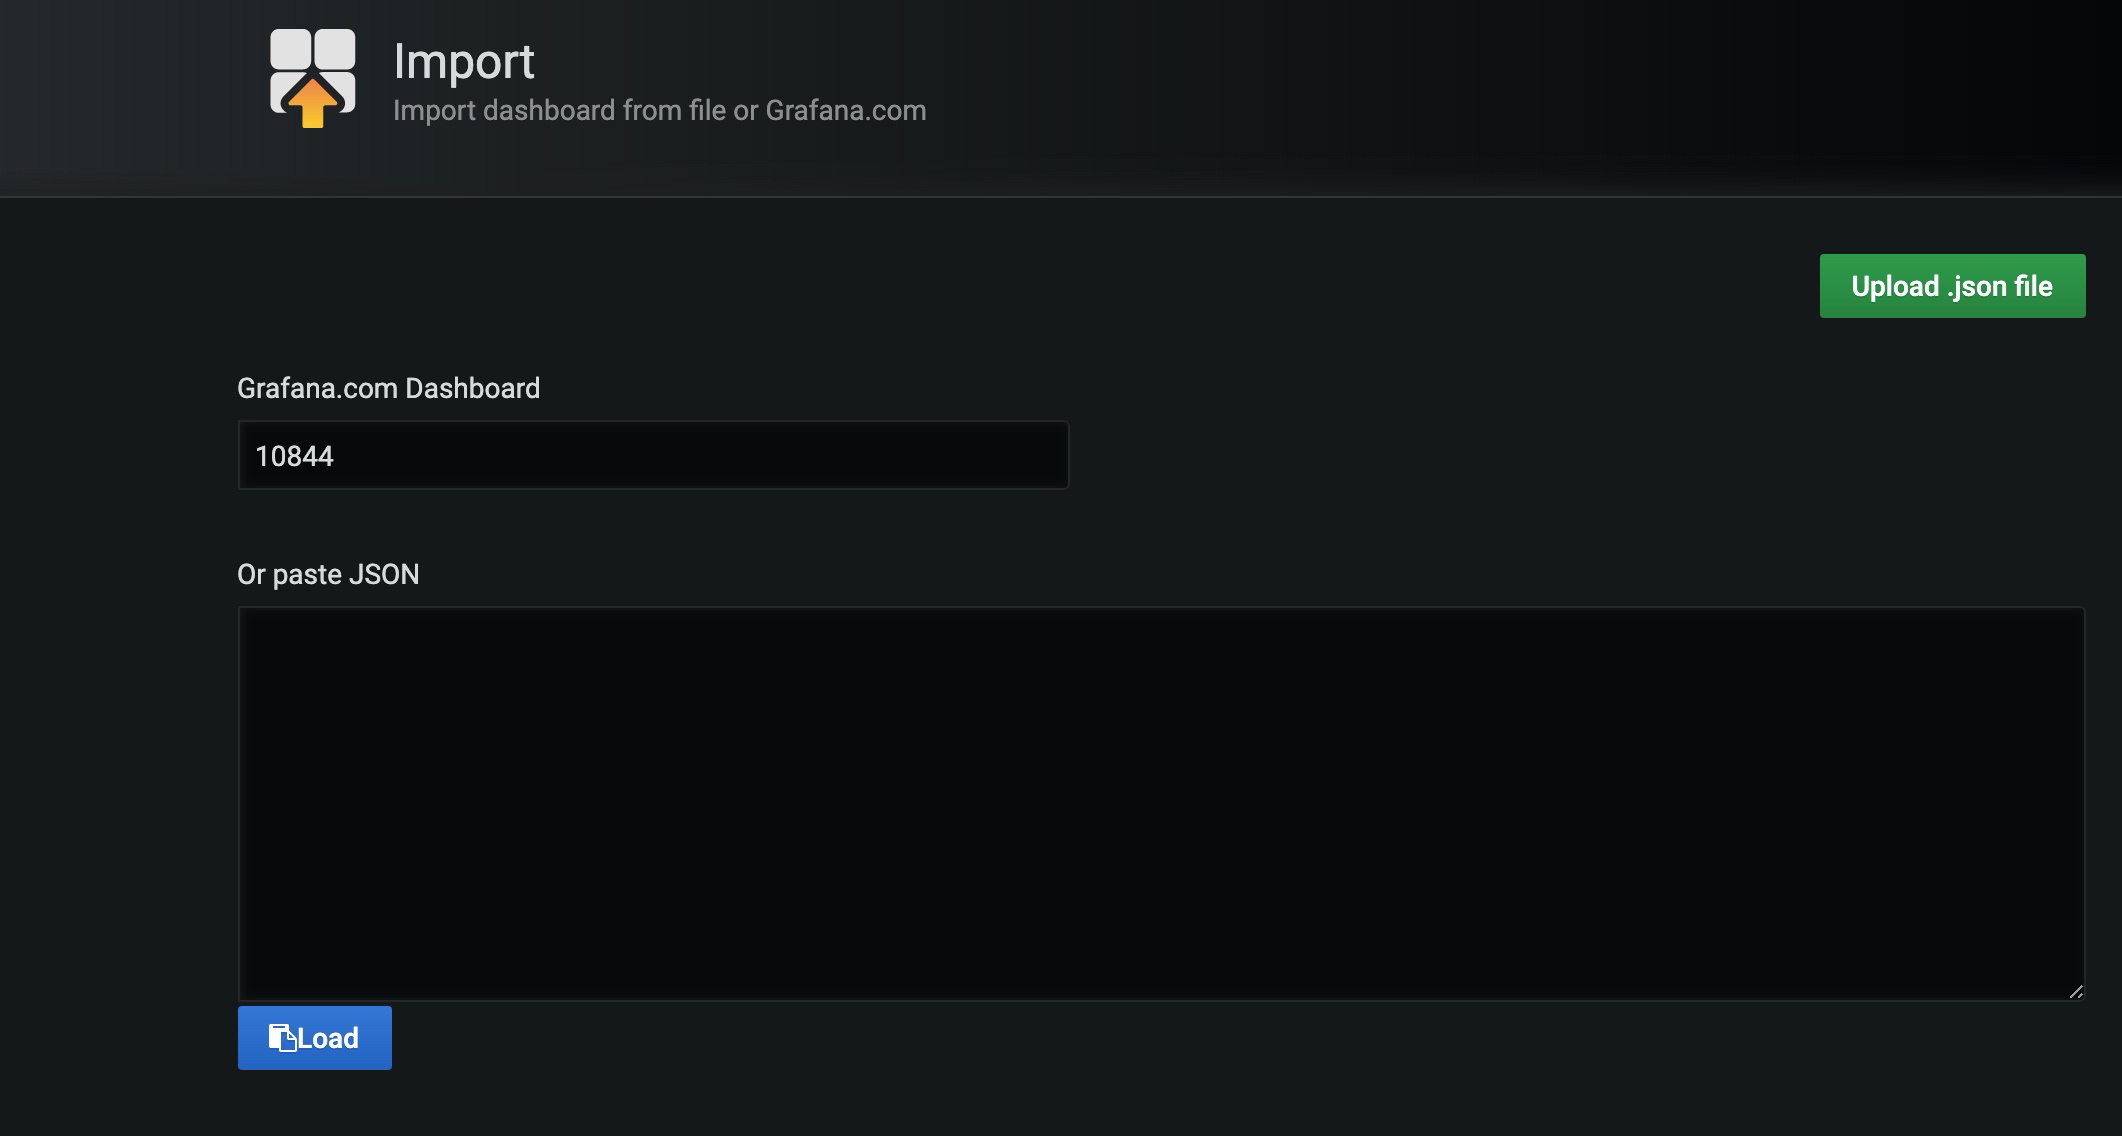
选择 InfluxDB。
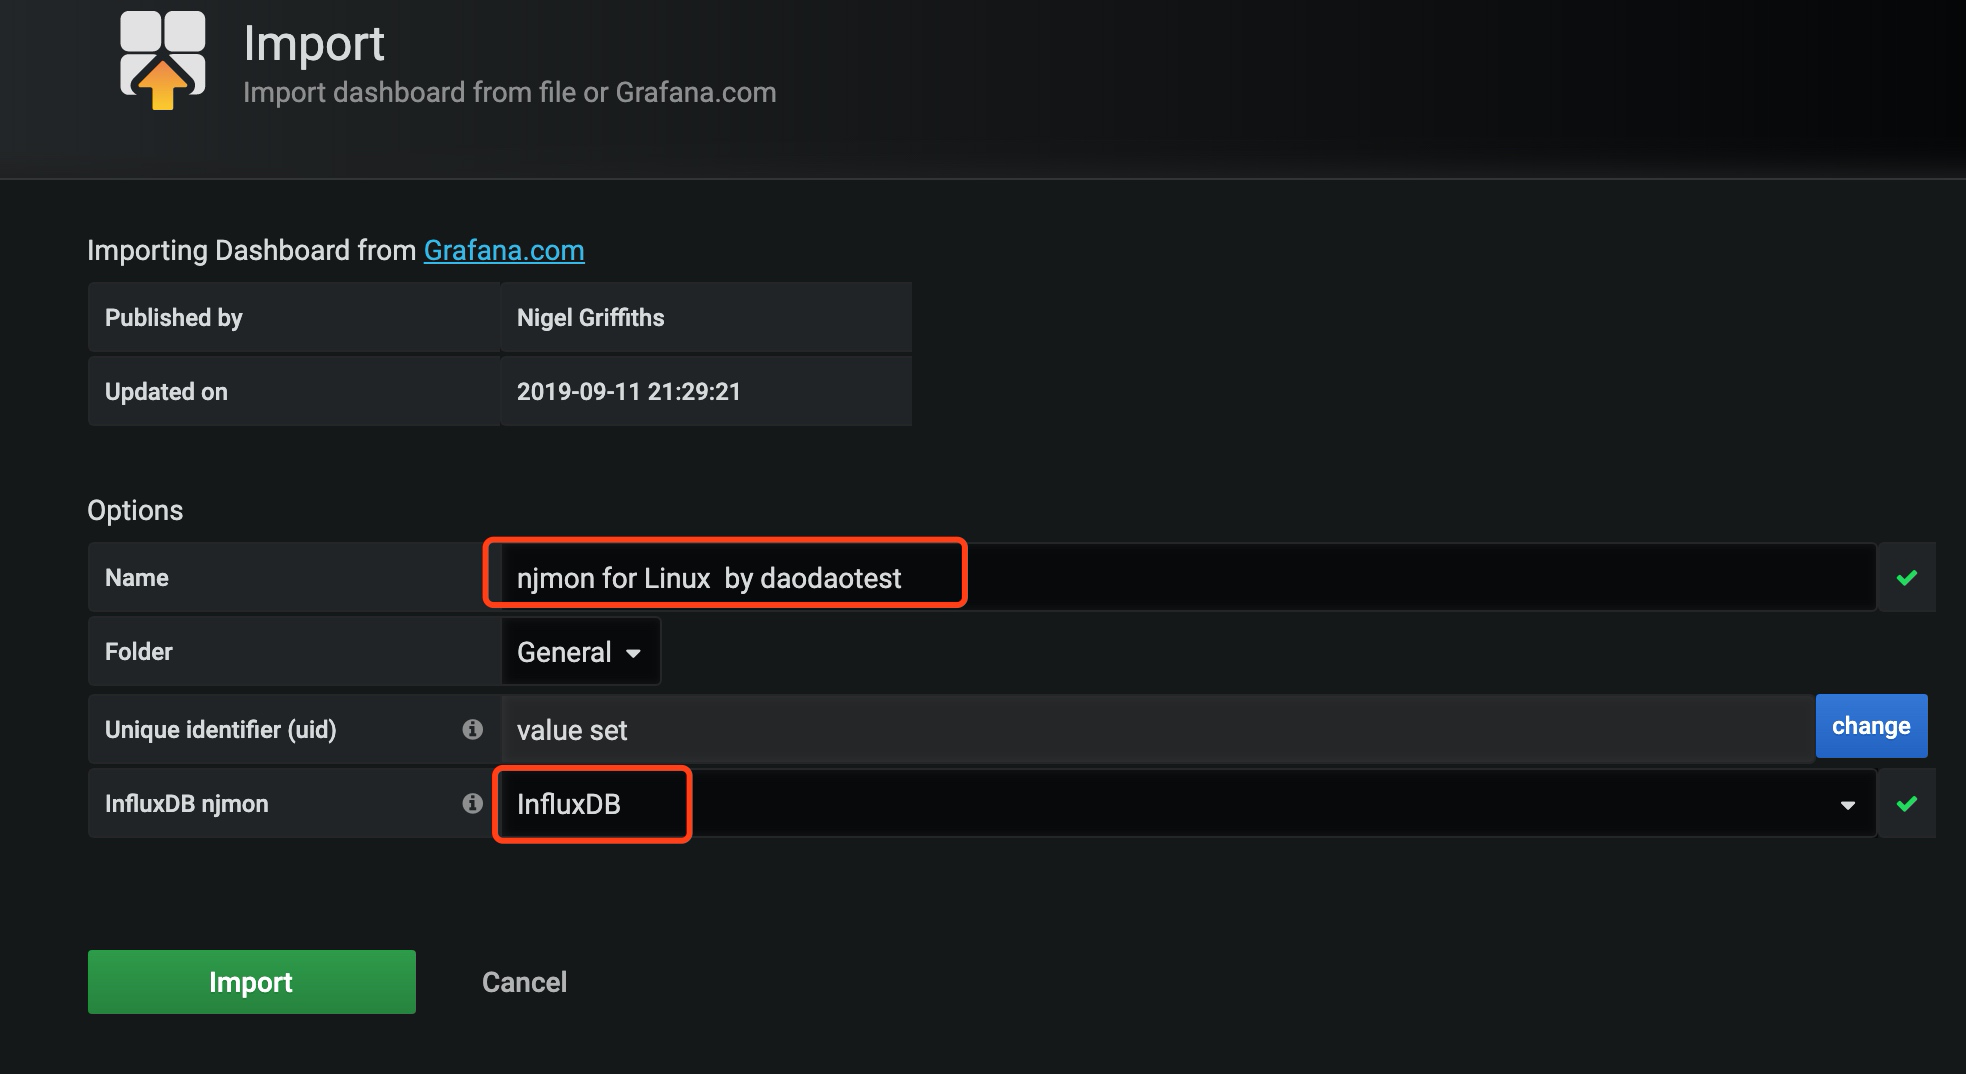
导入完成。
查看监控数据
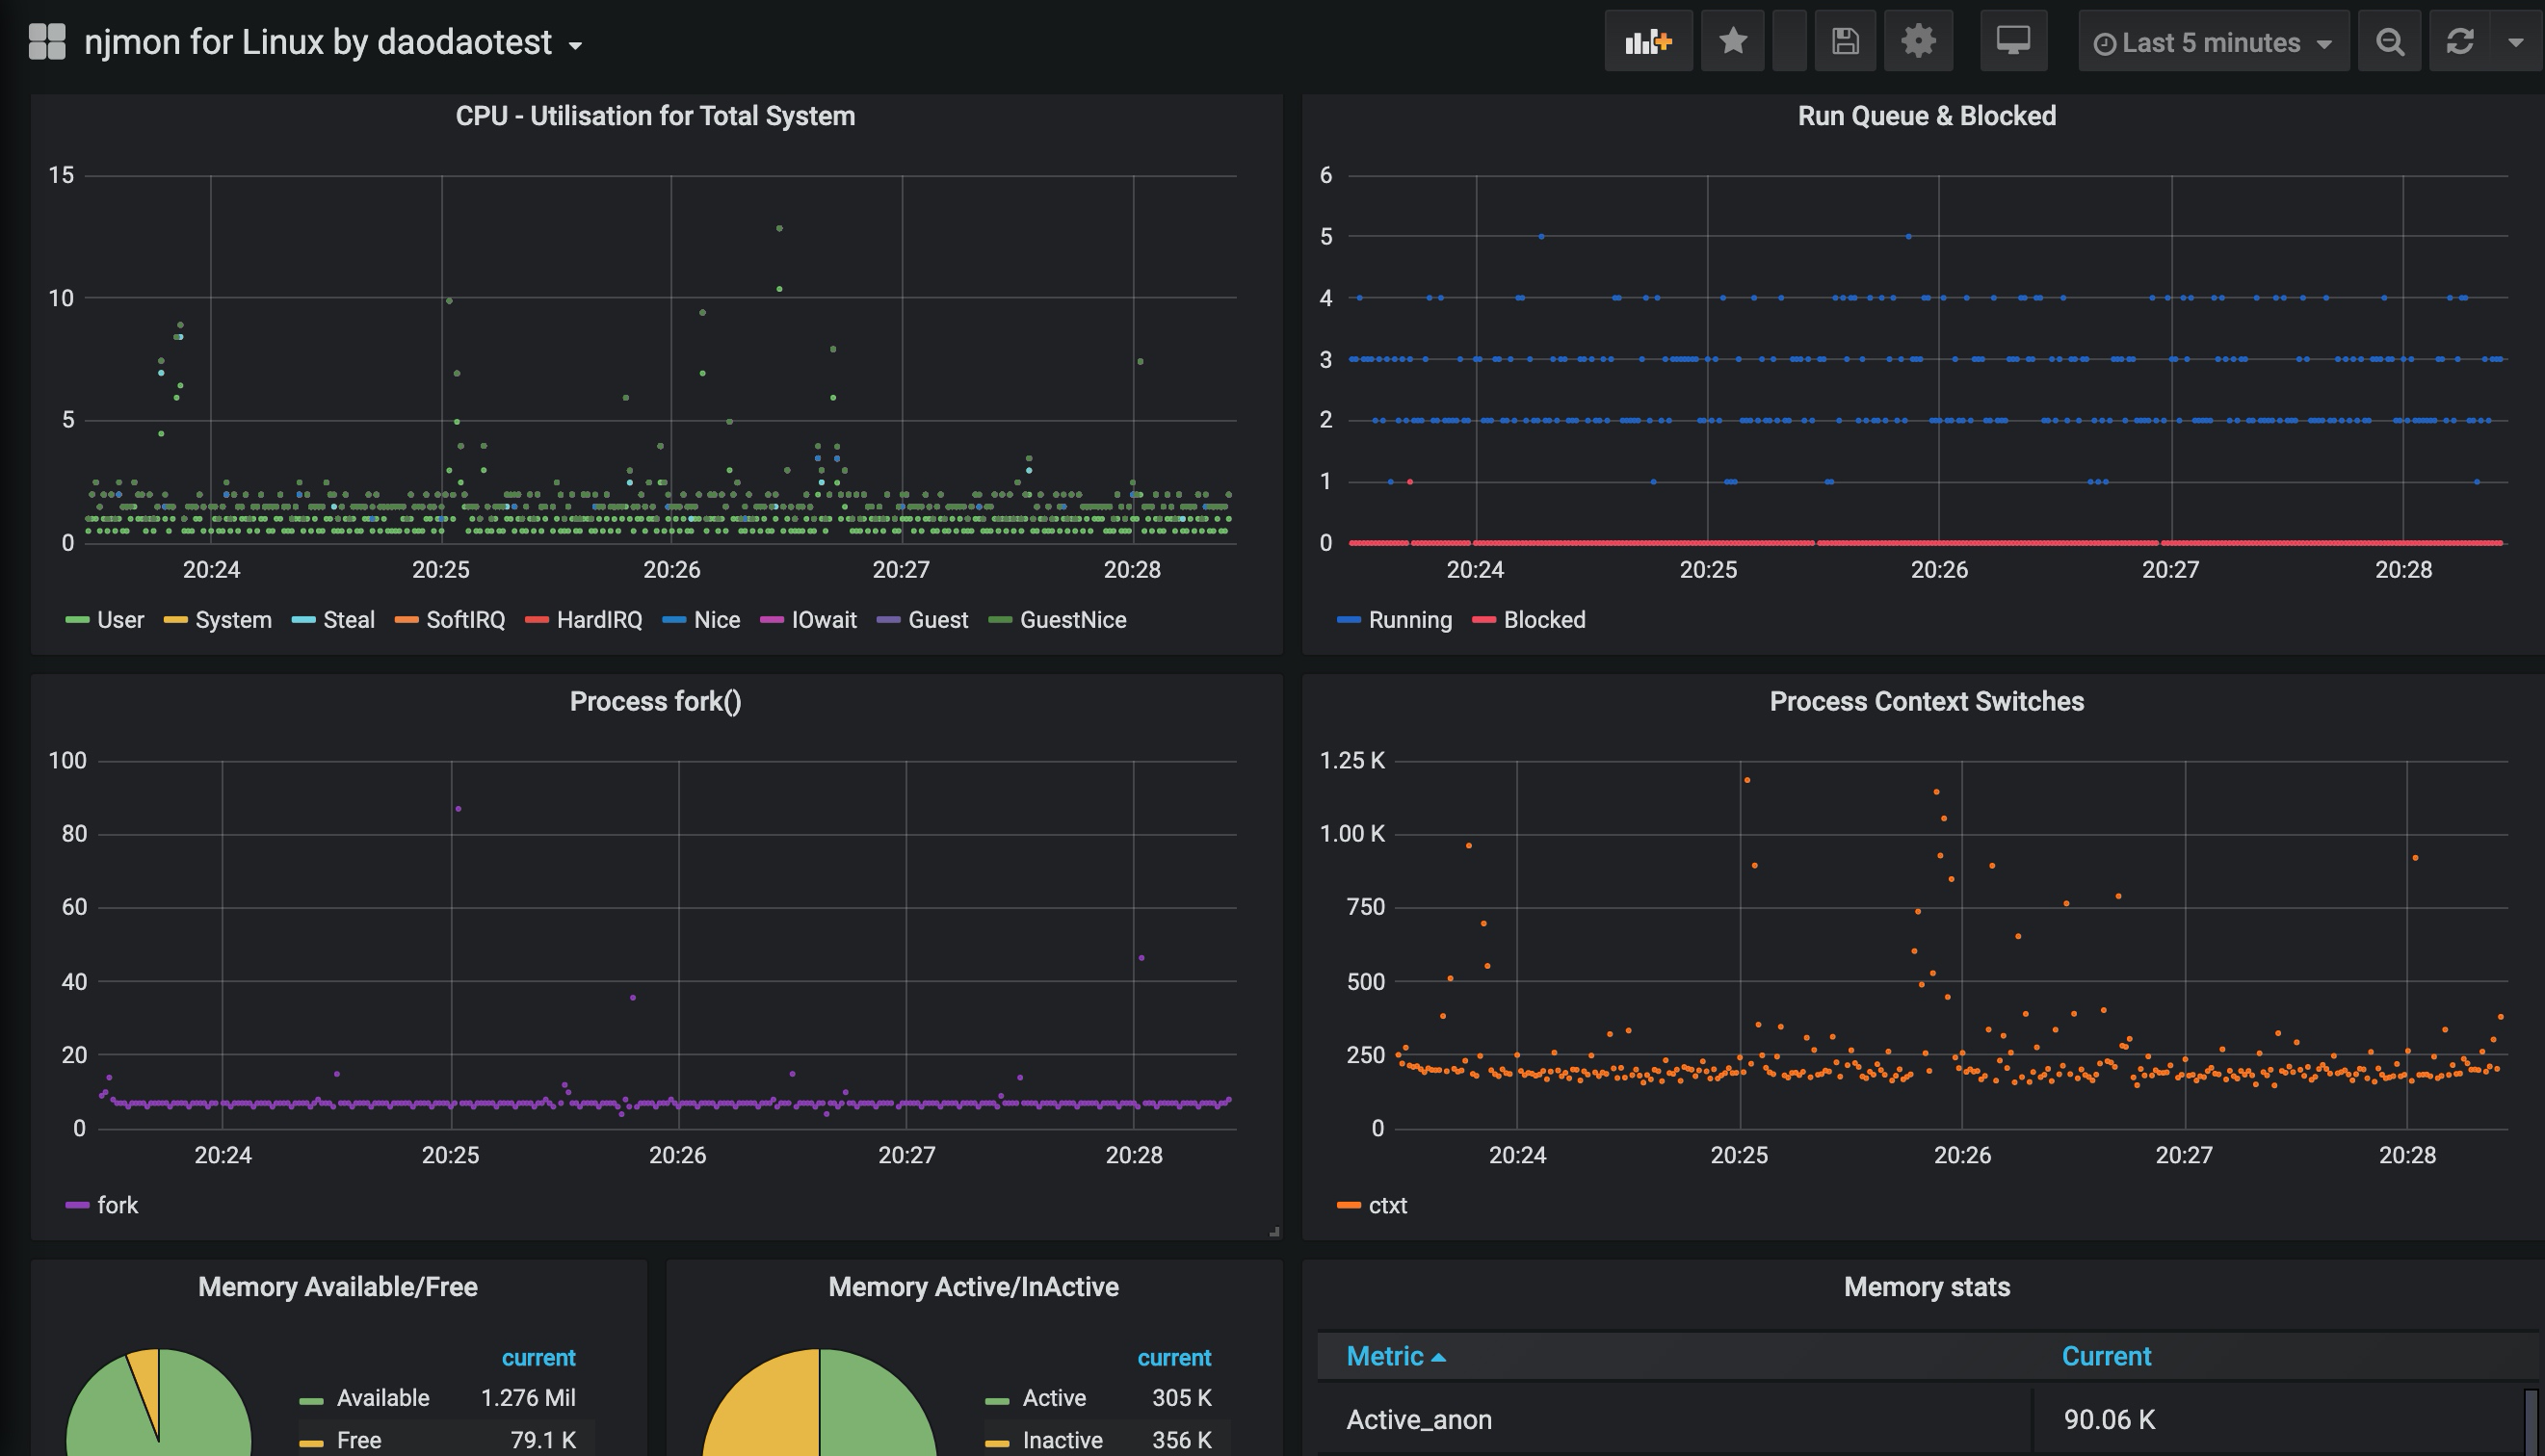

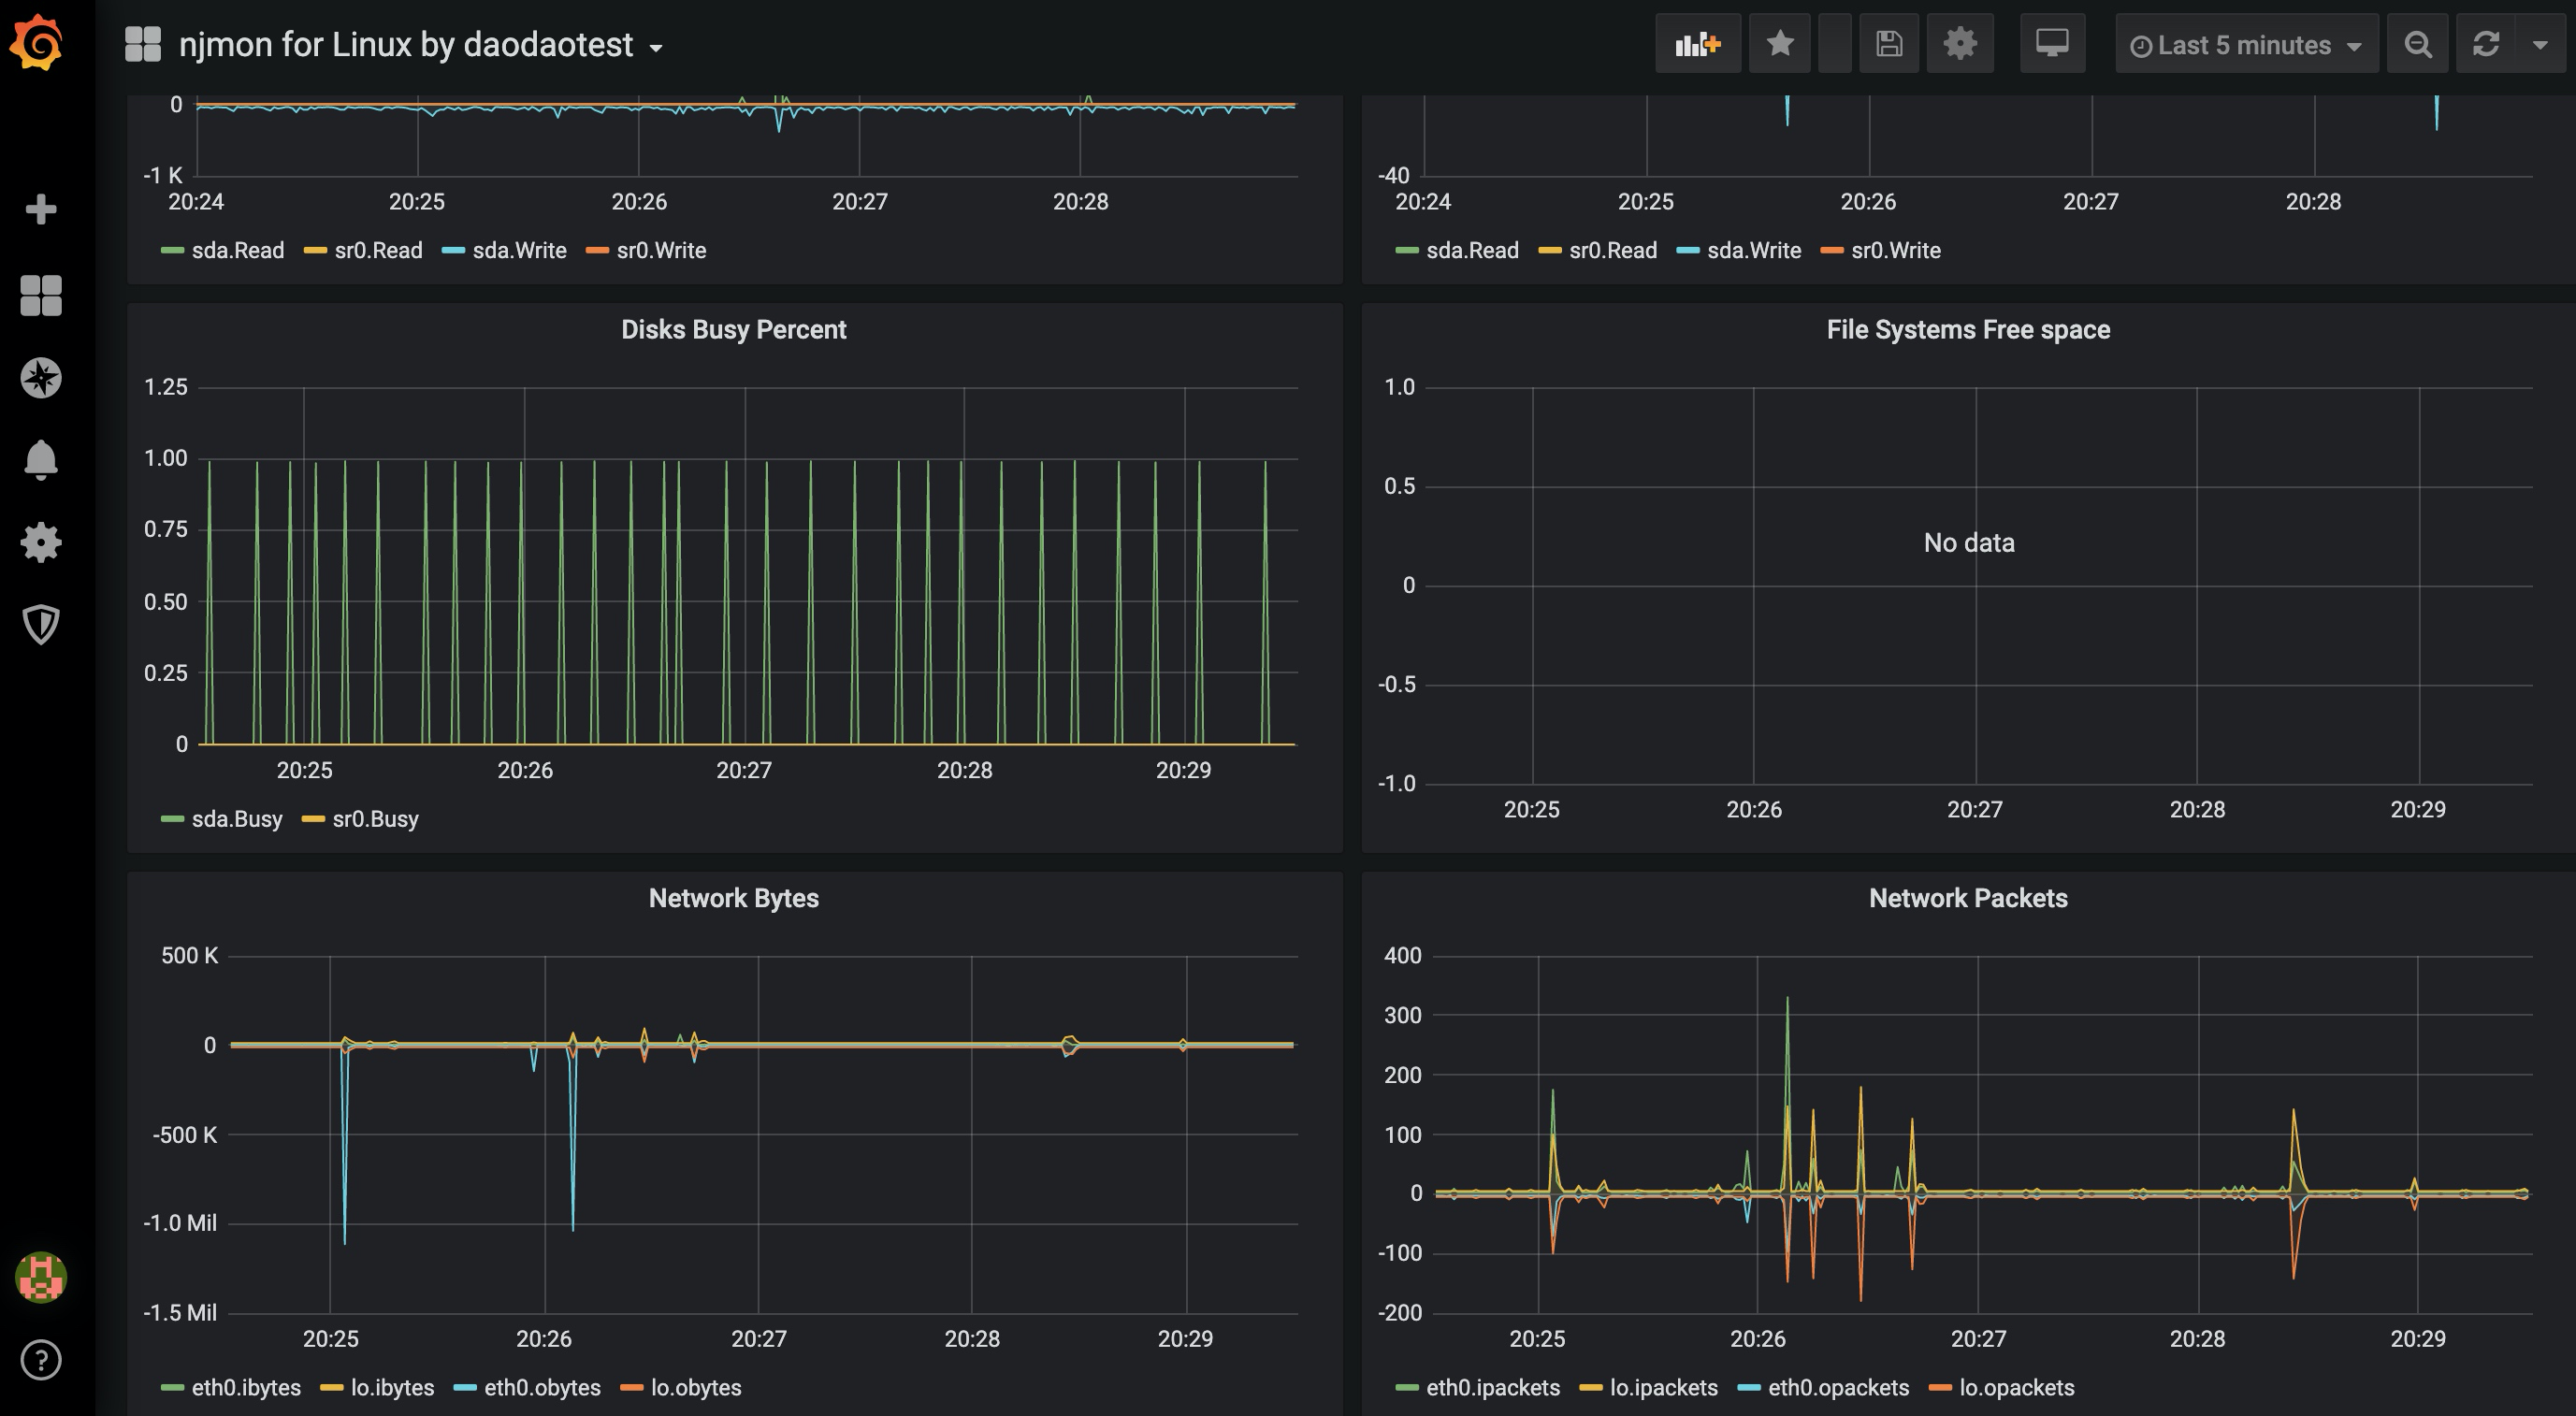
参考资料
- http://nmon.sourceforge.net/pmwiki.php?n=site.njmon
- https://docs.influxdata.com/influxdb/v1.7/introduction/installation/
- https://www.readkong.com/page/njmon-is-nmon-but-saving-to-json-format-for-modern-4222619
基于 Njmon + InfluxDB + Grafana 实现性能指标实时可视监控的更多相关文章
- .Net Core 2.*+ InfluxDB+Grafana+App Metrics实时性能监控
前言 .net core 2.* 实施性能监控 这个工具其实给运维 大大们用起来是更爽的.但是Grafana现在还没有找到中文版. 本文需要了解的相关技术与内容: InfluxDb(分布式时序数据库, ...
- [系统集成] 基于telegraf, influxdb, grafana 建立 esxi 监控
之前在 nagios 上建立了 esxi 监控,指标少.配置麻烦.视觉效果差.最近我把 esxi 监控迁移到了 influxdb+grafana 平台上,无论是监控指标.可操作性还是视觉效果都有了很大 ...
- Telegraf+InfluxDB+Grafana快速搭建实时监控系统 监控postgresql
Telegraf+InfluxDB+Grafana快速搭建实时监控系统 监控postgresql
- [转帖] 基于telegraf, influxdb, grafana 建立 esxi 监控
[系统集成] 基于telegraf, influxdb, grafana 建立 esxi 监控 https://www.cnblogs.com/hahp/p/7677420.html 之前在 nagi ...
- 搭建jmeter+influxdb+grafana压测实时监控平台(超详细,小白适用)
1.前言 在使用jmeter做性能测试的时候,监控系统性能的时候,无论是使用插件还是报告生成,都没法实现实时监控.使用JMeter+Influxdb+Grafana可以实现实时监控. 本次环境搭建各软 ...
- Metrics.net + influxdb + grafana 构建WebAPI的自动化监控和预警
前言 这次主要分享通过Metrics.net + influxdb + grafana 构建WebAPI的自动化监控和预警方案.通过执行耗时,定位哪些接口拖累了服务的性能:通过请求频次,设置适当的限流 ...
- 【jmeter】基于InfluxDB&Grafana的JMeter实时性能测试数据的监控和展示
本文主要讲述如何利用JMeter监听器Backend Listener,配合使用InfluxDB+Grafana展示实时性能测试数据 关于JMeter实时测试数据 JMeter从2.11版本开始,命令 ...
- jmeter --- 基于InfluxDB&Grafana的JMeter实时性能测试数据的监控和展示
转自:https://blog.csdn.net/RickyOne_RR/article/details/50637839 本文主要讲述如何利用JMeter监听器Backend Listener,配合 ...
- 转:基于InfluxDB&Grafana的JMeter实时性能测试数据的监控和展示
本文主要讲述如何利用JMeter监听器Backend Listener,配合使用InfluxDB+Grafana展示实时性能测试数据 关于JMeter实时测试数据 JMeter从2.11版本开始,命令 ...
随机推荐
- SSL/TLS 安全测试
本文介绍了使用半自动化工具执行SSL&TLS安全性评估的过程,以及如何使用手动及工具的测试方法验证并发现问题.目的是优化TLS和SSL安全测试流程,帮助信息安全顾问在渗透测试时在TLS / S ...
- ubuntu在github上传项目
GitHub是一个面向开源及私有软件项目的托管平台,因为只支持git 作为唯一的版本库格式进行托管,故名GitHub. 作为开源代码库以及版本控制系统,Github拥有超过900万开发者用户.随着越来 ...
- Codeforces Add on a Tree
Add on a Tree time limit per test 1 second memory limit per test 256 megabytes input standard input ...
- 服务器安装 mongodb
参考 https://www.cnblogs.com/layezi/p/7290082.html
- tensorflow CNN 卷积神经网络中的卷积层和池化层的代码和效果图
tensorflow CNN 卷积神经网络中的卷积层和池化层的代码和效果图 因为很多 demo 都比较复杂,专门抽出这两个函数,写的 demo. 更多教程:http://www.tensorflown ...
- VBScript - 动态 Array 实现方法大全!
记录一些方法,关于 VBScript 中,动态 Array 的实现 ,也适用于 VBA, 很久以前,写 VBA 的时候,就觉得使用 Array 很不方便,因为大小固定, 当时想的是,要是 Array ...
- 实战级Stand-Alone Self-Attention in CV,快加入到你的trick包吧 | NeurIPS 2019
论文提出stand-alone self-attention layer,并且构建了full attention model,验证了content-based的相互关系能够作为视觉模型特征提取的主要基 ...
- 6L-单向链表实现
关注公众号 MageByte,有你想要的精彩内容.文中涉及的代码可访问 GitHub:https://github.com/UniqueDong/algorithms.git 上一篇<链表导论心 ...
- nexus Maven私服的相关配置
Maven私服中如需本地上传Maven私服内容则需在 setting.xml中配置如下: <server> <id>nexus-releases</id> < ...
- 《Three.js 入门指南》1.3 - Three JS 功能预览
[部分中英文对照] Cameras(照相机,控制投影方式) Camera OrthographicCamera 正交相机 PerspectiveCamera 透视相机 Core(核心对象) Buffe ...