
.Net Core 2.*+ InfluxDB+Grafana+App Metrics实时性能监控
前言
.net core 2.* 实施性能监控
这个工具其实给运维 大大们用起来是更爽的。但是Grafana现在还没有找到中文版。
本文需要了解的相关技术与内容:
InfluxDb(分布式时序数据库,开源)(注:分布式部分已商业化最新的分布式版本已不在开源,单例的继续开源)
Grafana(开源的,功能齐全的度量仪表盘和图形编辑器)
App Metrics(主角,开源的支持.NET Core的监控插件,采用管道注入的方式,对代码的入侵性极小)
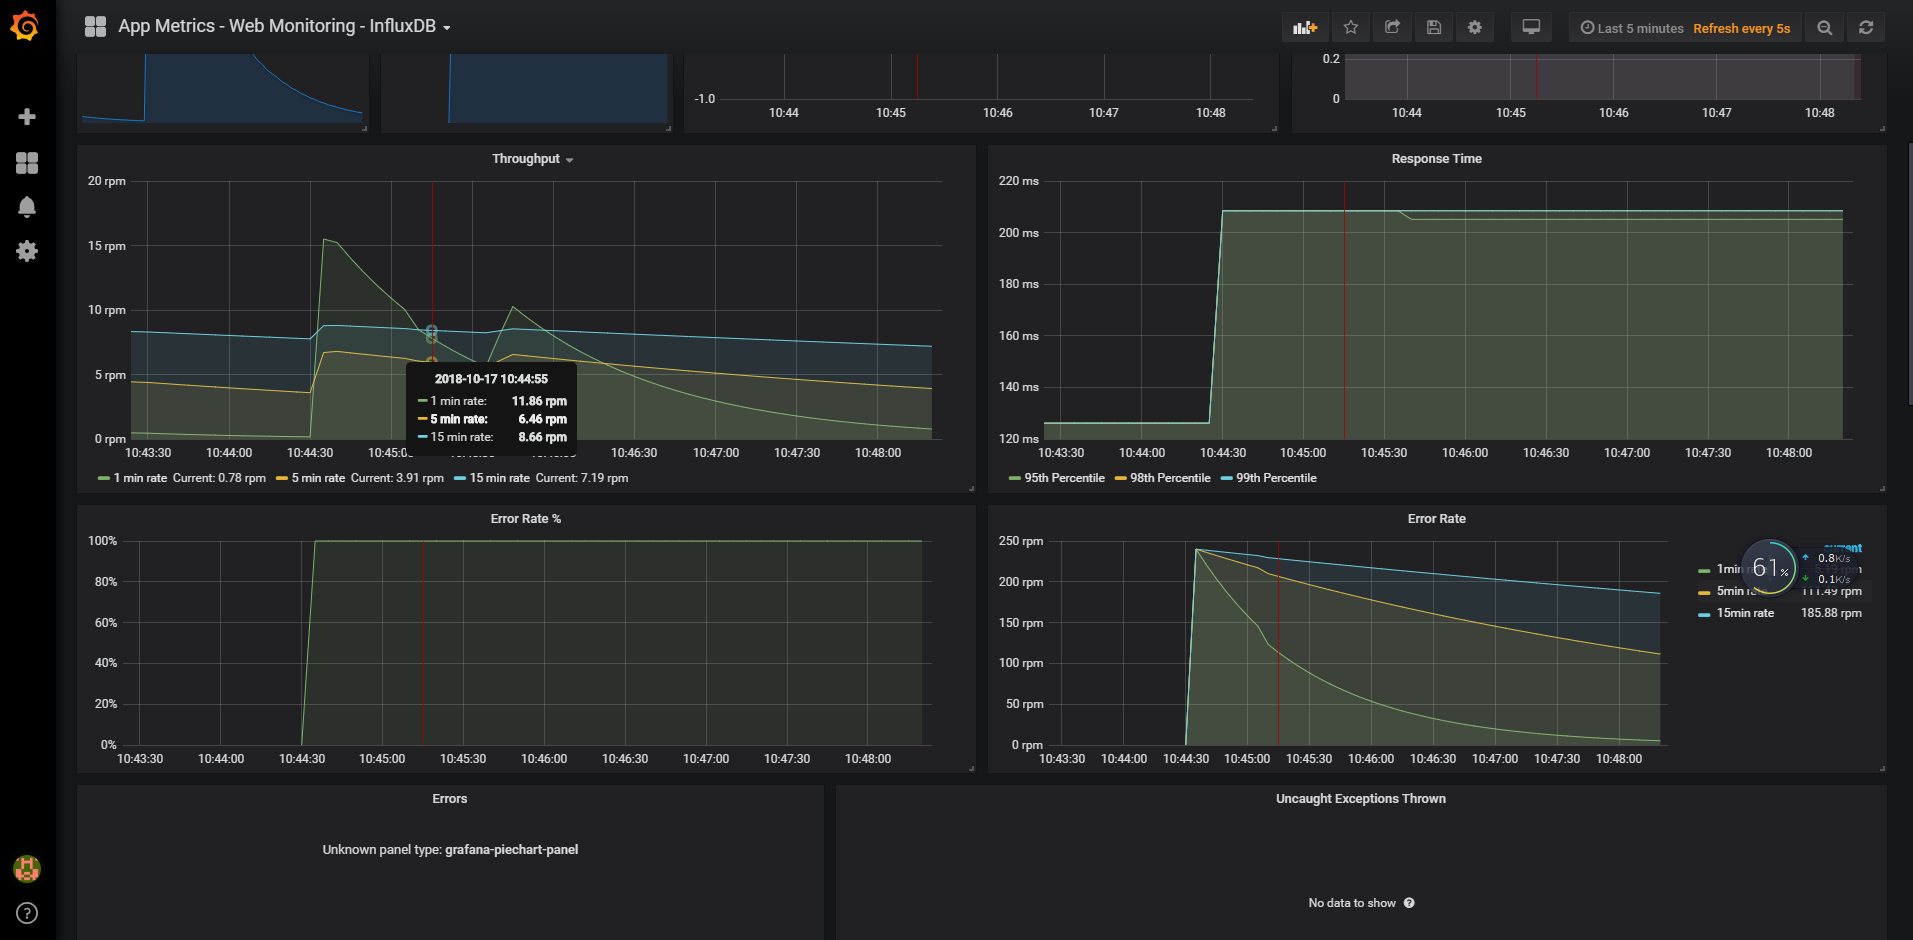
效果图
安装influxdb
influxdb在1.*版本之后就不再有网页版本了。
所以大家选择版本的时候一定要注意这个事情免得找不到influxdb 的 admin控制台
下载地址
https://dl.influxdata.com/influxdb/releases/influxdb-1.6.3_windows_amd64.zip
我这里选择的是1.6.3版本
解压文件夹之后进行如下配置,打开config中的配置文件
修改如下几项目
[meta]

  # Where the metadata/raft database is stored

  dir = "D:/influxdb/meta"

[data]

  # The directory where the TSM storage engine stores TSM files.

  dir = "D:/influxdb/data"

  # The directory where the TSM storage engine stores WAL files.

  wal-dir = "D:/influxdb/wal"
如果使用的是1.*之前的版本就可以打开admin控制台
配置是这样的
[admin]

  # Determines whether the admin service is enabled.

   enabled = true

  # The default bind address used by the admin service.

   bind-address = ":8083"
然后运行influxdb
influxd -config influxdb.conf
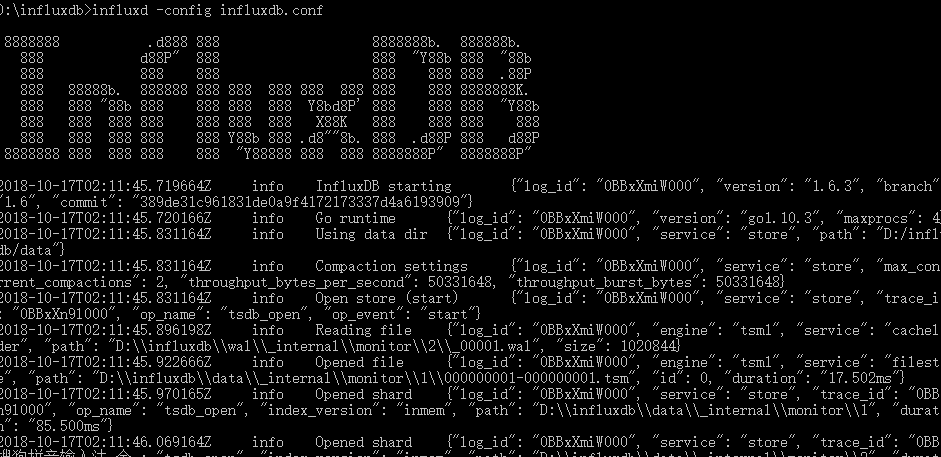
运行起来之后就是这个样子
好多 人都使用了1.*之后的版本,没有admin控制台给大家 推荐一个工具
InfluxDBStudio-0.1.0 用这个货创建一个数据库就可以了
配置Grafana
下载地址:
https://s3-us-west-2.amazonaws.com/grafana-releases/release/grafana-5.3.1.windows-amd64.zip
解压之后 在文件夹之后直接运行这个程序
grafana-server.exe
Grafana默认会监听3000的端口,所以我们进入
http://127.0.0.1:3000,

默认账号密码:admin admin
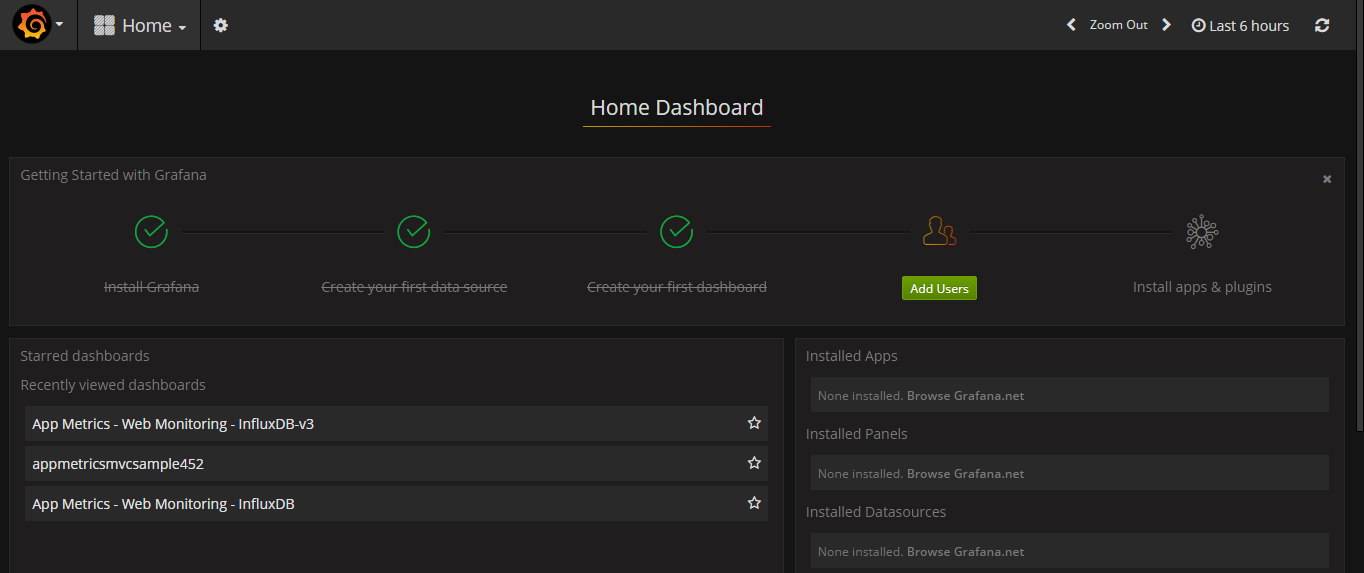
就是这样的效果啦
安装默认的模板
地址如下:https://grafana.com/dashboards/2125
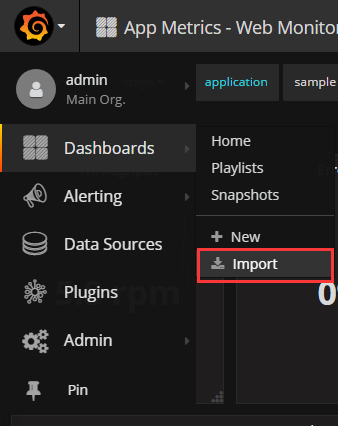
这里选择刚才我们下载的json文件就可以,或者直接输入2125都可以
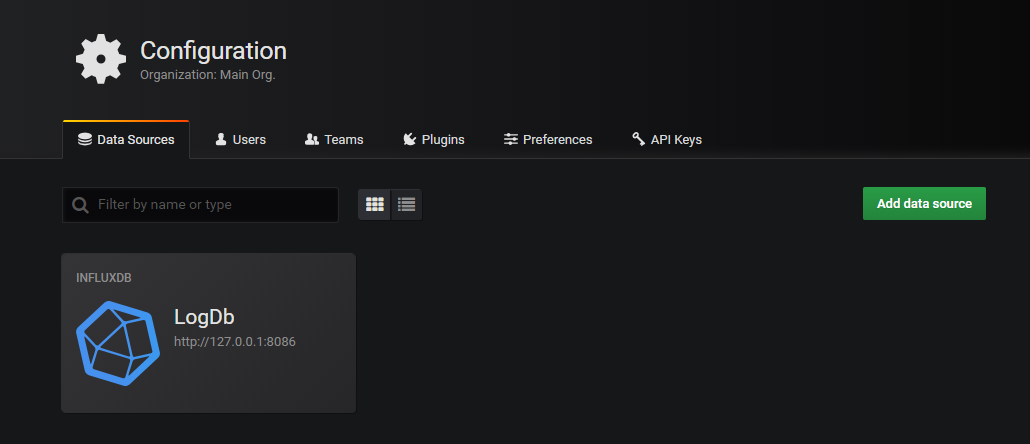
添加数据库配置文件

配置好了之后就会出现这个样子了
在.net core配置
先把这些DLL引用了吧。项目右键编辑帖进去 重新生成一下就可以了。
    <PackageReference Include="App.Metrics" Version="2.1.0" />

    <PackageReference Include="App.Metrics.AspNetCore.Endpoints" Version="2.0.0" />

    <PackageReference Include="App.Metrics.AspNetCore.Reporting" Version="2.0.0" />

    <PackageReference Include="App.Metrics.AspNetCore.Tracking" Version="2.0.0" />

    <PackageReference Include="App.Metrics.Extensions.Reporting.InfluxDB" Version="1.2.0" />

    <PackageReference Include="App.Metrics.Formatters.Json" Version="2.1.0" />

    <PackageReference Include="App.Metrics.Reporting.InfluxDB" Version="2.0.0" />
修改appsettings.json配置文件
{

  "Logging": {

    "IncludeScopes": false,

    "LogLevel": {

      "Default": "Warning"

    }

  },

  "InfluxDB": {

    "IsOpen": true,

    "DataBaseName": "LogDb",

    "ConnectionString": "http://127.0.0.1:8086",

    "username": "admin",

    "password": "xxxxxxxxxx",

    "app": "LogDbDemo",

    "env": "stage"

  }

}
修改startup进行管道接管
ConfigureServices添加 如下
            #region Metrics监控配置

            string IsOpen = Configuration.GetSection("InfluxDB")["IsOpen"].ToLower();

            if (IsOpen == "true")

            {

                string database = Configuration.GetSection("InfluxDB")["DataBaseName"];

                string InfluxDBConStr = Configuration.GetSection("InfluxDB")["ConnectionString"];

                string app = Configuration.GetSection("InfluxDB")["app"];

                string env = Configuration.GetSection("InfluxDB")["env"];

                string username = Configuration.GetSection("InfluxDB")["username"];

                string password = Configuration.GetSection("InfluxDB")["password"];

                var uri = new Uri(InfluxDBConStr);

                var metrics = AppMetrics.CreateDefaultBuilder()

                .Configuration.Configure(

                options =>

                {

                    options.AddAppTag(app);

                    options.AddEnvTag(env);

                })

                .Report.ToInfluxDb(

                options =>

                {

                    options.InfluxDb.BaseUri = uri;

                    options.InfluxDb.Database = database;

                    options.InfluxDb.UserName = username;

                    options.InfluxDb.Password = password;

                    options.HttpPolicy.BackoffPeriod = TimeSpan.FromSeconds(30);

                    options.HttpPolicy.FailuresBeforeBackoff = 5;

                    options.HttpPolicy.Timeout = TimeSpan.FromSeconds(10);

                    options.FlushInterval = TimeSpan.FromSeconds(5);

                })

                .Build();

                services.AddMetrics(metrics);

                services.AddMetricsReportScheduler();

                services.AddMetricsTrackingMiddleware();

                services.AddMetricsEndpoints();

            }

            #endregion
Configure添加这些东西
      #region 注入Metrics

            string IsOpen = Configuration.GetSection("InfluxDB")["IsOpen"].ToLower();

            if (IsOpen == "true")

            {

                app.UseMetricsAllMiddleware();

                // Or to cherry-pick the tracking of interest

                app.UseMetricsActiveRequestMiddleware();

                app.UseMetricsErrorTrackingMiddleware();

                app.UseMetricsPostAndPutSizeTrackingMiddleware();

                app.UseMetricsRequestTrackingMiddleware();

                app.UseMetricsOAuth2TrackingMiddleware();

                app.UseMetricsApdexTrackingMiddleware();

                app.UseMetricsAllEndpoints();

                // Or to cherry-pick endpoint of interest

                app.UseMetricsEndpoint();

                app.UseMetricsTextEndpoint();

                app.UseEnvInfoEndpoint();

            }

            #endregion
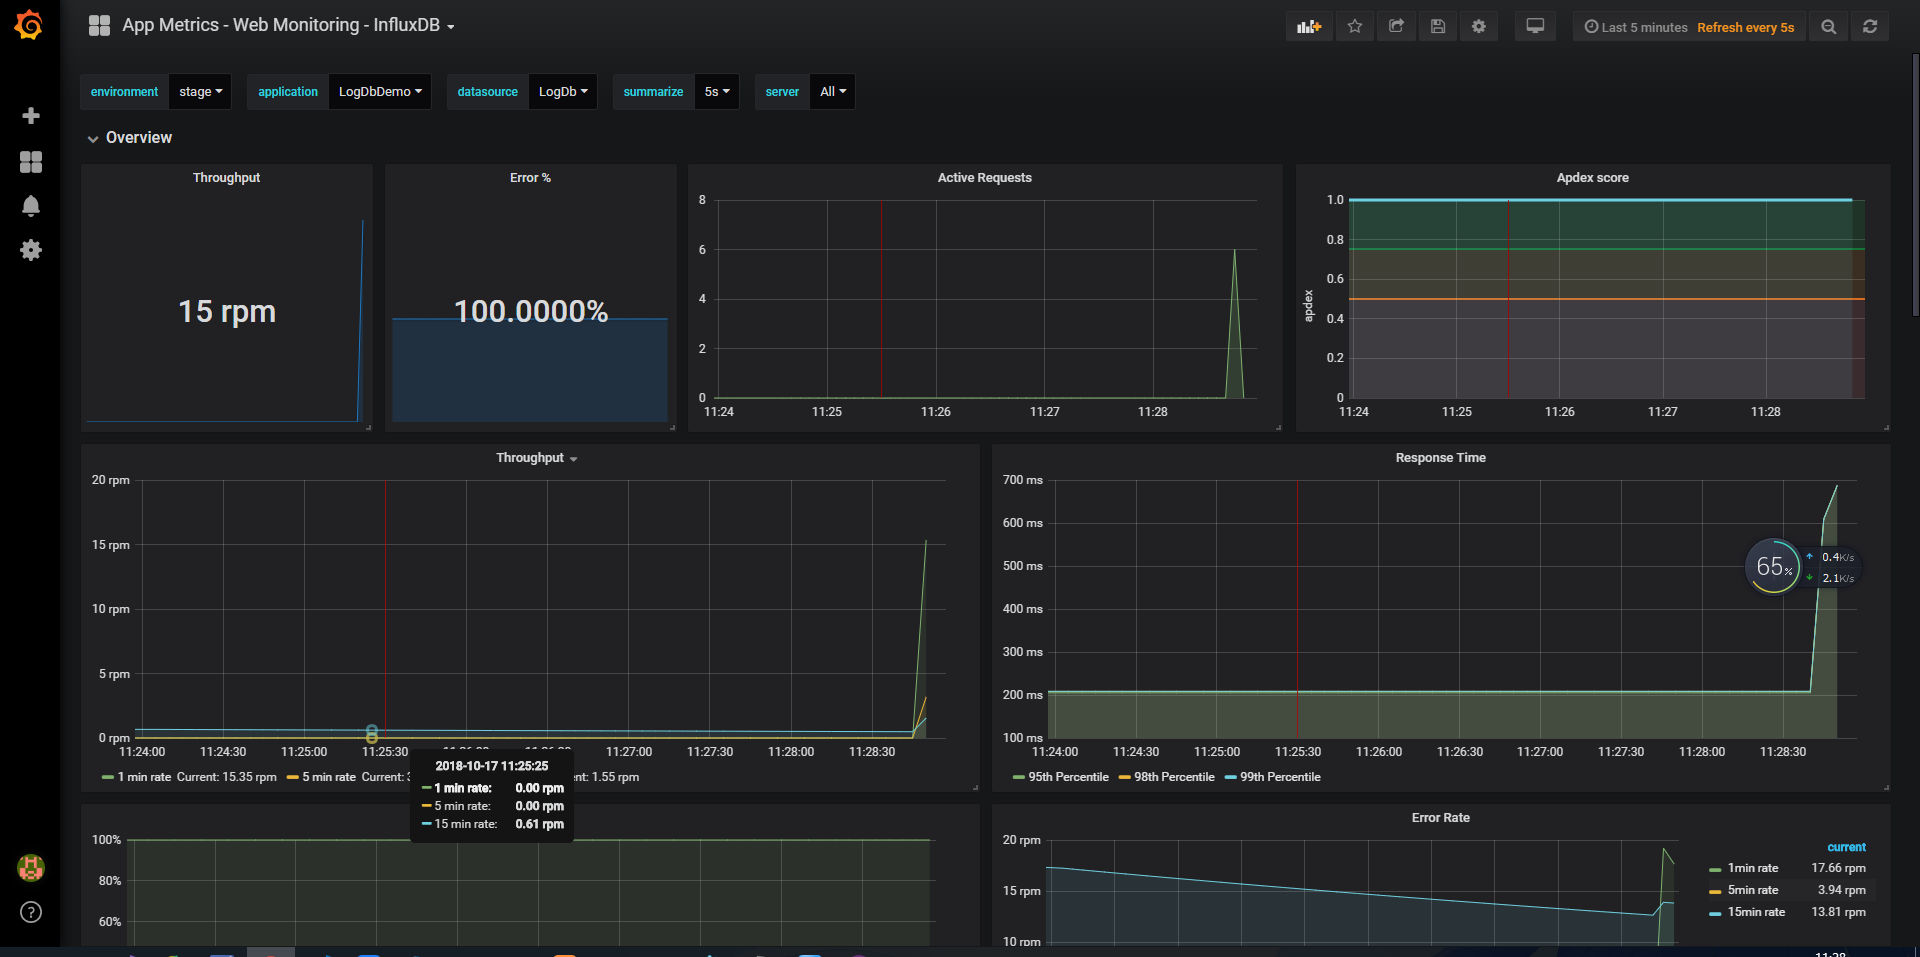
运行项目跑一圈之后 返回Grafana就出现了这样的图例
.Net Core 2.*+ InfluxDB+Grafana+App Metrics实时性能监控的更多相关文章
- 使用App Metrics实现性能监控
App Metrics监控需要安装InfluxDB时序数据库和Grafana可视化分析工具 1.安装InfluxDB 下载地址:https://portal.influxdata.com/downlo ...
- .Net Core 2.0+ InfluxDB+Grafana+App Metrics 实现跨平台的实时性能监控
最近这段时间一直在忙,没时间写博客,负责了一个项目,从前端到后端一直忙,同时还有其他第几个项目的系统架构要处理. 去年就开始关注net core了,只是平时写写demo,没用在项目中,正好这次机会就用 ...
- 基于 Njmon + InfluxDB + Grafana 实现性能指标实时可视监控
引言 最近逛 nmon 官网时,发现了一个新工具 njmon,功能与 nmon 类似,但输出为 JSON 格式,可以用于服务器性能统计. 可以使用 njmon 来向 InfluxDB 存储服务器性能统 ...
- 【jmeter】基于InfluxDB&Grafana的JMeter实时性能测试数据的监控和展示
本文主要讲述如何利用JMeter监听器Backend Listener,配合使用InfluxDB+Grafana展示实时性能测试数据 关于JMeter实时测试数据 JMeter从2.11版本开始,命令 ...
- jmeter --- 基于InfluxDB&Grafana的JMeter实时性能测试数据的监控和展示
转自:https://blog.csdn.net/RickyOne_RR/article/details/50637839 本文主要讲述如何利用JMeter监听器Backend Listener,配合 ...
- 转:基于InfluxDB&Grafana的JMeter实时性能测试数据的监控和展示
本文主要讲述如何利用JMeter监听器Backend Listener,配合使用InfluxDB+Grafana展示实时性能测试数据 关于JMeter实时测试数据 JMeter从2.11版本开始,命令 ...
- .NetCore使用skywalking实现实时性能监控
一.简介 很久之前写了一篇 <.Net Core 2.0+ InfluxDB+Grafana+App Metrics 实现跨平台的实时性能监控>关于NetCore性能监控的文章,使用Inf ...
- [#] - .Net平台的实时性能监控
App Metricshttps://www.app-metrics.io ASP.NET Core之跨平台的实时性能监控http://www.cnblogs.com/GuZhenYin/p/7170 ...
- 搭建jmeter+influxdb+grafana压测实时监控平台(超详细,小白适用)
1.前言 在使用jmeter做性能测试的时候,监控系统性能的时候,无论是使用插件还是报告生成,都没法实现实时监控.使用JMeter+Influxdb+Grafana可以实现实时监控. 本次环境搭建各软 ...
随机推荐
- LVM卷管理
一.LVM是做什么的 LVM ( Logical Volume Manager ,逻辑卷管理器)LVM 是建立在磁盘和分区之上的一个逻辑层,用来提高磁盘分区管理的灵活性.LVM 可以对磁盘分区按照组的 ...
- sentinel.conf 配置
daemonize yes logfile "/home/data/redis/redis_sentinel.log" sentinel monitor mymaster 192. ...
- Idea中Module is not specified解决办法
打开idea,想跑一个类,但是,给我报了一个红叉: 当我点击run的时候,弹出来一个框: “Error:Module not specified” Module 未指定 “这个原因是项目文件夹有修改 ...
- MyBatis日期用法技巧
当你想在实体类中使用Java.util.Date类型,而且还想在数据库中保存时分秒时,你可以在xml中修改为: #{xxdate,jdbcType=TIMESTAMP} 就是将#{}中的jdbcTyp ...
- Java8-Stream-No.04
import java.util.OptionalInt; import java.util.stream.IntStream; public class Streams4 { public stat ...
- Python程序设计《集美大学各省成绩分析》
分析文件‘集美大学各省录取分数.xlsx’,完成以下功能: 1)集美大学2015-2018年间不同省份在本一批的平均分数,柱状图展示排名前10的省份, 2)分析福建省这3年各批次成绩情况,使用折线图展 ...
- Codeforces Round #346 (Div. 2) A题 [一道让我生气的思维题·]
A. Round House Vasya lives in a round building, whose entrances are numbered sequentially by integer ...
- hover([over,]out)
hover([over,]out) 概述 一个模仿悬停事件(鼠标移动到一个对象上面及移出这个对象)的方法.这是一个自定义的方法,它为频繁使用的任务提供了一种“保持在其中”的状态. 当鼠标移动到一个匹配 ...
- c++ const修饰词
常变量: const 类型说明符 变量名 // const int i = 20;常变量定义必需初始化赋值且变量值不可更改 常引用: const 类型说明符 &引用名 //引用:指 ...
- ssh登陆强制使用密码验证登陆
Linux系统使用ssh进行登陆,可以采用密码登陆和秘钥登陆.采用密码登陆每次需要输入密码进行验证,验证通过则可登陆到环境. 秘钥登陆为在服务器的客户端生成相应的公钥和私钥,公钥用于加密,私钥用于解密 ...