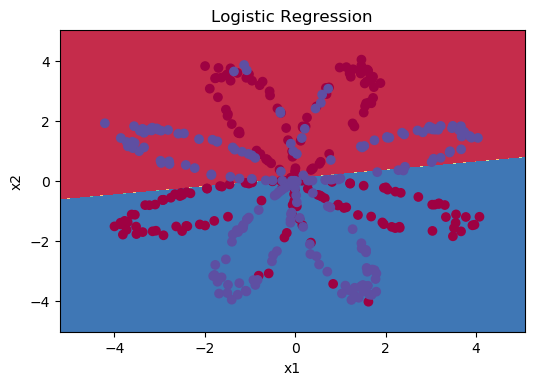
如何用matplotlib绘制决策边界
import matplotlib.pyplot as plt

import numpy as np

import sklearn

import sklearn.datasets

import sklearn.linear_model

def plot_decision_boundary(model, X, y):

    # Set min and max values and give it some padding

    x_min, x_max = X[0, :].min() - 1, X[0, :].max() + 1

    y_min, y_max = X[1, :].min() - 1, X[1, :].max() + 1

    h = 0.01

    # Generate a grid of points with distance h between them

    xx, yy = np.meshgrid(np.arange(x_min, x_max, h), np.arange(y_min, y_max, h))

    # Predict the function value for the whole grid

    Z = model(np.c_[xx.ravel(), yy.ravel()])

    Z = Z.reshape(xx.shape)

    # Plot the contour and training examples

    plt.contourf(xx, yy, Z, cmap=plt.cm.Spectral)

    plt.ylabel('x2')

    plt.xlabel('x1')

    plt.scatter(X[0, :], X[1, :], c=y.ravel(), cmap=plt.cm.Spectral)
# Train the logistic regression classifier

clf = sklearn.linear_model.LogisticRegressionCV();

clf.fit(X.T, Y.T);
# Plot the decision boundary for logistic regression

plot_decision_boundary(lambda x: clf.predict(x), X, Y)  # 预测X, Y对应坐标

plt.title("Logistic Regression")

# Print accuracy

LR_predictions = clf.predict(X.T)

print ('Accuracy of logistic regression: %d ' % float((np.dot(Y,LR_predictions) + np.dot(1-Y,1-LR_predictions))/float(Y.size)*100) +

       '% ' + "(percentage of correctly labelled datapoints)")

如何用matplotlib绘制决策边界的更多相关文章
- 如何用Matplotlib绘制三元函数
#!/usr/bin/env python #coding=GBK from mpl_toolkits.mplot3d import Axes3D from matplotlib import cm ...
- matplotlib绘制动画
matplotlib从1.1.0版本以后就开始支持绘制动画,具体使用可以参考官方帮助文档.下面是一个很基本的例子: """ A simple example of an ...
- NumPy使用 Matplotlib 绘制直方图
NumPy - 使用 Matplotlib 绘制直方图 NumPy 有一个numpy.histogram()函数,它是数据的频率分布的图形表示. 水平尺寸相等的矩形对应于类间隔,称为bin,变量hei ...
- python包matplotlib绘制图像
使用matplotlib绘制图像 import matplotlib.pyplot as plt from matplotlib.pyplot import MultipleLocator impor ...
- 用Matplotlib绘制二维图像
唠叨几句: 近期在做数据分析,需要对数据做可视化处理,也就是画图,一般是用Matlib来做,但Matlib安装文件太大,不太想直接用它,据说其代码运行效率也很低,在网上看到可以先用Java做数据处理, ...
- Python学习(一) —— matplotlib绘制三维轨迹图
在研究SLAM时常常需要对其输出的位姿进行复现以检测算法效果,在ubuntu系统中使用Python可以很好的完成相关的工作. 一. Ubuntu下Python的使用 在Ubuntu下使用Python有 ...
- python使用matplotlib绘制折线图教程
Matplotlib是一个Python工具箱,用于科学计算的数据可视化.借助它,Python可以绘制如Matlab和Octave多种多样的数据图形.下面这篇文章主要介绍了python使用matplot ...
- Machine Learning--week3 逻辑回归函数(分类)、决策边界、逻辑回归代价函数、多分类与(逻辑回归和线性回归的)正则化
Classification It's not a good idea to use linear regression for classification problem. We can use ...
- 使用matplotlib绘制多个图形单独显示
使用matplotlib绘制多个图形单独显示 一 代码 import numpy as np import matplotlib.pyplot as plt #创建自变量数组 x= np.linspa ...
随机推荐
- sql 数据库(表空间),用户 相关命令
随便转载,保留出处:http://www.cnblogs.com/aaron-agu/ 查看所有数据库 show databases; 创建新数据库 create datebase dbname:#登 ...
- unwrap bug
https://cn.mathworks.com/matlabcentral/newsreader/view_thread/93276
- 深度学习网络压缩模型方法总结(model compression)
两派 1. 新的卷机计算方法 这种是直接提出新的卷机计算方式,从而减少参数,达到压缩模型的效果,例如SqueezedNet,mobileNet SqueezeNet: AlexNet-level ac ...
- 学习笔记之csrf
CBV 添加 csrf 第一种: 指定方法方面添加 装饰器 @memethod_decorator(xxx) 第二种 全部添加: 注意 在类名前: @method_decorator(xxx,name ...
- .htaccess 配置
常规wordpress配置 <IfModule mod_rewrite.c> RewriteEngine On RewriteBase / RewriteRule ^index\.php$ ...
- Nginx多进程高并发、低时延、高可靠机制在缓存(redis、memcache)twemproxy代理中的应用
1. 开发背景 现有开源缓存代理中间件有twemproxy.codis等,其中twemproxy为单进程单线程模型,只支持memcache单机版和redis单机版,都不支持集群版功能. 由于twemp ...
- anaconda python no module named 'past'的解决方法
如上图所示,错误就是:No module named 'past' 解决办法不是下载‘past’包,而是下载‘future’包: 我是安装了anaconda集成环境,python的单独环境应该也是同样 ...
- SQLite 学习笔记(一)
(1)创建数据库 在命令行中切换到sqlite.exe所在的文件夹 在命令中键入sqlite3 test.db;即可创建了一个名为test.db的数据库 由于此时的数据库中没有任何表及 ...
- P4139 上帝与集合的正确用法
本题是欧拉定理的应用.我这种蒟蒻当然不知道怎么证明啦! 那么我们就不证明了,来直接看结论: ab≡⎧⎩⎨⎪⎪ab%φ(p)abab%φ(p)+φ(p)gcd(a,p)=1gcd(a,p)≠1,b< ...
- Web应用:当文件超过100KB,无法上传,有种原因你想象不到
今天下午2点多,突然发现凡是文件超过100KB的,在上传的时候都会卡住,但低于100KB的文件可以上传成功. 服务器端使用的是asp无组件上传,为什么突然出现这种问题呢? 我们知道,IIS默认上传限制 ...
