SciTech-Mathmatics-Probability+Statistics-Population-Sampling of Region of Population : Proportion + Mean + Confidence Interval
SciTech-Mathmatics-Probability+Statistics-Population-Sample: Sample Proportion vs. Sample Mean: The Difference
Sample Proportion vs. Sample Mean: The Difference
BY ZACH BOBBITTPOSTED ON MAY 5, 2021
Two terms that are often used in statistics are Sample Proportion and Sample Mean.
Here's the difference between the two terms:
Sample Proportion: The proportion of observations in a sample with a certain characteristic.
Often denoted $\large p̂ $, It is calculated as follows:
\(\large \begin{array}{lrl} \\
& p̂= & \frac{x}{n} \\
where: & & \\
& x: & \text{ The } number \text{ of } observations \text{ in the } sample, \\
& & \text{ with } a\ certain\ characteristic. \\
& n: & \text{ The } total\ number \text{ of } observations \text{ in the } sample \\
\end{array}\)Sample mean : The average value in a sample.
Often denoted $\large x $, it is calculated as follows:
\(\large \begin{array}{lrl} \\
& x= & \frac{\sum{x_i} }{n} \\
where: & & \\
& \sum: & \text{ A symbol that means } sum \\
& x_i: & \text{ The value of the } i \text{th observation in the sample } \\
& n: & \text{ The sample size } \\
\end{array}\)
When to Use Each(Proportion Vs. Mean)
The sample proportion and sample mean are used for different reasons:
Sample proportion : Used to understand the proportion of observations in a sample that have a certain characteristic.
For example, we could use the sample proportion in each of the following scenarios:- Politics : Researchers might survey 500 individuals in a certain city to understand what proportion of residents support a certain candidate in an upcoming election.
- Biology : Biologists may collect data on 100 sea turtles,
to understand what proportion of them have experienced damage from pollution. - Sports : A journalist may survey 1,000 college basketball players,
to understand what proportion of them shoot left-handed.
Sample mean : Used to understand the average value in a sample.
For example, we could use the sample mean in each of the following scenarios:- Demographics : Economists may collect data on 5,000 households in a certain city to estimate the average annual household income.
- Botany : A botanist may take measurements on 50 plants from the same species to estimate the average height of the plant in inches.
- Nutrition : A nutritionist may survey 100 people at a hospital to estimate the average number of calories that residents eat per day.
Depending on the question of interest, it might make more sense to use the sample proportion or the sample mean to answer the question.
Use Sample's Statistics to Estimate Population Parameters
Both the sample proportion and the sample mean are used to estimate population parameters.
Sample Proportion as an Estimate
We use the sample proportion to estimate a population proportion.
For example, we might be interested in understanding,
what proportion of residents in a certain city support a new law.
- Since it would be too costly and time-consuming to survey all 40,000,000 residents in the city, we instead survey 500 and calculate the proportion of residents in the sample who support the new law.
- We then use this sample proportion as our best estimate of the proportion of residents in the entire city who suppose the new law.
- However, since $\large \bm{ it's \ unlikely } $ that our sample proportion \(\large \bm{ exactly\ matches }\) the population proportion, we often use a \(\large \bm{ confidence\ interval }\) for a proportion – a range of values that we believe $\large \bm{ contains } $ the true population proportion with a certain level of confidence.
Sample Mean as an Estimate
We use the sample mean to estimate a population mean.
For example, we might be interested in understanding,
the average height of a certain species of plants.
- Since it would be too costly and time-consuming to measure the height of all 10,000 plants in a certain region, we instead measure the height of 150 plants and use the sample mean as our best estimate of the population mean.
- However, since $\large \bm{ it's \ unlikely } $ that our sample mean \(\large \bm{ exactly\ matches }\) the population mean, we often use a \(\large \bm{ confidence\ interval }\) for a mean– a range of values that we believe $\large \bm{ contains } $ the true population mean with a certain level of confidence.
Confidence Interval for a Proportion
A confidence interval for a proportion is a range of values that is likely to **contain a population proportion with a certain level of confidence.
This tutorial explains the following:
- The motivation for creating a confidence interval for a proportion.
- The formula to create a confidence interval for a proportion.
- An example of how to calculate a confidence interval for a proportion.
- How to interpret a confidence interval for a proportion.
Confidence Interval for a Proportion: Motivation
The reason to create a confidence interval for a proportion is to capture our uncertainty when estimating a population proportion.
For example, suppose we want to estimate the proportion of people in a certain county that are in favor of a certain law.
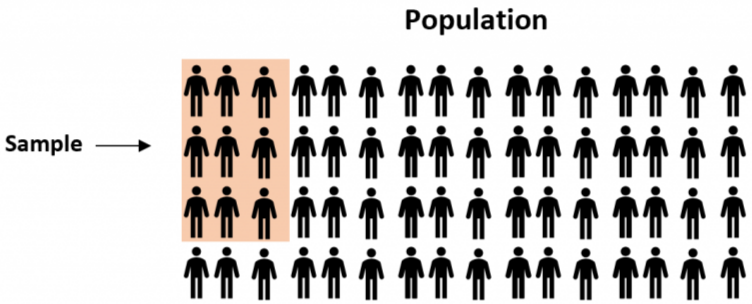
- Since there are thousands of residents in the county, it would be too costly and time-consuming to go around and ask each resident about their stance on the law. Instead, we might select a simple random sample of residents and ask each one whether or not they support the law:
![]()
Population proportion estimation example
Since we select a random sample of residents, $\large \bm{ there\ is\ no\ guarantee } $ that the proportion of residents in the sample who are in favor of the law $\large \bm{ will\ exactly\ match } $ the proportion of residents in the entire county who are in favor of the law.
So,$\large \bm{ to\ capture\ this\ uncertainty } $ we can $\large \bm{ create\ a\ confidence\ interval } $ that contains a range of values that $\large \bm{ are\ likely\ to } $ contain the true proportion of residents who are in favor of the law in the entire county.
Confidence Interval for a Proportion: Formula
We use the following formula to calculate a confidence interval for a population proportion:
$\large \bm{ Confidence\ Interval }= p +/- z* \sqrt{ \frac{p(1-p)}{n} } $
where:
\(\large p\): sample proportion
\(\large z\): the chosen z-value
\(\large n\): sample size
The z-value that you will use is dependent on the confidence level that you choose.
The following table shows the z-value that corresponds to popular confidence level choices:
| Confidence Level | z-value |
|---|---|
| 0.90 | 1.645 |
| 0.95 | 1.96 |
| 0.99 | 2.58 |
Notice that higher confidence levels correspond to larger z-values,
which leads to wider confidence intervals.
This means that, for example, a 95% confidence interval will be wider than a 90% confidence interval for the same set of data.
Related: What is Considered a Good Confidence Interval?
Confidence Interval for a Proportion: Example
Suppose we want to estimate the proportion of residents in a county that are in favor of a certain law. We select a random sample of 100 residents and ask them about their stance on the law. Here are the results:
$\large \text{ Sample size } n $ = 100
$\large \text{ Proportion in favor of law } p $ = 0.56
Here is how to find various confidence intervals for the population proportion:
Then $\large \sqrt{ \frac{0.56(1-0.56)}{100} } = 0.0496 $
| Confidence Level | z-value | Confidence Interval |
|---|---|---|
| 0.90 | 1.645 | $ [0.478, 0.642] \leftarrow 0.56 +/- 1.645*( \sqrt{ \frac{0.56(1-0.56)}{100} } ) $ |
| 0.95 | 1.96 | $ [0.463, 0.657] \leftarrow 0.56 +/- 1.96 *( \sqrt{ \frac{0.56(1-0.56)}{100} } ) $ |
| 0.99 | 2.58 | $ [0.432, 0.688] \leftarrow 0.56 +/- 2.58 *( \sqrt{ \frac{0.56(1-0.56)}{100} } ) $ |
Note: You can also find these confidence intervals by using the Confidence Interval for Proportion Calculator.
Confidence Interval for a Proportion: Interpretation
The way we would interpret a confidence interval is as follows:
There is a 95% chance that the confidence interval of [0.463, 0.657] contains the true population proportion of residents who are in favor of this certain law.
Another way of saying the same thing is that there is only a 5% chance that the true population proportion lies outside of the 95% confidence interval.
That is, there's only a 5% chance that the true proportion of residents in the county that support the law is less than 46.3% or greater than 65.7%.
Additional Resources
Confidence Interval for Proportion Calculator
Confidence Interval for Mean Calculator
SciTech-Mathmatics-Probability+Statistics-Population-Sampling of Region of Population : Proportion + Mean + Confidence Interval的更多相关文章
- [Math Review] Statistics Basic: Sampling Distribution
Inferential Statistics Generalizing from a sample to a population that involves determining how far ...
- Probability&Statistics 概率论与数理统计(1)
基本概念 样本空间: 随机试验E的所有可能结果组成的集合, 为E的样本空间, 记为S 随机事件: E的样本空间S的子集为E的随机事件, 简称事件, 由一个样本点组成的单点集, 称为基本事件 对立事件/ ...
- 加州大学伯克利分校Stat2.3x Inference 统计推断学习笔记: Section 1 Estimating unknown parameters
Stat2.3x Inference(统计推断)课程由加州大学伯克利分校(University of California, Berkeley)于2014年在edX平台讲授. PDF笔记下载(Acad ...
- mysql----Nested SELECT Quiz
Nested SELECT quiz bbc name region area population gdp Afghanistan South Asia 652225 26000000 Alb ...
- R语言:常用统计检验
统计检验是将抽样结果和抽样分布相对照而作出判断的工作.主要分5个步骤: 建立假设 求抽样分布 选择显著性水平和否定域 计算检验统计量 判定 -- 百度百科 假设检验(hypothesis test)亦 ...
- BAYESIAN STATISTICS AND CLINICAL TRIAL CONCLUSIONS: WHY THE OPTIMSE STUDY SHOULD BE CONSIDERED POSITIVE(转)
Statistical approaches to randomised controlled trial analysis The statistical approach used in the ...
- Sampling and Estimation
Sampling and Estimation Sampling Error Sampling error is the difference between a sample statistic(t ...
- [Math Review] Statistics Basic: Estimation
Two Types of Estimation One of the major applications of statistics is estimating population paramet ...
- 【转载】Recommendations with Thompson Sampling (Part II)
[原文链接:http://engineering.richrelevance.com/recommendations-thompson-sampling/.] [本文链接:http://www.cnb ...
- Study notes for Discrete Probability Distribution
The Basics of Probability Probability measures the amount of uncertainty of an event: a fact whose o ...
随机推荐
- jsp技术之“如何在jsp中判断属性为空”
一.判断对象列表为空不显示某段代码 <%-- 展开子属性 --%> <c:if test="${not empty product.variations}"> ...
- vue3 基础-全局组件和局部组件
组件和页面的关系可以理解为, 组件是页面的一部分. 形象地理解组件 就和盖房子一样的, 可以将房子粗略拆分3个组件(组成部分) 房顶, 房身, 地基. 同时房顶又可以拆分 ..... 这样在极限的情况 ...
- LangChain4j如何自定义文档转换器实现数据清洗?
LangChain4j 提供了 3 种 RAG(Retrieval-Augmented Generation,检索增强生成)实现,我们通常在原生或高级的 RAG 实现中,要对数据进行清洗,也就是将外接 ...
- AD 侦查-AS-REP 烘烤攻击
本文通过 Google 翻译 AD Recon – AS-REP Roasting Attacks 这篇文章所产生,本人仅是对机器翻译中部分表达别扭的字词进行了校正及个别注释补充. 导航 0 前言 1 ...
- React Native开发鸿蒙Next---react-native-cameraroll在ArkTS下的接入报错
.markdown-body { line-height: 1.75; font-weight: 400; font-size: 16px; overflow-x: hidden; color: rg ...
- JVM划重点:引用类型、垃圾回收算法和内存划分
一.Java四种引用类型 每种编程语言都有操作内存中元素的方式,例如在 C 和 C++ 里是通过指针,而在 Java 中则是通过"引用"(Reference).在 Java ...
- Java中如何让多线程按照自己指定的顺序执行
摘要:基于如何让多线程按照自己指定的顺序执行这个场景,浅谈Thread中join()函数的作用和原理. join的作用 之前有人问过我一个这样的面试题:如何让多线程按照自己指定的顺序执行?这个问 ...
- Kubernetes二进制文件下载链接
这里,我们下载kubernetes的二进制文件在其官网下载即可: 具体链接:https://kubernetes.io/docs/setup/release/notes/
- BAPI_CUSTOMERRETURN_CREATE 创建退货订单
READ TABLE s_head INDEX 1. IF sy-subrc = 0. ls_orders_h = s_head. *** 抬头 CLEAR: ls_header,ls_headerx ...
- [原创]《C#高级GDI+实战:从零开发一个流程图》第03章:画一个线,连接两个矩形!
一.前言 上一节我们实现了多个不同颜色的可拖动的矩形,那么这一节就来看一下如何将这些矩形连起来吧. 相信看完的你,一定会有所收获! 本文地址:https://www.cnblogs.com/lesli ...