Displaying Speed and Direction Symbology from U and V vectors (转)
This blog shows you how to calculate and symbolize wind or current speed and direction when the underlying data is stored as U and V vectors. In order to capture the speed and direction of wind or a water current, anemometers or Doppler current profilers measure the velocity of the wind or water in two perpendicular directions, U and V. U is the velocity toward east and V is the velocity toward north. U is sometimes referred to as the zonal velocity and V the meridional velocity. Using U and V, both the speed and direction of the wind or water current can be calculated.
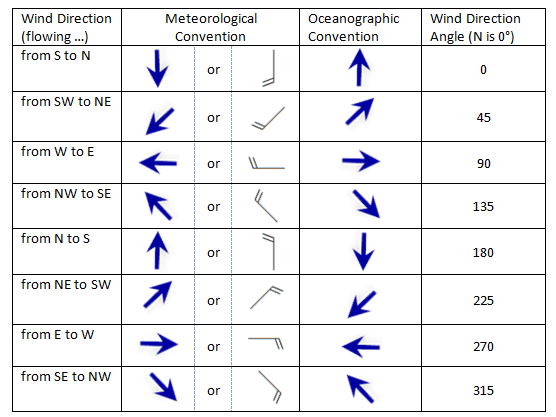
Storing information about the flow of wind or water as vectors provides flexibility in how we calculate direction. This is important because meteorologists and oceanographers describe the flow of wind differently. Oceanographers prefer to describe wind in terms of the “direction of mass flow” or in other words the direction towards which the wind is blowing. In the oceanographic convention, wind flowing from the south to the north is symbolized by an arrow pointing north. Meteorologists use an arrow or a special symbol called a wind barb to show the direction from which the wind is blowing. The head of the arrow or wind barb points in the direction from which the wind is blowing. In the meteorological convention, a wind blowing from west to east is symbolized by an arrow pointing west. Water currents are almost always symbolized using the oceanographic convention.
Displaying Direction
To correctly display wind or current direction in ArcMap, the U and V components must be converted to a symbol rotation angle. The steps below assume that you have a point feature class with the attribute fields u and v. To calculate the rotation, follow the steps below:
- Right-click the point layer in the table of contents.
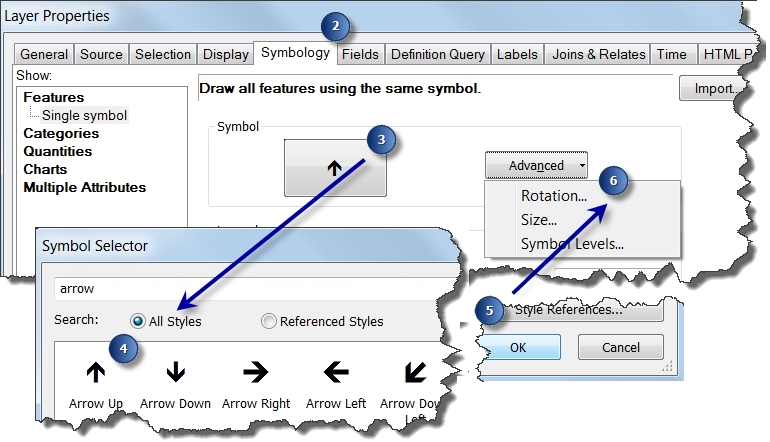
- Click Properties and click the Symbology tab.
- Click the Symbol. The Symbol Selector dialog box opens.
- Choose an arrow or wind barb whose head is pointing north.
- Click OK to close the Symbol Selector dialog.
- Click Advanced and choose Rotation from the drop-down list. The Rotation dialog box opens.
- Choose <expression> in the drop-down list.
- Click the Expression Builder button to provide the expression to use for rotating the symbol.
- Specify one of the following expression:
- Oceanographic Convention: (180/3.14) * Atn2([u],[v])
- Meteorological Convention: (180/3.14) * Atn2([u],[v])+180
Note: The formulas above are correct only if U and V are measured relative to a grid where true north consistently points straight up (e.g. no rotation). Otherwise, a convergence angle correction must be applied based on the projection of the data.
- Click OK to close the Expression Builder dialog.
- Click Geographic for the Rotation Style.
- Click OK on all dialog boxes.
This image shows the Symbology tab and Symbol Selector with the steps marked to apply symbol rotation.
This image shows the Expression Builder dialog with the steps marked to apply symbol rotation.

Displaying Speed
Using a similar procedure, U and V components can be used to calculate and display wind or current speed in ArcMap.
- Right-click the point layer in the table of contents.
- Click Properties and click the Symbology tab.
- Click Advanced and choose Size from the drop-down list. The Size dialog box opens.
- Choose <expression> in the drop-down list.
- Click the Expression Builder button to provide the expression to use for the size of the symbols.
- Specify the following for the expression: Sqr([u]**2 + [v]**2)Tip: ArcMap assumes that the size of the symbol returned from the expression is in points (1/72 of an inch). If the wind or current speeds are relatively low in your data, the symbols may be too small and cartographically unpleasing. You can adjust the size of the symbols by including a scaling factor in the formula. For example, Sqr([u]**2 + [v]**2) * 10 will increase the size of the symbols by a factor of 10.
- Click OK to close the Expression Builder dialog.
- Click OK on all dialog boxes.
from : https://blogs.esri.com/esri/arcgis/2013/07/17/displaying-speed-and-direction-symbology-from-u-and-v-vectors/
Displaying Speed and Direction Symbology from U and V vectors (转)的更多相关文章
- Unity Glossary
https://docs.unity3d.com/2018.4/Documentation/Manual/Glossary.html 2D terms 2D Physics terms AI term ...
- 《Note --- Unreal 4 --- PersonaHowToMovement》
https://docs.unrealengine.com/latest/CHN/Gameplay/HowTo/CharacterMovement/index.html 这里的demo是按照一些per ...
- jquery-leonaScroll-1.3-自定义竖向自适应滚动条插件
下载链接地址:https://share.weiyun.com/9ac3ca3fb29648bb1aad1b83a76b123c (密码:4y9t)[含mini版] 欢迎使用leonaScroll-1 ...
- jquery-leonaScroll-1.2-自定义滚动条插件
leonaScroll-1.2.js 下载链接地址:http://share.weiyun.com/bb531dd6b1916c0023c176897182dc15 (密码:iZck)[内含压缩版] ...
- Unity3D 第一人称控制器 C#脚本
CharacterMotor.cs using UnityEngine; using System.Collections; /** * @Author : www.xuanyusong.com */ ...
- 利用Native Client OLEDB 11 高效率地对SQL SERVER 进行查询和插入操作
前言: 鄙司原始用的都是ADO来访问数据库,而我现在着手的项目是从我的GPS历史数据库中,取出历时数据的一个接口,一个DLL.用ADO写完之后,测试下来,平均4000条的数据,需要 180 毫秒左右. ...
- 弄个知乎的粒子动态背景_实践particles.js
好久没登录知乎,发现他们的登录页面粒子动态效果蛮炫的,查一下代码用了Particles.js基于Canvas画布创建粒子颗粒效果. 上图 上图: 感觉有比格,就照着弄了一个,玩玩. githu ...
- HDOJ 4717 The Moving Points
The Moving Points Time Limit: 6000/3000 MS (Java/Others) Memory Limit: 32768/32768 K (Java/Others ...
- GLSL语言基础
from http://www.kankanews.com/ICkengine/archives/120870.shtml 变量 GLSL的变量命名方式与C语言类似.变量的名称可以使用字母,数字以及下 ...
随机推荐
- nginx虚拟主机的配置
nginx虚拟主机的配置 server { listen ; server_name 127.0.0.1; access_log off; root /var/www/html/; location ...
- 如何在已经安装好的Nginx上增加新模块
学习资源: https://blog.csdn.net/dxm2025/article/details/41149865 https://blog.csdn.net/qq_36663951/artic ...
- 在ERP软件行业项目应该怎么做?
本人进入软件行业已经有5个年头了,主导实施和参与过的大大小小的项目有20余个.其中有些项目做的非常好,提升了客户企业的管理水平,也规范了企业的业务操作水平,优化了企业的流程,客户非常认同我们实施的价值 ...
- 微服务监控之二:Metrics+influxdb+grafana构建监控平台
系统开发到一定的阶段,线上的机器越来越多,就需要一些监控了,除了服务器的监控,业务方面也需要一些监控服务.Metrics作为一款监控指标的度量类库,提供了许多工具帮助开发者来完成自定义的监控工作. 使 ...
- AngularJS:教程
ylbtech-AngularJS:教程 1.返回顶部 1. AngularJS 教程 AngularJS 通过新的属性和表达式扩展了 HTML. AngularJS 可以构建一个单一页面应用程序(S ...
- python下载指定页面的所有图片
实现步骤: 1.下载页面源码 2.对页面进行解析,获取页面中所有的图片路径 3.下载图片到指定路径 代码实例: # coding: utf-8 import urllib2 # 该模块用于打开页面地址 ...
- kali 软件源 包含virtualbox所需头文件
# deb cdrom:[Debian GNU/Linux 7.0 _Kali_ - Official Snapshot i386 LIVE/INSTALL Binary 20130905-08:50 ...
- 25 mysql怎么保证高可用
上一篇介绍了binlog的基本内容,在主备关系中,是每个备库接收主库的binlog并执行. 正常情况下,只要主库执行更新生成的所有的binlog,都可以传到备库并被正确执行,备库就能跟主库一致的状态, ...
- git学习2 - 安装
msysgit是Windows版的Git,从https://git-for-windows.github.io下载(网速慢的同学请移步国内镜像),然后按默认选项安装即可. 安装完成后,在开始菜单里找到 ...
- python学习(十六) 测试
测试驱动开发. 16.1 先测试,后编码 16.1.1 精确的需求说明 16.1.2 为改变而计划 16.1.3 测试的4个步骤 16.2 测试工具 16.2.1 doctest 16.2.2 uni ...