
.Net Excel 导出图表Demo(柱状图,多标签页)
1 使用插件名称Epplus,多个Sheet页数据应用,Demo为柱状图(Epplus支持多种图表)
2 Epplus 的安装和引用
新建一个工程文件或控制台应用程序 打开 Vs2017 Tools 的Nuget 包管理器,使用命令 install-package Epplus

3 开始在创建的工程中编写代码,实现功能

4 具体实现流程代码如下:
 using OfficeOpenXml;

 using OfficeOpenXml.Drawing;

 using OfficeOpenXml.Drawing.Chart;

 using OfficeOpenXml.Style;

 using System;

 using System.Collections.Generic;

 using System.Drawing;

 using System.IO;

 using System.Linq;

 using System.Text;

 using System.Threading.Tasks;

 namespace EpplusTest

 {

     public class Program

     {

         static void Main(string[] args)

         {

             FileInfo newFile = new FileInfo(@"d:\test.xlsx");

             if (newFile.Exists)

             {

                 newFile.Delete();

                 newFile = new FileInfo(@"d:\test.xlsx");

             }

             using (ExcelPackage package = new ExcelPackage(newFile))

             {

                 #region  创建多个Sheet页

                 for (int i = ; i < ; i++)

                 {

                     package.Workbook.Worksheets.Add("Demo" + i);

                 }

                 ExcelWorksheet worksheet = package.Workbook.Worksheets["Demo0"];

                 ExcelWorksheet worksheet1 = package.Workbook.Worksheets["Demo1"];

                 #endregion

                 #region 1 模拟填充数据

                 worksheet1.Cells[, ].Value = "名称";

                 worksheet1.Cells[, ].Value = "价格";

                 worksheet1.Cells[, ].Value = "销量";

                 worksheet1.Cells[, ].Value = "苹果";

                 worksheet1.Cells[, ].Value = ;

                 worksheet1.Cells[, ].Value = ;

                 worksheet1.Cells[, ].Value = "华为";

                 worksheet1.Cells[, ].Value = ;

                 worksheet1.Cells[, ].Value = ;

                 worksheet1.Cells[, ].Value = "小米";

                 worksheet1.Cells[, ].Value = ;

                 worksheet1.Cells[, ].Value = ;

                 worksheet1.Cells[, ].Value = "OPPO";

                 worksheet1.Cells[, ].Value = ;

                 worksheet1.Cells[, ].Value = ;

                 #endregion

                 #region 2 构造图表

                 worksheet.Cells.Style.WrapText = true;

                 worksheet.View.ShowGridLines = false;//去掉sheet的网格线

                 using (ExcelRange range = worksheet.Cells[, , , ])

                 {

                     range.Style.HorizontalAlignment = ExcelHorizontalAlignment.Center;

                     range.Style.VerticalAlignment = ExcelVerticalAlignment.Center;

                 }

                 using (ExcelRange range = worksheet.Cells[, , , ])

                 {

                     range.Style.Font.Bold = true;

                     range.Style.Font.Color.SetColor(Color.White);

                     range.Style.Font.Name = "微软雅黑";

                     range.Style.Font.Size = ;

                     range.Style.Fill.PatternType = ExcelFillStyle.Solid;

                     range.Style.Fill.BackgroundColor.SetColor(Color.FromArgb(, , ));

                 }

                 worksheet1.Cells[, ].Style.Border.BorderAround(ExcelBorderStyle.Thin, Color.FromArgb(, , ));

                 worksheet1.Cells[, ].Style.Border.BorderAround(ExcelBorderStyle.Thin, Color.FromArgb(, , ));

                 worksheet1.Cells[, ].Style.Border.BorderAround(ExcelBorderStyle.Thin, Color.FromArgb(, , ));

                 worksheet1.Cells[, ].Style.Border.BorderAround(ExcelBorderStyle.Thin, Color.FromArgb(, , ));

                 worksheet1.Cells[, ].Style.Border.BorderAround(ExcelBorderStyle.Thin, Color.FromArgb(, , ));

                 worksheet1.Cells[, ].Style.Border.BorderAround(ExcelBorderStyle.Thin, Color.FromArgb(, , ));

                 worksheet1.Cells[, ].Style.Border.BorderAround(ExcelBorderStyle.Thin, Color.FromArgb(, , ));

                 worksheet1.Cells[, ].Style.Border.BorderAround(ExcelBorderStyle.Thin, Color.FromArgb(, , ));

                 worksheet1.Cells[, ].Style.Border.BorderAround(ExcelBorderStyle.Thin, Color.FromArgb(, , ));

                 worksheet1.Cells[, ].Style.Border.BorderAround(ExcelBorderStyle.Thin, Color.FromArgb(, , ));

                 worksheet1.Cells[, ].Style.Border.BorderAround(ExcelBorderStyle.Thin, Color.FromArgb(, , ));

                 worksheet1.Cells[, ].Style.Border.BorderAround(ExcelBorderStyle.Thin, Color.FromArgb(, , ));

                 worksheet1.Cells[, ].Style.Border.BorderAround(ExcelBorderStyle.Thin, Color.FromArgb(, , ));

                 worksheet1.Cells[, ].Style.Border.BorderAround(ExcelBorderStyle.Thin, Color.FromArgb(, , ));

                 worksheet1.Cells[, ].Style.Border.BorderAround(ExcelBorderStyle.Thin, Color.FromArgb(, , ));

                 ExcelChart chart = worksheet.Drawings.AddChart("chart", eChartType.ColumnClustered);

                 ExcelChartSerie serie = chart.Series.Add(worksheet1.Cells[, , , ], worksheet1.Cells[, , , ]);//引用worksheet1的数据填充图表的X轴和Y轴

                 serie.HeaderAddress = worksheet1.Cells[, ];

                 #endregion

                 #region 3 设置图表的样式

                 chart.SetPosition(, );

                 chart.SetSize(, );

                 chart.Title.Text = "销量走势";

                 chart.Title.Font.Color = Color.FromArgb(, , );

                 chart.Title.Font.Size = ;

                 chart.Title.Font.Bold = true;

                 chart.Style = eChartStyle.Style15;

                 chart.Legend.Border.LineStyle = eLineStyle.SystemDash;

                 chart.Legend.Border.Fill.Color = Color.FromArgb(, , );

                 #endregion

                 package.Save();

             }

         }

     }

 }
5 效果展示:
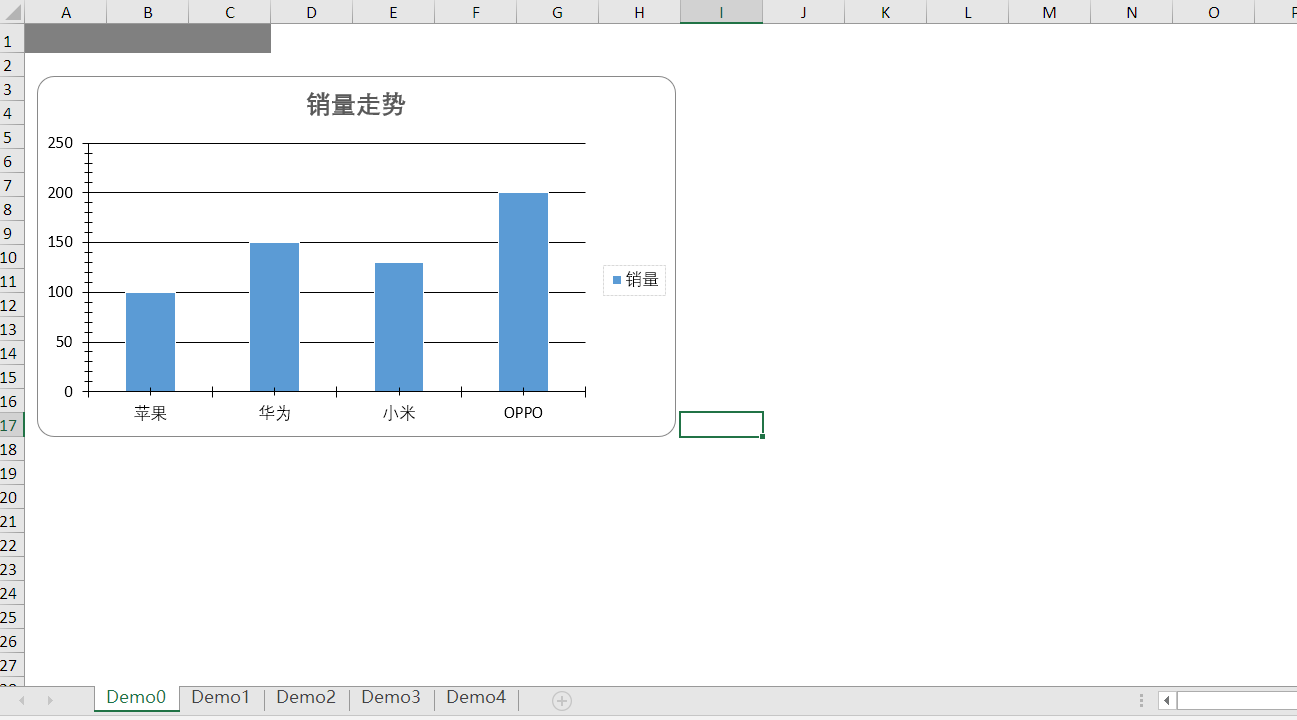
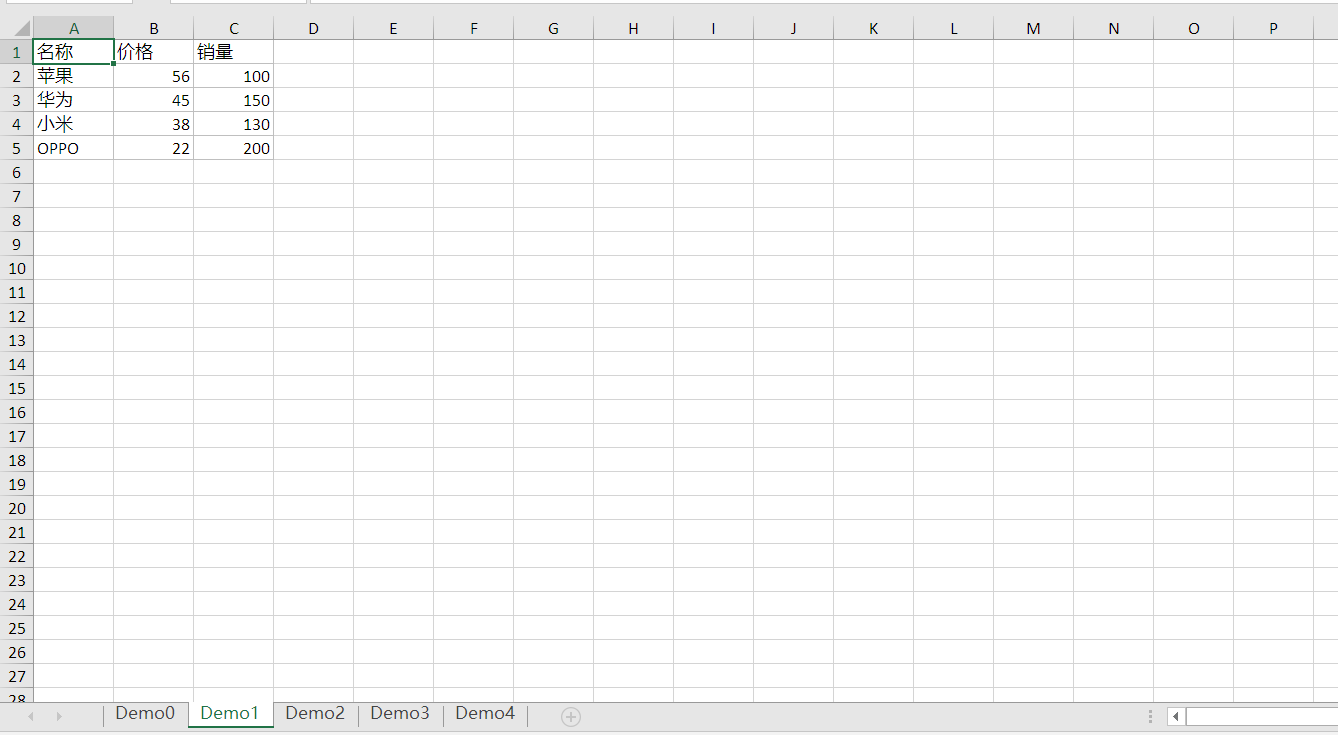
6 Demo源码GitHub下载地址:https://github.com/HJ520134/.NetDemo.git
.Net Excel 导出图表Demo(柱状图,多标签页)的更多相关文章
- .Net Excel 导出图表Demo(柱状图,多标签页) .net工具类 分享一个简单的随机分红包的实现方式
.Net Excel 导出图表Demo(柱状图,多标签页) 1 使用插件名称Epplus,多个Sheet页数据应用,Demo为柱状图(Epplus支持多种图表) 2 Epplus 的安装和引用 新建一 ...
- 标签页QTabWidget
样式: import sys from PyQt5.QtGui import QIcon from PyQt5.QtWidgets import QApplication, QWidget, QTab ...
- 二十六、【开源框架】EFW框架Winform前端开发之Grid++Report报表、条形码、Excel导出、图表控件
回<[开源]EFW框架系列文章索引> EFW框架源代码下载V1.2:http://pan.baidu.com/s/1hcnuA EFW框架实例源代码下载:http://pan ...
- 在excel图表上添加数据标签
在excel图表上添加数据标签 觉得有用的话,欢迎一起讨论相互学习~Follow Me 参考文献 https://zhidao.baidu.com/question/47838665 方法与步骤 在E ...
- Excel催化剂图表系列之品味IBCS瀑布图观察企业利润构成
IBCS图表,每个细节都值得反复琢磨参悟,此篇给大家送上详尽的瀑布图方式下的利润数据观察.请不要拿Excel2016版提供的瀑布图与IBCS版的瀑布图作对比,那完全不是一个级别的,可以类比为拿一辆经济 ...
- Java利用Apache poi导出图表
jar compile('org.apache.poi:poi:4.0.1') compile('org.apache.poi:poi-scratchpad:4.0.1') compile('org. ...
- 基于springboot跟poi封装的最便捷的excel导出
发布时间:2018-11-15 技术:springboot1.5.6 + maven3.0.5 + jdk1.8 概述 Springboot最便捷的Excel导出,只需要一个配置文件即可搞定 ...
- js插件---在线类似excel生成图表插件解决方案
js插件---在线类似excel生成图表插件解决方案 一.总结 一句话总结:google比百度好用多了,多用google google js editable table jquery 双向绑定 这种 ...
- Excel催化剂图表系列之一键完成IBCS国际商业标准图表
在数据分析领域,最后一公里的图表输出,是一片十分广阔的领域.一直以来,笔者深知不是这一方面的能手,学习上也仅仅是浅尝而止.没有往其深入研究并有所产出.很幸运地在数据圈子能够结识到其他的志同道合的伙伴, ...
随机推荐
- node 重新安装依赖模块
rm -rf node_modules rm package-lock.json npm cache clear --force npm install
- web 10
一.Iterations : 1.do...while : 创建执行指定语句的循环,直到测试条件评估为false.在执行语句后评估条件,导致指定语句至少执行一次. 例子:在以下示例中,do...而循环 ...
- Qt5+MSVC2015环境将VS2015编写的控制台程序转化为GUI程序
如题所述,如何将VS2015编写的控制台程序转化为Qt5+MSVC2015环境编译的GUI程序? 最近想到这个操作,类似于Linux下使用的命令行操作转到Windows下使用GUI操作,看了控制台的命 ...
- java将数据库中查询到的数据导入到Excel表格
1.Maven需要的依赖 <!-- https://mvnrepository.com/artifact/org.apache.poi/poi --> <dependency> ...
- Hadoop集群搭建-full完全分布式(三)
环境:Hadoop-2.8.5 .centos7.jdk1.8 一.步骤 1).4台centos虚拟机 2). 将hadoop配置修改为完全分布式 3). 启动完全分布式集群 4). 在完全分布式集群 ...
- XLua----热更新
一.xLua 环境配置 1).Xlua中 Plugin Xlua复制到 需要热更新的工程中---->Assets子目录 2).开启宏HOTFIX_ENABLE File---->bui ...
- NeuChar 平台使用及开发教程(二):设置平台账号
在上一篇<NeuChar 平台使用及开发教程(一):开始使用 NeuChar>中我们了解了 NeuChar 的角色和大体功能框架,并进行了注册,本文将介绍如何设置多账号,以便让 NeuCh ...
- FFmpeg命令行工具学习(三):媒体文件转换工具ffmpeg
一.简述 ffmpeg是一个非常强大的工具,它可以转换任何格式的媒体文件,并且还可以用自己的AudioFilter以及VideoFilter进行处理和编辑.有了它,我们就可以对媒体文件做很多我们想做的 ...
- SpringBoot + SpringCloud学习踩坑实记
踩的坑: 1).springcloud框架中,依赖一直报错,很可能是没有添加springcloud的依赖,或者是依赖的版本号过低.并且springboot也有一个父依赖. 2.springcloud ...
- 细说javascripe事件传播流程
当我们使用js时,经常会遇到事件传播流程的问题,下面我说一下我的观点. 在js触发某个事件时会相应生成一个事件对象,而这个事件对象则会根据DOM事件流的方向进传递,而传递的顺序如下图所示: 事件对象会 ...