绘图工具graphviz学习使用
画图工具:
http://www.tuicool.com/articles/r2iAfa
http://www.tuicool.com/articles/RjQfey
绘图工具graphviz学习使用
起因
最近完成了研究生毕业设计,在写毕业论文时,老师曾经推荐使用代码来画相关的图,当时时间有些紧,所以没有这样做。最近在看rapidjson的文档,看到miloyip 文档中的图都是用dot文件的源代码编译出来的,一查,原来是graphviz的源代码。遂用了半天简单学习了下graphviz的语法和使用,感觉很不错,以后画图有了一个不错的工具。
graphviz 是一个运用广泛的命令行绘图软体,不过说是绘图软体,它能绘的图并不是一般人想像中的漫画或logo,而是数学意义上的graph,比较通俗的说法就是「关系图」。
安装
graphviz 支持 Windows、Mac OS X、FreeBSD、Solaris、Linux 等多种系统
Ubuntu或Debian下安装很简单:
sudo apt-get install graphvizMac下使用brew
brew install graphvizWindows 下参考 http://www.graphviz.org/Download_windows.php
入门使用
1. 编写以dot为后缀的源代码文件,如:
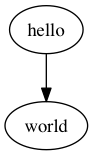
// hello.dot digraph {
    	hello -> world;
	}
2. 使用dot命令编译,如
dot hello.dot -T png -o hello.png
完整的命令为:
<cmd> <inputfile> -T <format> -o <outputfile>
其中graphviz 的<cmd> 有好几种,每种使用方法都完全相同,差别只在于渲染出来的图片效果不一样。man中的简介是这样的:
| <cmd> | 介绍 |
|---|---|
| dot | 渲染的图具有明确方向性。 |
| neato | 渲染的图缺乏方向性。 |
| twopi | 渲染的图采用放射性布局。 |
| circo | 渲染的图采用环型布局。 |
| fdp | 渲染的图缺乏方向性。 |
| sfdp | 渲染大型的图,图片缺乏方向性。 |
可以透过man <cmd> 取得进一步说明。但还是亲自用用比较容易理解。在本文中,凡没有说明的图,预设都是以dot渲染出来的。
3. 查看效果
效果如下:
语法介绍
graphviz使用dot语法来说明,其它语法可以用形式化的描述如下:
graph         = [strict] (digraph | graph) id ’{’ stmt-list ’}’
stmt-list     = [stmt [’;’] [stmt-list ] ]
stmt          = attr-stmt | node-stmt | edge-stmt | subgraph | id ’=’ id
attr-stmt     = (graph | node | edge) attr-list
attr-list     = ’[’ [a-list ] ’]’ [attr-list]
a-list        = id ’=’ id [’,’] [a-list]
node-stmt     = node-id [attr-list]
node-id       = id [port]
port          = port-location [port-angle] | port-angle [port-location]
port-location = ’:’ id|’:’ ’(’id’,’id’)’
port-angle    = ’@’ id
edge-stmt     = (node-id | subgraph) edgeRHS [attr-list]
edgeRHS       = edgeop (node-id | subgraph) [edgeRHS]
subgraph      = [subgraph id] ’{’ stmt-list ’}’ | subgraph id
graphviz 有两种图,一种是无向图graph,边用--连接,一种是有向图digraph,边用->连接,这个可以很简单的实践。
具体的图说明内容包含属性(attr)、节点(node)、边(edge)和子图(subgraph)说明。
节点属性如下 :
| Name | Default | Values |
|---|---|---|
| color | black | node shape color |
| comment | any string (format-dependent) | |
| distortion | 0.0 | node distortion for shape=polygon |
| fillcolor | lightgrey/black | node fill color |
| fixedsize | false | label text has no affect on node size |
| fontcolor | black | type face color |
| fontname | Times-Roman | font family |
| fontsize | 14 | point size of label |
| group | name of node’s group | |
| height | .5 | height in inches |
| label | node name | any string |
| layer | overlay range | all, id or id:id |
| orientation | 0.0 | node rotation angle |
| peripheries | shape-dependent | number of node boundaries |
| regular | false | force polygon to be regular |
| shape | ellipse | node shape; see Section 2.1 and Appendix E |
| shapefile | external EPSF or SVG custom shape file | |
| sides | 4 | number of sides for shape=polygon |
| skew | 0.0 | skewing of node for shape=polygon |
| style | graphics options, e.g. bold, dotted, filled; cf. Section 2.3 | |
| URL | URL associated with node (format-dependent) | |
| width | .75 | width in inches |
| z | 0.0 | z coordinate for VRML output |
边属性如下:
| Name | Default | Values |
|---|---|---|
| arrowhead | normal | style of arrowhead at head end |
| arrowsize | 1.0 | scaling factor for arrowheads |
| arrowtail | normal | style of arrowhead at tail end |
| color | black | edge stroke color |
| comment | any string (format-dependent) | |
| constraint | true | use edge to affect node ranking |
| decorate | if set, draws a line connecting labels with their edges | |
| dir | forward | forward, back, both, or none |
| fontcolor | black | type face color |
| fontname | Times-Roman | font family |
| fontsize | 14 | point size of label |
| headlabel | label placed near head of edge | |
| headport | n,ne,e,se,s,sw,w,nw | |
| headURL | URL attached to head label if output format is ismap | |
| label | edge label | |
| labelangle | -25.0 | angle in degrees which head or tail label is rotated off edge |
| labeldistance | 1.0 | scaling factor for distance of head or tail label from node |
| labelfloat | false | lessen constraints on edge label placement |
| labelfontcolor | black | type face color for head and tail labels |
| labelfontname | Times-Roman | font family for head and tail labels |
| labelfontsize | 14 | point size for head and tail labels |
| layer | overlay range | all, id or id:id |
| lhead | name of cluster to use as head of edge | |
| ltail | name of cluster to use as tail of edge | |
| minlen | 1 | minimum rank distance between head and tail |
| samehead | tag for head node; edge heads with the same tag are | |
| sametail | merged onto the same port | |
| style | tag for tail node; edge tails with the same tag are merged onto the same port | |
| taillabel | graphics options, e.g. bold, dotted, filled; cf. Section 2.3 | |
| tailport | label placed near tail of edge n,ne,e,se,s,sw,w,nw | |
| tailURL | URL attached to tail label if output format is ismap | |
| weight | 1 | integer cost of stretching an edge |
图属性如下:
| Name | Default | Values |
|---|---|---|
| bgcolor | background color for drawing, plus initial fill color | |
| center | false | center drawing on page |
| clusterrank | local | may be global or none |
| color | black | for clusters, outline color, and fill color if fillcolor not defined |
| comment | any string (format-dependent) | |
| compound | false | allow edges between clusters |
| concentrate | false | enables edge concentrators |
| fillcolor | black | cluster fill color |
| fontcolor | black | type face color |
| fontname | Times-Roman | font family |
| fontpath | list of directories to search for fonts | |
| fontsize | 14 | point size of label |
| label | any string | |
| labeljust | centered | ”l” and ”r” for left- and right-justified cluster labels, respectively |
| labelloc | top | ”t” and ”b” for top- and bottom-justified cluster labels, respectively |
| layers | id:id:id… | |
| margin | .5 | margin included in page, inches |
| mclimit | 1.0 | scale factor for mincross iterations |
| nodesep | .25 | separation between nodes, in inches. |
| nslimit | if set to f, bounds network simplex iterations by (f)(number of nodes) when setting x-coordinates | |
| nslimit1 | if set to f, bounds network simplex iterations by (f)(number of nodes) when ranking nodes | |
| ordering | if out out edge order is preserved | |
| orientation | portrait | if rotate is not used and the value is landscape, use landscape orientation |
| page | unit of pagination, e.g. “8.5,11” | |
| pagedir | BL | traversal order of pages |
| quantum | if quantum ¿ 0.0, node label dimensions will be rounded to integral multiples of quantum | |
| rank | same, min, max, source or sink | |
| rankdir | TB | LR (left to right) or TB (top to bottom) |
| ranksep | .75 | separation between ranks, in inches. |
| ratio | approximate aspect ratio desired, fill or auto | |
| remincross | if true and there are multiple clusters, re-run crossing minimization | |
| rotate | If 90, set orientation to landscape | |
| samplepoints | 8 | number of points used to represent ellipses and circles on output (cf. Appendix C |
| searchsize | 30 | maximum edges with negative cut values to check when looking for a minimum one during network simplex |
| size | maximum drawing size, in inches | |
| style | graphics options, e.g. filled for clusters | |
| URL | URL associated with graph (format-dependent) |
实例
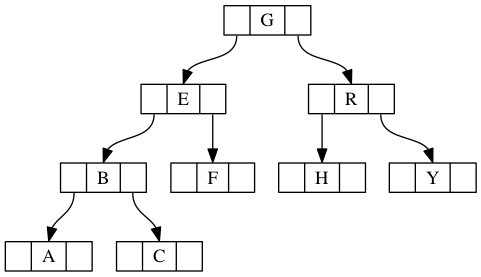
介绍了上面的语法,实际使用的时候就是学习几个详细的例子,下面是一个二叉树代码:
digraph g {
    node [shape = record,height=.1];
    node0[label = "<f0> |<f1> G|<f2> "];
    node1[label = "<f0> |<f1> E|<f2> "];
    node2[label = "<f0> |<f1> B|<f2> "];
    node3[label = "<f0> |<f1> F|<f2> "];
    node4[label = "<f0> |<f1> R|<f2> "];
    node5[label = "<f0> |<f1> H|<f2> "];
    node6[label = "<f0> |<f1> Y|<f2> "];
    node7[label = "<f0> |<f1> A|<f2> "];
    node8[label = "<f0> |<f1> C|<f2> "];
    "node0":f2 -> "node4":f1;
    "node0":f0 -> "node1":f1;
    "node1":f0 -> "node2":f1;
    "node1":f2 -> "node3":f1;
    "node2":f2 -> "node8":f1;
    "node2":f0 -> "node7":f1;
    "node4":f2 -> "node6":f1;
    "node4":f0 -> "node5":f1;
}
效果如下:
python调用
除了可以使用dot文件编写图形外,也可以使用python编写相关的代码,生成图形文件,
安装方法:
pip install pygraphviz
引用 PyGraphviz:
import pygraphviz as pgv
初始化图类:
G=pgv.AGraph()
增加结点和边:
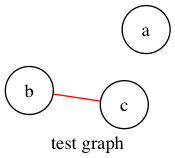
G.add_node('a') # adds node 'a'
G.add_edge('b','c') # adds edge 'b'-'c' (and also nodes 'b', 'c')
设置属性:
G.graph_attr['label']='test graphf'
G.node_attr['shape']='circle'
G.edge_attr['color']='red'
设置输出的格式:
G.layout() # default to neato
G.layout(prog='dot') # use do
输出到文件:
G.draw('file.png')  # write previously positioned graph to PNG file
G.draw('file.ps',prog='circo') # use circo to position, write PS file
效果:
参考
Powered by Jekyll with Type Theme
绘图工具graphviz学习使用的更多相关文章
- jquery 绘图工具 flot 学习笔记
今天想做一个统计图表,像163博客的流量统计一样的,借助 flot 实现了,而且很简单. flot网址:http://code.google.com/p/flot/ 下载 JS 文件,使用方法和 jq ...
- mark::开源绘图工具graphviz
http://blog.csdn.net/iamljj/article/details/5862930 http://codeforces.com/contest/601/problem/D
- Graphviz - Graph Visualization Software 开源可视化绘图工具(visio 类)
http://www.graphviz.org/Download_windows.php Welcome to Graphviz Available translations: Romanian, ...
- Opencv实现的简易绘图工具
第一次写博,还是个菜鸟.最近开始学习Opencv,试着写了个简易的绘图工具(目前只写了画线和橡皮擦部分,画其它图形还有待往里添加),也算是记录自己的学习之路. #include "stdaf ...
- 画图工具Graphviz安装配置
Graphviz (英文:Graph Visualization Software的缩写)是一个由AT&T实验室启动的开源工具包,用于绘制DOT语言脚本描述的图形.它也提供了供其它软件使用的库 ...
- HTML5 canvas 在线画笔绘图工具(一)
HTML5 canvas 在线画笔绘图工具(一) 功能介绍 这是我用Javascript写的第一个程序,在写的过程中走了很多弯路,所以写完之后想分享出来,给与我一样的初学者做为学习的参考,同时在编写这 ...
- Python使用Plotly绘图工具,绘制饼图
今天我们来学习一下如何使用Python的Plotly绘图工具,绘制饼图 使用Plotly绘制饼图的方法,我们需要使用graph_objs中的Pie函数 函数中最常用的两个属性values,用于赋值给需 ...
- Python使用Plotly绘图工具,绘制甘特图
今天来讲一下如何使用Python 的绘图工具Plotly来绘制甘特图的方法 甘特图大家应该了解熟悉,就是通过条形来显示项目的进度.时间安排等相关情况的. 我们今天来学习一下,如何使用ployly来绘制 ...
- H5新特性——--第三方绘图工具库 echarts(canvas)---SVG绘图
今天学习的内容 3.1:h5新特性---第三方绘图工具库 echarts(canvas) 百度 echarts;d3;two.js;.... 3.2:h5新特性---SVG绘图 3.2:h5新特性-- ...
随机推荐
- spring 4 泛型注入
最近对系统进行改造,发现在泛型实例初始化的时候,得不到想要的泛型.或者需要强制转换. spring 4 开始支持泛型对象初始化,初始化方法如下: 注:使用配置文件的方法暂时还没有发现,下面是使用jav ...
- /proc/uptime
在Linux中,我们常常会使用到uptime命令去看看系统的运行时间,它与一个文件有关,就是/proc/uptime.这个文件里的两个参数所代表的意义如下. [root@app ~]#cat /pro ...
- UVa 147 Dollars(硬币转换)
题目大意:给出五种硬币,价值分别为 1,5,10,25,50,.当给出一个价值时,求出能够组合的种数(每种硬币可以用无限次). 思路:完全背包, dp[i][j]表示总数 i 能够被表示的种数.状态转 ...
- nodejs学习笔记之包、模块实现
简单了解了node的安装和一些基本的常识之后,今天学习了node中很重要的包和模块的一些知识点. 首先学习一下包的规范,它由包结构和包描述两部分组成.包结构用于组织包的各种文件,包 ...
- 【shell】构造并遍历二位数组的一种用法
参考shell数组的部分操作用法,实现了构造和遍历二维数组的一种方式,具体如下: #数组元素以空格分割 sites=("www.a.com www.b.com www.c.com www.d ...
- 【实用技术】DreamWeaver常用快捷键
文件菜单 新建文档 Ctrl+N 打开一个HTML文件 Ctrl+O 或者将文件从[文件管理器]或[站点]窗口拖动到[文档]窗口中 在框架中打开 Ctrl+Shift+O 关闭 Ctrl+W 保存 C ...
- [CSS3] CSS Display Property: Block, Inline-Block, and Inline
Understanding the most common CSS display types of block, inline-block, and inline will allow you to ...
- Docker快速搭建neural style环境
## 概览 相关的代码都在Github上,请参见我的Github,https://github.com/lijingpeng/neural-style 敬请多多关注哈~~~ ## Docker镜像构建 ...
- Winform开发之窗体传值
Winform的窗体之间的数据传递是开发的必备技术,下面介绍几种典型的传值方法 1.构造函数传值,但这种方法是单向的(推荐) 上代码,先传值 private void button2_Click(ob ...
- Webfrom 生成流水号 组合查询 Repeater中单选与复选控件的使用 JS实战应用
Default.aspx 网页界面 <%@ Page Language="C#" AutoE ...