流程图 Graphviz - Graph Visualization Software
0.目录
1.参考
https://www.processon.com/ 应该值得一试
知乎 用什么软件画流程图?
说到流程图还是再次提及一下,我们之前说到的Graphviz 。
Graphviz (英文:Graph Visualization Software的缩写)是一个由AT&T实验室启动的开源工具包,用于绘制DOT语言脚本描述的图形。它也提供了供其它软件使用的库。
它的主要特点是代码生成图像,并且足够的简单。
2.Graphviz
(1)下载安装
http://graphviz.org/Download.php最下方 agree
Windows
Stable and development Windows Install packages
(2)添加环境变量
path添加: D:\Program Files (x86)\Graphviz2.38\bin
新开cmd:dot -?
(3)中文支持
只要你用 UTF-8 的編碼來儲存描述關係圖的 dot 檔,Graphviz 也可以產生包含中文的關係圖。但 Windows 版的 Graphviz 似乎沒有設定好 fontconfig,因此會找不到中文字型,只要設定好 fontconfig 即可解決。依照預設安裝路徑,設定檔在 C:\Program Files\Graphviz 2.21\etc\fonts\fonts.conf,找到以下這行:

    <dir>#FONTDIR#</dir>

改成 Windows 字型檔的路徑:

    <dir>C:\WINDOWS\Fonts</dir>

Graphviz 就可以使用中文了!但注意目前似乎只能輸入英文的字型名稱,範例如下:

digraph g {

    node[fontname = "PMingLiu"];

    "中文" -> "英文";

}
(4) 可以运行gvedit.exe写入代码,f5直接预览效果
(5) python库,其实用处不大
https://pypi.python.org/pypi/graphviz
3.参考文档
官网: http://graphviz.org/Documentation.php
一次性批量定义属性
    node [color=Red,fontname=Courier,shape=box] //All nodes will this shape and colour

    edge [color=Blue, style=dashed] //All the lines look like this
标 题: 【合集】dot language Graphviz流程图的问题
(连线连在角上)
portPos headport tailport 这几个属性
digraph login3times{

    edge[fontname="Microsoft YaHei"]

    node[shape=box, fontname="Microsoft YaHei" size="20,20"]

    fontname="Microsoft YaHei"

    label="三次登录流程图"
4.语法注意事项
(1)框图为node,默认形状 ellipse 椭圆形, shape = box 长方形,diamond 菱形,circle 圆形
(2)连线为edge,箭头方向 [dir=forward, back, both, or none]
(3)在有必要的时候加双引号,如:“do sth”, "func()"
(4)注释为 //, 或 /* */
(5)不方便之处:
A -> B -> C ->D[label=to] ,则会在三条连线上都添加 to 字样
对比:
A -> B
B -> C[label=to]
C ->D
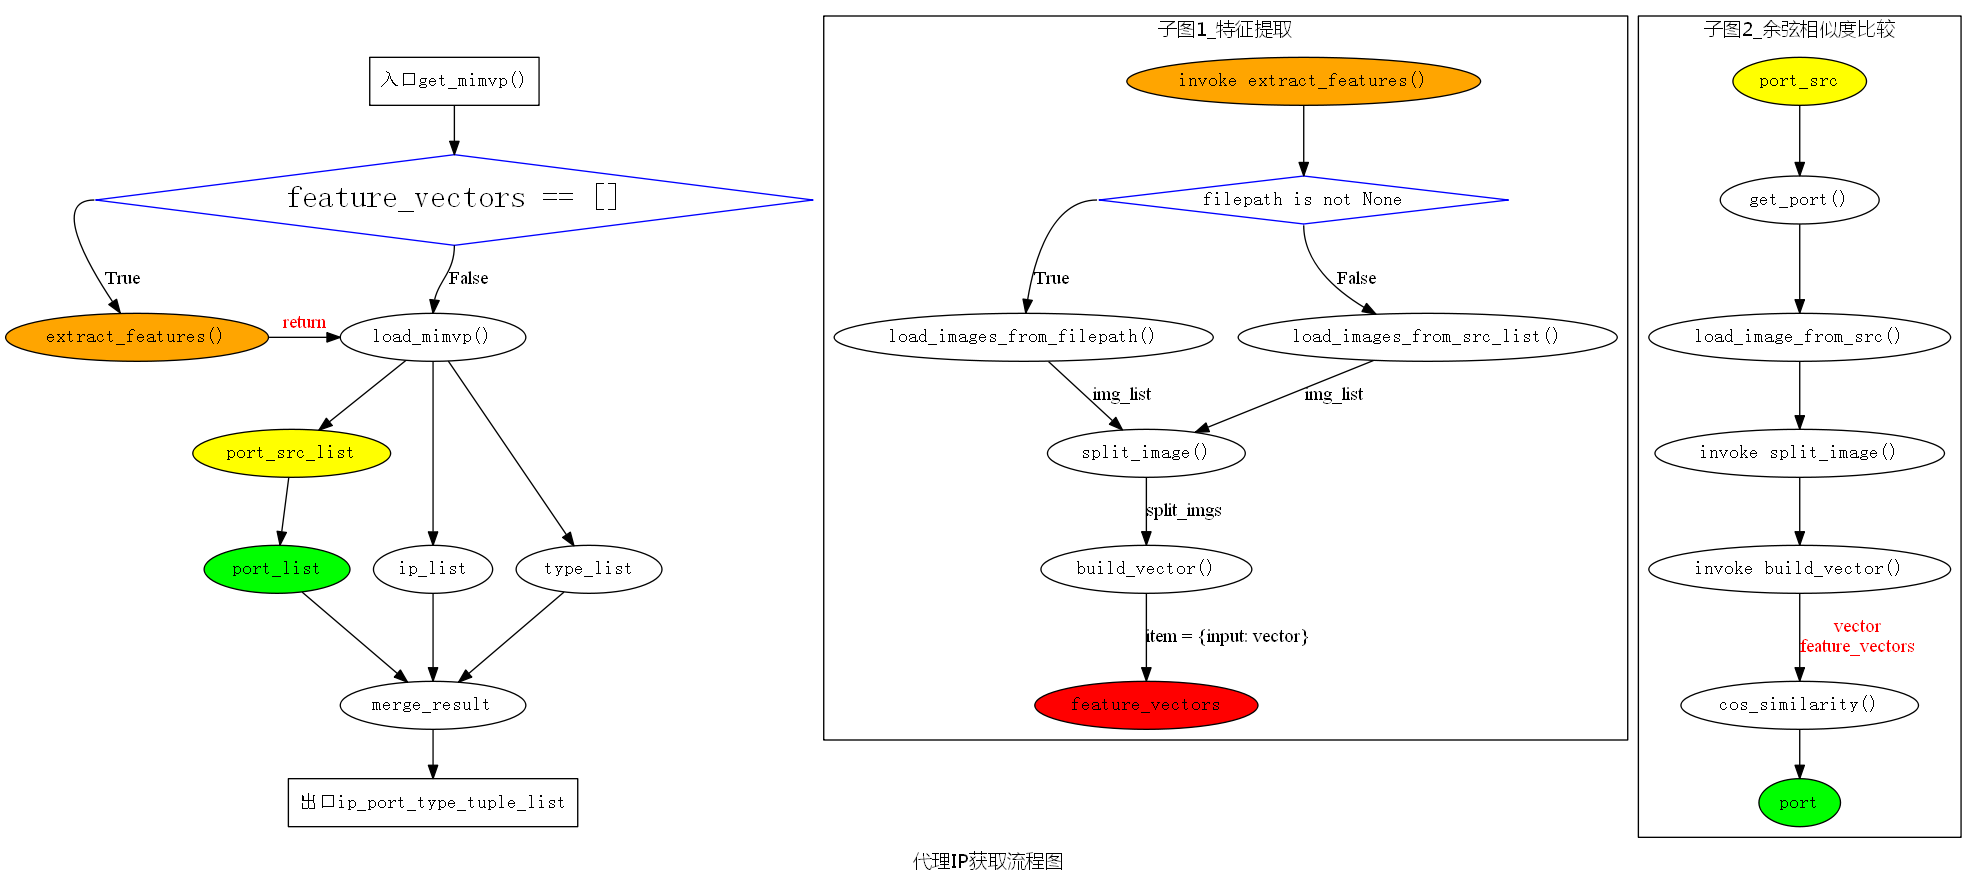
5.综合应用
//G:\pydata\pycode>dot eg.dot -Tpng -o eg.png

digraph graphname

{

//rankdir=LR

node[fontname = "simsun"]

fontname="Microsoft YaHei"

label="代理IP获取流程图"

START[label="入口get_mimvp()" shape=box]

END[label=出口ip_port_type_tuple_list, shape=box]

JUDGE[label="feature_vectors == []" color=Blue, fontsize=24, shape=diamond]

START -> JUDGE

                {rank=same; "extract_features()", "load_mimvp()"}

                JUDGE -> "extract_features()"[label=True tailport=w]// headport=n]

                        "extract_features()"[style=filled, fillcolor=orange]

                JUDGE -> "load_mimvp()"[label=False tailport=s headport=n]

"extract_features()" -> "load_mimvp()"[label=return, fontcolor=red, dir=forward]   //dir=forward, back, both, or none

port_src_list[style=filled, fillcolor=yellow]

port_list[style=filled, fillcolor=green]

"load_mimvp()" -> {ip_list, type_list, port_src_list}

                                        port_src_list -> port_list

{rank=same; ip_list, type_list, port_list} -> "merge_result" -> END

    subgraph cluster1

    {

    label=子图1_特征提取

    "invoke extract_features()"[style=filled, fillcolor=orange]

    judge[label="filepath is not None" color=Blue, shape=diamond]

    feature_vectors[style=filled, fillcolor=red]

    "invoke extract_features()" -> judge

        judge -> "load_images_from_filepath()"[label=True tailport=w]

        judge -> "load_images_from_src_list()"[label=False tailport=s]

        {rank=same; "load_images_from_filepath()", "load_images_from_src_list()"}

            "load_images_from_filepath()" -> "split_image()"[label=img_list]

            "load_images_from_src_list()" -> "split_image()"[label=img_list]

                "split_image()" -> "build_vector()"[label="split_imgs"]

                    "build_vector()" -> feature_vectors[label="item = {input: vector}"]   // -> "load_mimvp()"

    }

    subgraph cluster2

    {

    label=子图2_余弦相似度比较

    port_src[style=filled, fillcolor=yellow]

    port[style=filled, fillcolor=green]

    port_src -> "get_port()" -> "load_image_from_src()" -> "invoke split_image()" -> "invoke build_vector()"

        "invoke build_vector()" -> "cos_similarity()"[label="vector\nfeature_vectors", fontcolor=red]

            "cos_similarity()" -> port

    }

}
代码另存为eg.dot, 编码utf-8
在命令行中运行:G:\pydata\pycode>dot eg.dot -Tpng -o eg.png
流程图 Graphviz - Graph Visualization Software的更多相关文章
- Graphviz - Graph Visualization Software 开源可视化绘图工具(visio 类)
http://www.graphviz.org/Download_windows.php Welcome to Graphviz Available translations: Romanian, ...
- Graph Visualization
1. 什么是graph visualization? Graph visualization is a way of representing structural information as di ...
- Trendalyzer is an information visualization software
Trendalyzer is an information visualization software for animation of statistics that was initially ...
- 边捆绑: Content Importance Based Edge Bundling for Graph Visualization
Problem 当图所要表达的信息较多时, 图中可能会充满交叉的线[1-2], 甚至整个显示空间都被点.线所覆盖, 这时想通过观察来获取图中的重要信息将会变得非常困难, 这种现象称为图的视觉混乱. K ...
- Python - 运行流程图, call graph, 调用图
解决方案 pycallgraph(感觉直接用pycallgraph grahviz命令生成的图并不是我想要的) 如何去阅读并学习一些优秀的开源框架的源码? - mailto1587的回答 - 知乎 h ...
- python之验证码识别 特征向量提取和余弦相似性比较
0.目录 1.参考2.没事画个流程图3.完整代码4.改进方向 1.参考 https://en.wikipedia.org/wiki/Cosine_similarity https://zh.wikip ...
- graphviz使用
官方网站:http://www.graphviz.org/ Graphviz (Graph Visualization Software) 是一个由AT&T实验室启动的开源工具包.DOT是一种 ...
- software collection
software software Table of Contents 1. Privacy 2. GFW 2.1. google search 2.2. 修改 DNS 服务器 2.2.1. 修改ip ...
- linux下阅读源代码的工具
说来真是惭愧呀.一直在用VIM 做开发.却不知道VI 里还有这么好使的工具.以前一直都是用: find -type f -print | xargs grep -i **** 在源代码里查找. 原来L ...
随机推荐
- 一道搜索题【2013 noip提高组 DAY2 t3】华容道
这篇不多说,具体的解释都在程序里 题目描述 [问题描述] 小 B 最近迷上了华容道,可是他总是要花很长的时间才能完成一次.于是,他想到用编程来完成华容道:给定一种局面, 华容道是否根本就无法完成,如果 ...
- IOS应用内嵌cocos2dx游戏项目
1.创建Cocos2d-x项目 相比于Android来说cocos2dx的iPhone环境基本不用配置,直接创建用xcode打开就可以运行. 到Cocos2d-x官方网站下载最新版本引擎. 将刚才下载 ...
- 004_zookeeper运维之maxClientCnxns overflow
一. 线上默认设置:maxClientCnxns=120 #可通过修改这个值来进行解决 二. 在10.103.110.51这个ip上执行以下命令,进行查看连接情况 [root@10.103.101 ...
- LabVIEW-PC-PLC-MCU串口通信-介绍很全
链接:https://pan.baidu.com/s/1dG9nuPN 密码:vnpf
- 转载:UML学习(二)-----类图(silent)
原文:http://www.cnblogs.com/huiy/p/8552607.html 1.什么是类图 类图(Class diagram)主要用于描述系统的结构化设计.类图也是最常用的UML图,用 ...
- 51nod--1264 线段相交 (计算几何基础, 二维)
题目: 1264 线段相交 基准时间限制:1 秒 空间限制:131072 KB 分值: 0 难度:基础题 收藏 关注 给出平面上两条线段的两个端点,判断这两条线段是否相交(有一个公共点或有部分重合认为 ...
- Light OJ 1095
题意: 给你 N 个数, 总共有 N! 种排列, 现在 要你统计前 M 个数 刚好 有K 个数 在原来的位置上 的排列个数 思路: 首先 M 中选 K C(m,k): 则 共 剩下 n - k 个数, ...
- 前端 ---jQuery的补充
15-jQuery补充 jquery内容补充 jquery除了咱们上面讲解的常用知识点之外,还有jquery 插件.jqueryUI知识点 jqueryUI 官网: https://jqueryu ...
- Go学习笔记(只有链接)
Go学习笔记 link: https://blog.csdn.net/u011304970/article/details/69908641 仅作为记录使用.
- Codeforces 833D Red-Black Cobweb [点分治]
洛谷 Codeforces 思路 看到树上路径的统计,容易想到点分治. 虽然只有一个限制,但这个限制比较麻烦,我们把它拆成两个. 设黑边有\(a\)条,白边有\(b\)条,那么有 \[ 2a\geq ...