Open Distro for Elasticsearch – How Different Is It?
转自:https://logz.io/blog/open-distro-for-elasticsearch
Last month, AWS announced an initiative called Open Distro for Elasticsearch. Since then, there has been a lot of debate as to what this move means for the future of the ELK Stack and the community. What are the motives behind this move? Does this split actually signify a fork?
While these questions are extremely important to answer, I’m not going to attempt to answer them here. What I do think might benefit end users at this point is an understanding of what this new stack (yes, it’s not just Elasticsearch) actually includes in comparison to Elastic’s open source and commercial repositories, and how to get started.
A few clarifications
We will take a closer look at specific features included in the project later on, but just to make things clear — Open Distro for Elasticsearch, despite the misleading name that hopefully will be changed soon, does not include only Elasticsearch but also Kibana and some additional plugins. It does NOT include Logstash or any of the Beats. The Elasticsearch and Kibana version currently used is 6.6.2 and Kibana 6.5.4.
A second point worth pointing out, and this is probably obvious — at version 0.8.0 Open Distro for Elasticsearch is not production-ready. There are some nifty features included in the package but I think we still have some time to wait until version 1.0.0.
Installing Open Distro for Elasticsearch
Currently, the project supports two installation methods – via RPM package or suing Docker images. Since I have Docker Desktop installed on my Mac, I opted for the latter.
You can pull and run the individual Elasticsearch and Kibana images if you like, but the easier option is using docker-compose. One important note if you’re using Docker Desktop — be sure to allocate at least 8GB of RAM to the program (Preferences → Advanced).
Create a docker-compose.yml file:
|
1
2
3
|
sudo mkdir open-distro-elasticsearch
cd open-distro-elasticsearch
sudo vim docker-compose.yml
|
Paste the following configuration:
|
1
2
3
4
5
6
7
8
9
10
11
12
13
14
15
16
17
18
19
20
21
22
23
24
25
26
27
28
29
30
31
32
33
34
35
36
37
38
39
40
41
42
43
44
45
46
47
48
49
50
51
52
53
54
|
version: '3'
services:
odfe-node1:
image: amazon/opendistro-for-elasticsearch:0.7.0
container_name: odfe-node1
environment:
- cluster.name=odfe-cluster
- bootstrap.memory_lock=true # along with the memlock settings below, disables swapping
- "ES_JAVA_OPTS=-Xms512m -Xmx512m" # minimum and maximum Java heap size, recommend setting both to 50% of system RAM
ulimits:
memlock:
soft: -1
hard: -1
volumes:
- odfe-data1:/usr/share/elasticsearch/data
ports:
- 9200:9200
- 9600:9600 # required for Performance Analyzer
networks:
- odfe-net
odfe-node2:
image: amazon/opendistro-for-elasticsearch:0.7.0
container_name: odfe-node2
environment:
- cluster.name=odfe-cluster
- bootstrap.memory_lock=true
- "ES_JAVA_OPTS=-Xms512m -Xmx512m"
- discovery.zen.ping.unicast.hosts=odfe-node1
ulimits:
memlock:
soft: -1
hard: -1
volumes:
- odfe-data2:/usr/share/elasticsearch/data
networks:
- odfe-net
kibana:
image: amazon/opendistro-for-elasticsearch-kibana:0.7.0
container_name: odfe-kibana
ports:
- 5601:5601
expose:
- "5601"
environment:
ELASTICSEARCH_URL: https://odfe-node1:9200
networks:
- odfe-net
volumes:
odfe-data1:
odfe-data2:
networks:
odfe-net:
|
As you can see, there are no big surprises here, with the regular ports for Elasticsearch and Kibana mapped (9200/5601) as well as an additional port for the Perf Analyzer (9600). Memory swap is disabled and JVM heap size set.
It’s time to deploy the images:
|
1
|
docker-compose up
|
Docker will take a while to download the images and run the containers, but when done, you’ll see two Elasticsearch containers and one Kibana container running:
|
1
2
3
4
5
6
|
docker ps
CONTAINER ID IMAGE COMMAND CREATED STATUS PORTS NAME
9873efd238ab amazon/opendistro-for-elasticsearch:0.7.0 "/usr/local/bin/dock…" About a minute ago Up About aminute 9200/tcp, 9300/tcp, 9600/tcp odfe-node2
e3d5558670df amazon/opendistro-for-elasticsearch-kibana:0.7.0 "/usr/local/bin/kiba…" About a minute ago Up About aminute 0.0.0.0:5601->5601/tcp odfe-kibana
1cb902342766 amazon/opendistro-for-elasticsearch:0.7.0 "/usr/local/bin/dock…" About a minute ago Up About aminute 0.0.0.0:9200->9200/tcp, 0.0.0.0:9600->9600/tcp, 9300/tcp odfe-node1
|
Once you’ve verified all the containers are up and running as expected, we can test our stack by querying Elasticsearch and opening Kibana in our browser.
Now, one key difference compared to what we’ve been used to with the ELK Stack is that the security plugin is enabled by default.
Opening the Elasticsearch configuration file (on Docker container, located at: /usr/share/elasticsearch/elasticsearch.yml) this difference is quickly apparent:
|
1
2
3
4
5
6
7
8
9
10
11
12
13
14
15
16
17
18
19
20
21
22
23
24
25
26
27
28
29
|
cluster.name: "docker-cluster"
network.host: 0.0.0.0
# minimum_master_nodes need to be explicitly set when bound on a public IP
# set to 1 to allow single node clusters
# Details: https://github.com/elastic/elasticsearch/pull/17288
discovery.zen.minimum_master_nodes: 1
######## Start OpenDistro for Elasticsearch Security Demo Configuration ########
# WARNING: revise all the lines below before you go into production
opendistro_security.ssl.transport.pemcert_filepath: esnode.pem
opendistro_security.ssl.transport.pemkey_filepath: esnode-key.pem
opendistro_security.ssl.transport.pemtrustedcas_filepath: root-ca.pem
opendistro_security.ssl.transport.enforce_hostname_verification: false
opendistro_security.ssl.http.enabled: true
opendistro_security.ssl.http.pemcert_filepath: esnode.pem
opendistro_security.ssl.http.pemkey_filepath: esnode-key.pem
opendistro_security.ssl.http.pemtrustedcas_filepath: root-ca.pem
opendistro_security.allow_unsafe_democertificates: true
opendistro_security.allow_default_init_securityindex: true
opendistro_security.authcz.admin_dn:
- CN=kirk,OU=client,O=client,L=test, C=de
opendistro_security.audit.type: internal_elasticsearch
opendistro_security.enable_snapshot_restore_privilege: true
opendistro_security.check_snapshot_restore_write_privileges: true
opendistro_security.restapi.roles_enabled: ["all_access","security_rest_api_access"]
cluster.routing.allocation.disk.threshold_enabled: false
node.max_local_storage_nodes: 3
|
And Kibana’s configuration (on Docker container, located at config/kibana.yml):
|
1
2
3
4
5
6
7
8
9
10
11
|
server.name: kibana
server.host: "0"
elasticsearch.url: https://localhost:9200
elasticsearch.ssl.verificationMode: none
elasticsearch.username: kibanaserver
elasticsearch.password: kibanaserver
elasticsearch.requestHeadersWhitelist: ["securitytenant","Authorization"]
opendistro_security.multitenancy.enabled: true
opendistro_security.multitenancy.tenants.preferred: ["Private", "Global"]
opendistro_security.readonly_mode.roles: ["kibana_read_only"]
|
So using the default authentication credentials, admin: admin, we will first query Elasticsearch:
|
1
2
3
4
5
6
7
8
9
10
11
12
13
14
15
16
17
18
19
|
curl -XGET https://localhost:9200 -u admin:admin --insecure
{
"name" : "28j31GT",
"cluster_name" : "odfe-cluster",
"cluster_uuid" : "xIMhCp8zR1CVM0t3mfFYow",
"version" : {
"number" : "6.5.4",
"build_flavor" : "oss",
"build_type" : "tar",
"build_hash" : "d2ef93d",
"build_date" : "2018-12-17T21:17:40.758843Z",
"build_snapshot" : false,
"lucene_version" : "7.5.0",
"minimum_wire_compatibility_version" : "5.6.0",
"minimum_index_compatibility_version" : "5.0.0"
},
"tagline" : "You Know, for Search"
}
|
And then access Kibana at: http://localhost:5601:

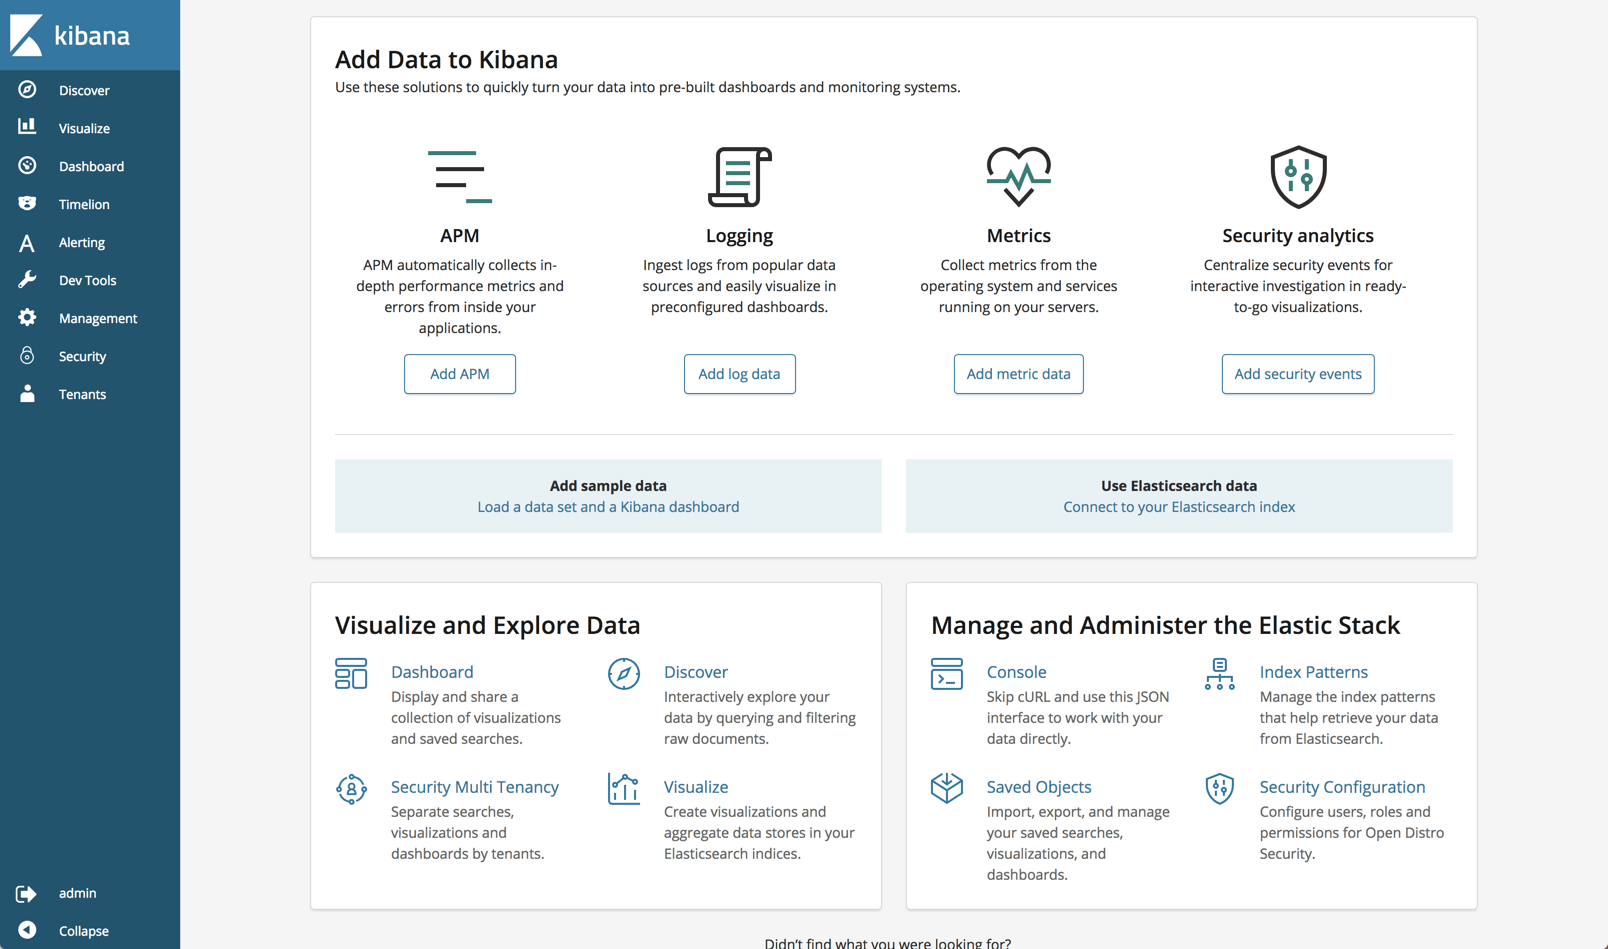
Security plugin
Security is the most meaningful open source addition to the ELK Stack and as such deserves a followup article. Still, some points are worth mentioning.
AWS concurs that most of the security features in Open Distro for Elasticsearch are based on Search Guard code, developed together with floragunn, the developers of Search Guard.
Anyone familiar with this security plugin for ELK will find a lot of the same functionality. Role-based access, user control and mapping, audit logging, API, AD and LDAP support — these are all part and parcel of the security plugin.
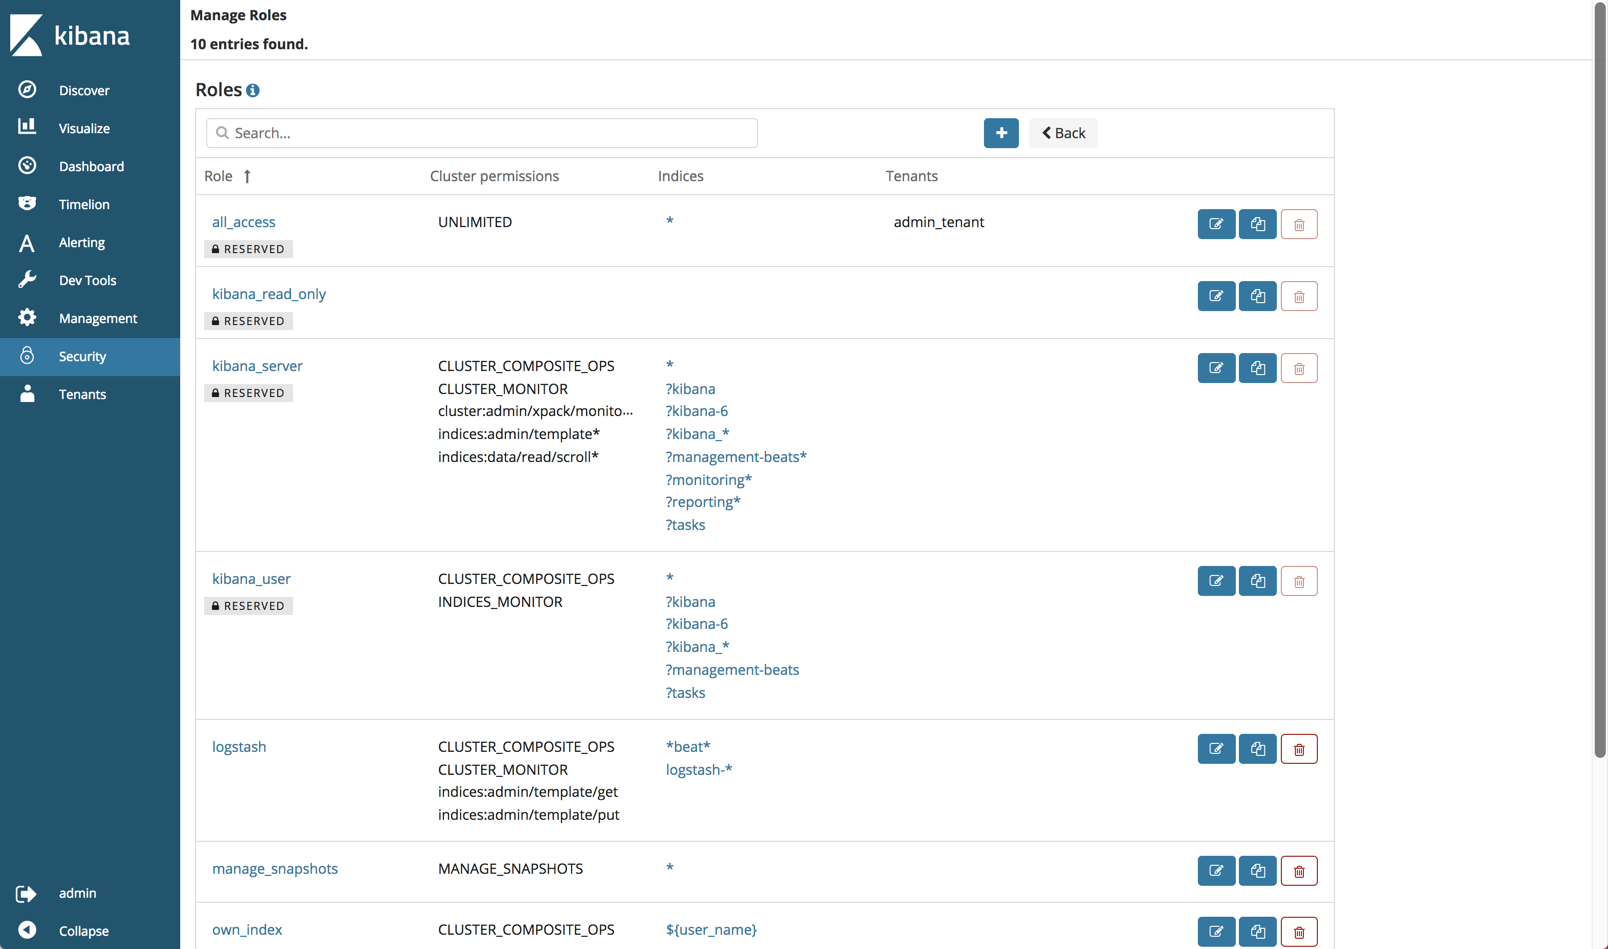
As mentioned above, Open Distro for Elasticsearch will authenticate with some default credentials (admin:admin) but you should definitely change those after setup.
You can of course disable security if you like by adding the following line to your elasticsearch.yml file:
|
1
|
opendistro_security.disabled: true
|
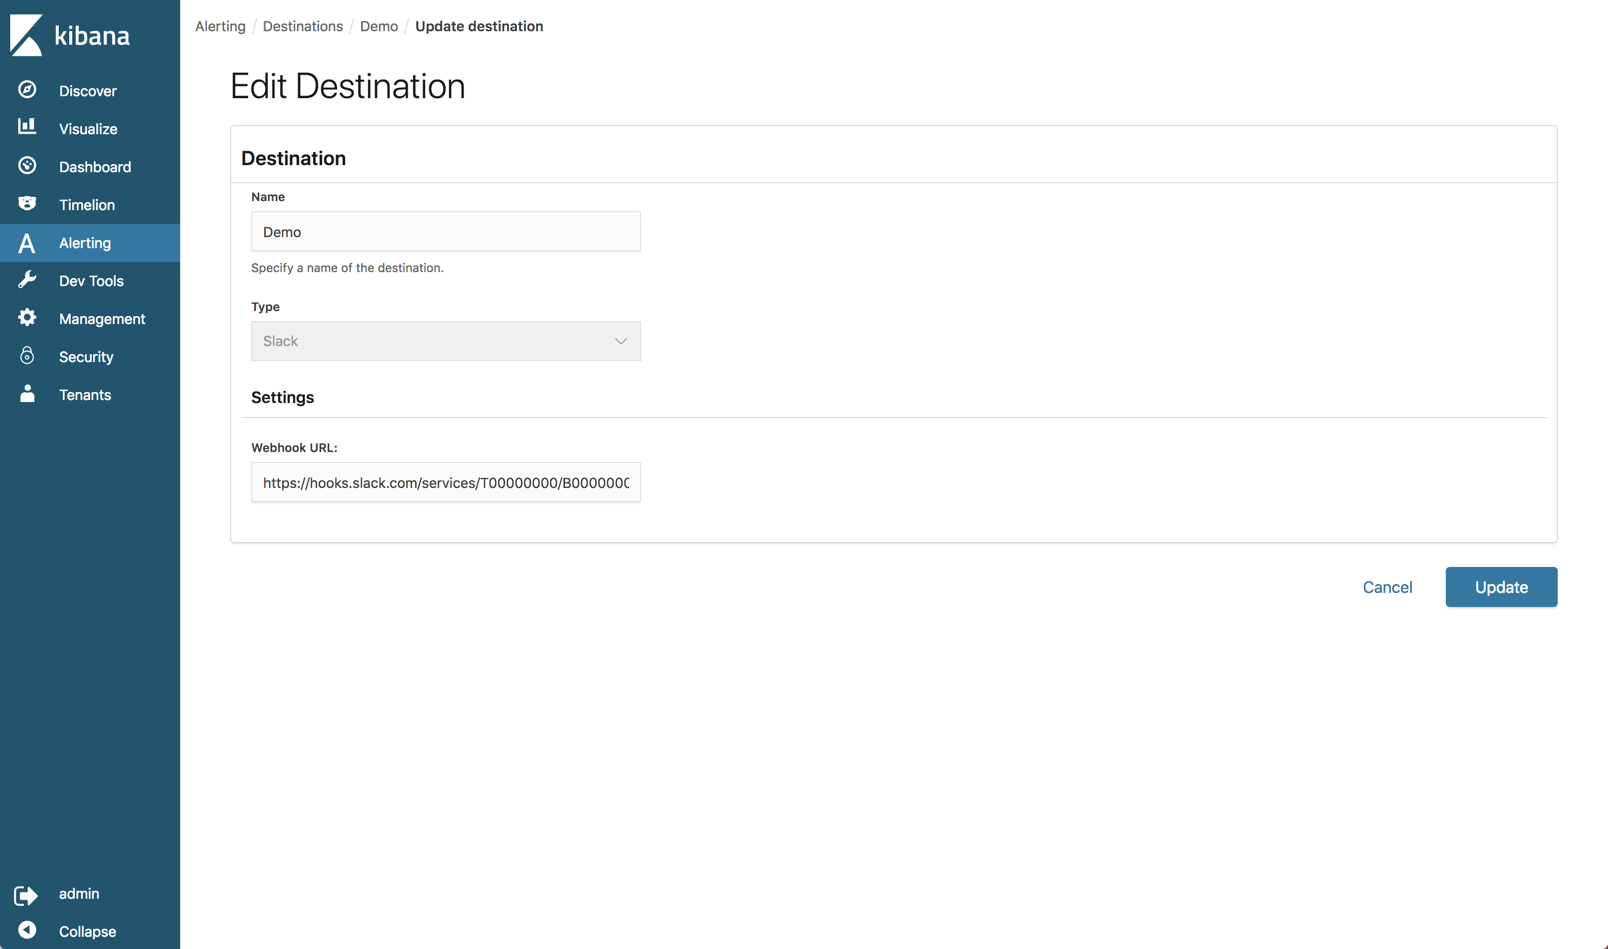
Alerting plugin
Open Distro for Elasticsearch provides a built-in mechanism for sending an alert when an Elasticsearch index meets a threshold and conditions that you define.
On the new Alerts page in Kibana, you will find a tab where you can define where you want to send the alert to (destination). Currently, Slack and AWS Chime are the only built-in destinations.
The alerts themselves are configured on the Monitors tab. Here you define the schedule of the alert (i.e. when you want the monitor to run) and the specific query you want to run against your Elasticsearch indices. You can build the query itself or use a graph as a visual aid to building the query.
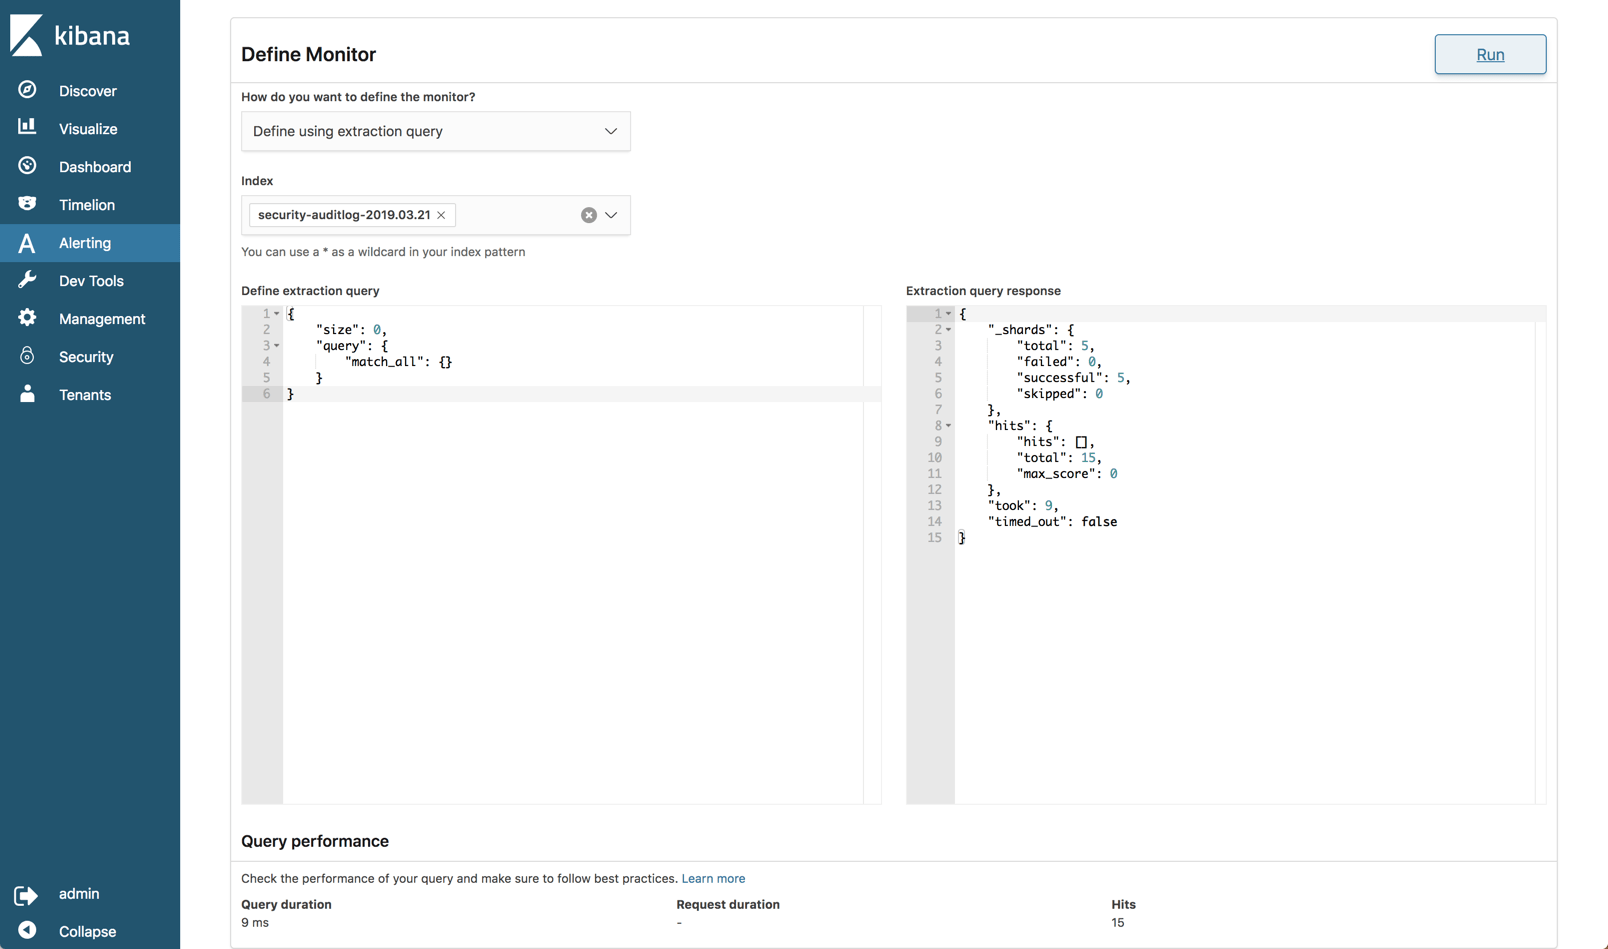
You then need to build what’s called a trigger which defines the specific condition that the monitor checks and an action to execute when an alert is triggered.
After an initial look, I would carefully say that the alerting mechanism in Open Distro for Elasticsearch is still a bit raw at the edges and immature but let’s wait and see how it evolves.
Performance Analyzer
A known pain point with handling Elasticsearch is monitoring performance. The Performance Analyzer plugin is an agent that can be installed locally and used to query performance metrics on your cluster.
First, you’ll need to download the Performance Analyzer from: https://opendistro.github.io/for-elasticsearch/downloads.html
Extract it, and access the main installation folder:
|
1
2
|
sudo unzip perf-top-0.7.0.0-MACOS.zip
cd perf-top-0.7.0.0-MACOS
|
In the dashboards folder, you’ll see four provided dashboards which we can use to monitor our Elasticsearch cluster: ClusterNetworkMemoryAnalysis.json, ClusterOverview.json, ClusterThreadAnalysis.json and NodeAnalysis.json. You can also create your own dashboards for monitoring other metrics.
The syntax for using the Performance Analyzer specifies the dashboard name and an endpoint for the cluster, in our case, our local cluster (remember, we opened port 9600 when deploying the cluster):
|
1
|
./perf-top-macos --dashboard dashboards/ClusterNetworkMemoryAnalysis.json --endpoint localhost:9600
|
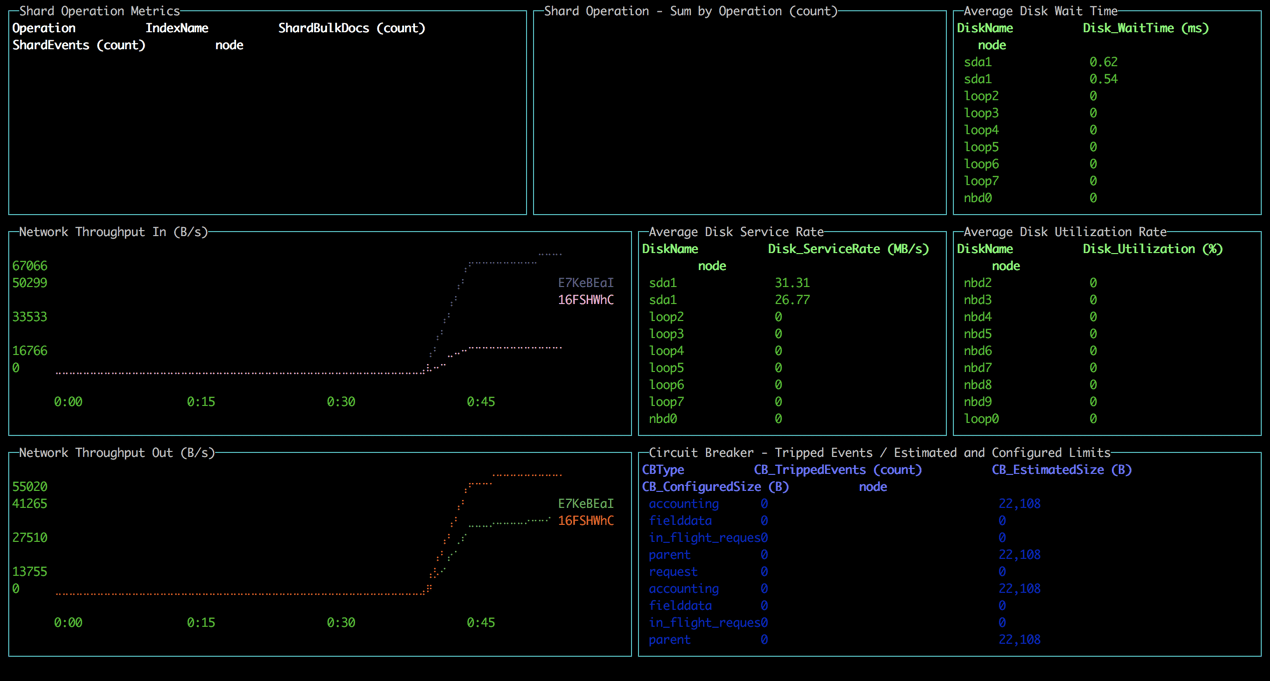
All in all, the tool is easy to install and use but of course lacks the ability to perform analysis over time.
Side-by-side
So is all the fuss we’ve seen in the ELK community warranted?
From a features perspective, all versions support the key functionality provided in Elasticsearch and Kibana — data indexing, searching, aggregation and analysis.
The added plugins provided in Open Distro for Elasticsearch are more or less on par with the corresponding features in the ELK Stack available under the Basic license. The only exception here is the Alerting feature, which seems to be a nice first step, if somewhat more complicated to use.
Here’s a comparison that sums up the key differences. I’m comparing Open Distro for Elasticsearch with the open source ELK Stack and the commercial version of the ELK Stack:
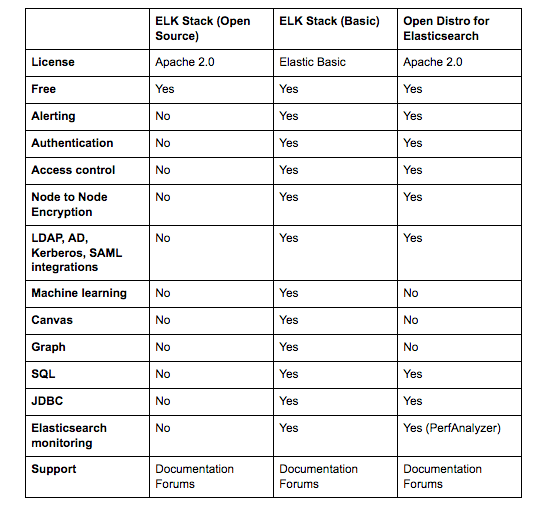
The biggest difference, of course, is licensing. This was the key driver behind the project to start with. The additional plugins reviewed above are all Apache 2.0 licensed and completely open sourced compared to the same features in the ELK Stack. For many users, the fact that they can freely use security, alerting, and the other plugins provided in Open Distro for Elasticsearch that I didn’t mention here — JDBC and SQL, makes all the difference.
Everything comes at a cost
I’d like to end this review with another point that I think is worth mentioning — the cost.
If it’s open source then there is no cost, right? Well, we’ve been very clear in the past on what it entails to maintain the ELK Stack at scale. Handling large data pipelines in production, deploying buffering mechanisms, monitoring your Elasticsearch cluster and maintaining it, handling upgrades — all these will come at a cost. There is little to no difference between Open Distro for Elasticsearch and Elastic’s ELK Stack when looking at the real costs of doing ELK on your own.
I think it’s great to see how more groups are contributing to the ecosystem and I believe that at the end of the day, this new development will benefit ELK users by driving new innovation and developing the stack.
Reiterating what I said in the introduction, Open Distro for Elasticsearch is not production-ready. Proceed with caution!
Open Distro for Elasticsearch – How Different Is It?的更多相关文章
- AWS 为 Elasticsearch 推出开源发行版
WS 近日宣布为 Elasticsearch 推出开源发行版 Open Distro for Elasticsearch. Elasticsearch 是一个分布式.面向文档的搜索和分析引擎,它支持结 ...
- 大数据篇:ElasticSearch
ElasticSearch ElasticSearch是什么 ElasticSearch是一个基于Lucene的搜索服务器.它提供了一个分布式多用户能力的全文搜索引擎,基于RESTful web接口. ...
- Atlas2.2.0编译、安装及使用(集成ElasticSearch,导入Hive数据)
1.编译阶段 组件信息: 组件名称 版本 Atals 2.2.0 HBase 2.2.6 Hive 3.1.2 Hadoop 3.1.1 Kafka 2.11_2.4.1 Zookeeper 3.6. ...
- Elasticsearch之java的基本操作一
摘要 接触ElasticSearch已经有一段了.在这期间,遇到很多问题,但在最后自己的不断探索下解决了这些问题.看到网上或多或少的都有一些介绍ElasticSearch相关知识的文档,但个人觉得 ...
- Elasticsearch 5.0 中term 查询和match 查询的认识
Elasticsearch 5.0 关于term query和match query的认识 一.基本情况 前言:term query和match query牵扯的东西比较多,例如分词器.mapping ...
- 以bank account 数据为例,认识elasticsearch query 和 filter
Elasticsearch 查询语言(Query DSL)认识(一) 一.基本认识 查询子句的行为取决于 query context filter context 也就是执行的是查询(query)还是 ...
- Ubuntu 14.04中Elasticsearch集群配置
Ubuntu 14.04中Elasticsearch集群配置 前言:本文可用于elasticsearch集群搭建参考.细分为elasticsearch.yml配置和系统配置 达到的目的:各台机器配置成 ...
- ElasticSearch 5学习(10)——结构化查询(包括新特性)
之前我们所有的查询都属于命令行查询,但是不利于复杂的查询,而且一般在项目开发中不使用命令行查询方式,只有在调试测试时使用简单命令行查询,但是,如果想要善用搜索,我们必须使用请求体查询(request ...
- ElasticSearch 5学习(9)——映射和分析(string类型废弃)
在ElasticSearch中,存入文档的内容类似于传统数据每个字段一样,都会有一个指定的属性,为了能够把日期字段处理成日期,把数字字段处理成数字,把字符串字段处理成字符串值,Elasticsearc ...
随机推荐
- 模块化 Sea.js(CMD)规范 RequireJS(AMD)规范 的用法
插入第三方库AMD CMD都 一样 如:JQ(再JQ源码里修改) 使用seajs的步骤 1.HTML里引入seajs <script src="./lib/sea.js"& ...
- git 命令提交项目到github
git 命令提交项目到github步骤如下: 1.使用git 命令客户端进入项目根路径,输入 git init 命令,创建github本地根目录 2.把文件加入到本地项目 git add . ,如 ...
- org.springframework.cloud FeignInterceptor
package org.rx.feign; import org.apache.commons.lang3.ArrayUtils; import org.aspectj.lang.Proceeding ...
- 第九周学习笔记-ADO.Net中DataSet的应用
一.知识点描述 1.含义:DataSet是ADO.Net的断开式结构的核心组件,它可以用于多种不同的数据源,用于XML数据,或用于管理应用程序本地的数据.DataSet包含一个或多个DataTable ...
- div css 图片和文字上下居中对齐
想要图片和文字水平居中对齐很容易,可今天做这个树的时候,遇到了要将图片上下居中.这下就不知道怎么搞. 拿手册看也看不出所以然来,不同的浏览器对DIV的支持不一个,目前最好的浏览器是Firefox. 这 ...
- [转载] java并发编程:Lock(线程锁)
作者:海子 原文链接: http://www.cnblogs.com/dolphin0520/p/3923167.html 出处:http://www.cnblogs.com/dolphin0520/ ...
- [C++]几种排序
本文为大大维原创,最早于博客园发表,转载请注明出处!!! 1.冒泡: #include<cmath> #include<cstdlib> #include<ctime&g ...
- poi读取excel工具类
package com.manage.utils; import ch.qos.logback.core.net.SyslogOutputStream; import com.google.gson. ...
- python基础一之课后作业:编写登录接口
1 # Author : Mamba 2 3 #python基础一之课后作业:编写登录接口 4 5 # 输入用户名密码 6 # 认证成功后显示欢迎信息 7 # 用户名3次输入错误后,退出程序 8 # ...
- git 安装配置
一.下载安装Git 1.下载Git 官方地址为:https://git-scm.com/download/win 2.下载完之后,双击安装 3.选择安装目录 4.选择组件 5.开始菜单目录名设置 6 ...