
部署k8s的heapster监控
Heapster是容器集群监控和性能分析工具,天然的支持Kubernetes和CoreOS
heapster监控目前官网已经不更新,部署学习使用
heapster: 收集监控数据
influxdb:数据库,存储数据
grafana:web页面展示
1、heapster安装包下载
地址:https://github.com/kubernetes-retired/heapster/releases
把对应的tar包下载
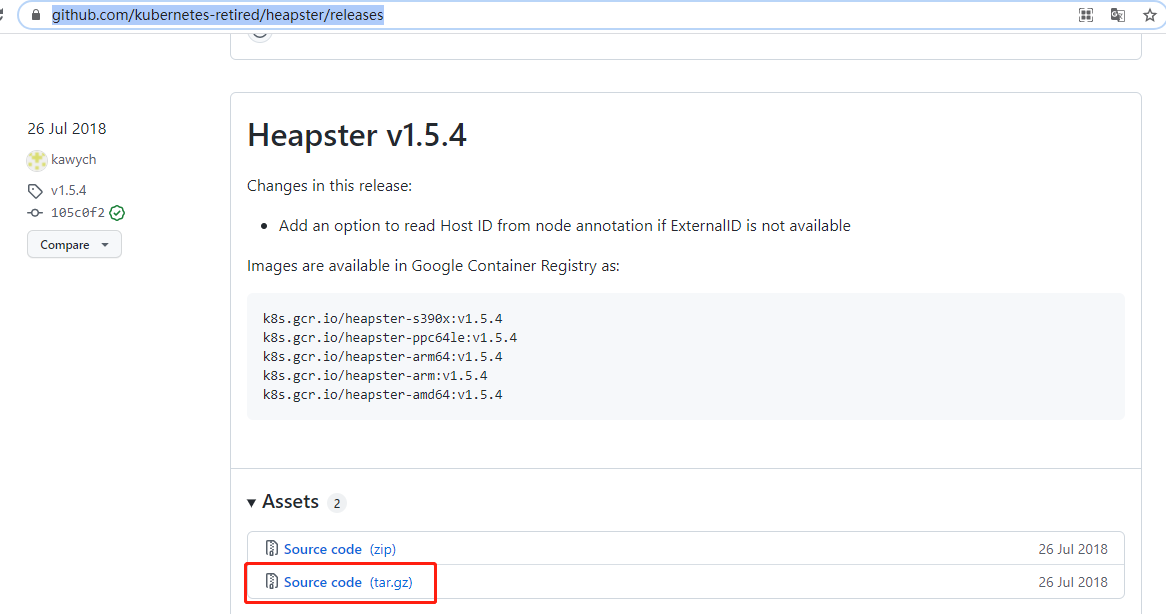
解压包,在路径:heapster-1.5.4\heapster-1.5.4\deploy\kube-config\rbac下找到heapster-rbac.yaml

在路径heapster-1.5.4\heapster-1.5.4\deploy\kube-config\influxdb下找到grafana.yaml,heapster.yaml,influxdb.yaml
2、部署influxdb
新版本k8sapi变动,修改Deployment apiVersion为apiVersion: apps/v1
镜像修改为国内镜像源:image: registry.aliyuncs.com/google_containers/heapster-influxdb-amd64:v1.5.2
增加selector选择器
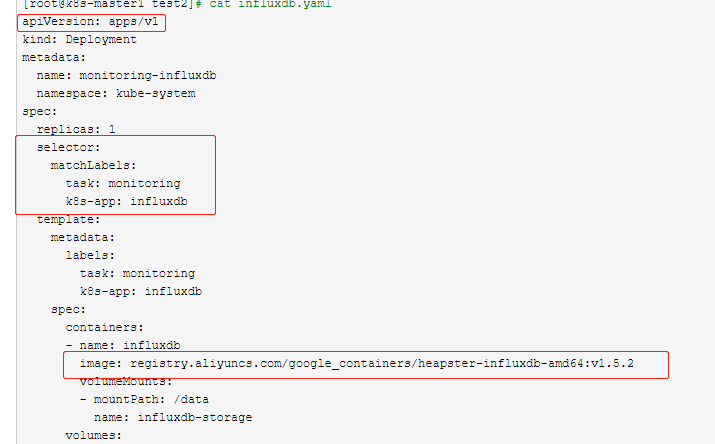
[root@k8s-master1 test2]# cat influxdb.yaml

apiVersion: apps/v1

kind: Deployment

metadata:

  name: monitoring-influxdb

  namespace: kube-system

spec:

  replicas: 1

  selector:

    matchLabels:

      task: monitoring

      k8s-app: influxdb

  template:

    metadata:

      labels:

        task: monitoring

        k8s-app: influxdb

    spec:

      containers:

      - name: influxdb

        image: registry.aliyuncs.com/google_containers/heapster-influxdb-amd64:v1.5.2

        volumeMounts:

        - mountPath: /data

          name: influxdb-storage

      volumes:

      - name: influxdb-storage

        emptyDir: {}

---

apiVersion: v1

kind: Service

metadata:

  labels:

    task: monitoring

    # For use as a Cluster add-on (https://github.com/kubernetes/kubernetes/tree/master/cluster/addons)

    # If you are NOT using this as an addon, you should comment out this line.

    kubernetes.io/cluster-service: 'true'

    kubernetes.io/name: monitoring-influxdb

  name: monitoring-influxdb

  namespace: kube-system

spec:

  ports:

  - port: 8086

    targetPort: 8086

  selector:

    k8s-app: influxdb

 部署influxdb:

 # kubectl apply -f influxdb.yaml
3、部署heapster
新版本k8sapi变动,修改Deployment apiVersion为apiVersion: apps/v1
镜像修改为国内镜像源:image: registry.aliyuncs.com/google_containers/heapster-amd64:v1.5.4
增加selector选择器
source参数修改为:- --source=kubernetes:https://kubernetes.default?kubeletHttps=true&kubeletPort=10250&insecure=true
不修改会提示报错,kubectl logs可以查询到对应报错信息

[root@k8s-master1 test2]# cat heapster.yaml

apiVersion: v1

kind: ServiceAccount

metadata:

  name: heapster

  namespace: kube-system

---

apiVersion: apps/v1

kind: Deployment

metadata:

  name: heapster

  namespace: kube-system

spec:

  replicas: 1

  selector:

    matchLabels:

      task: monitoring

      k8s-app: heapster

  template:

    metadata:

      labels:

        task: monitoring

        k8s-app: heapster

    spec:

      serviceAccountName: heapster

      containers:

      - name: heapster

        image: registry.aliyuncs.com/google_containers/heapster-amd64:v1.5.4

        imagePullPolicy: IfNotPresent

        command:

        - /heapster

        - --source=kubernetes:https://kubernetes.default?kubeletHttps=true&kubeletPort=10250&insecure=true

        - --sink=influxdb:http://monitoring-influxdb.kube-system.svc:8086

---

apiVersion: v1

kind: Service

metadata:

  labels:

    task: monitoring

    # For use as a Cluster add-on (https://github.com/kubernetes/kubernetes/tree/master/cluster/addons)

    # If you are NOT using this as an addon, you should comment out this line.

    kubernetes.io/cluster-service: 'true'

    kubernetes.io/name: Heapster

  name: heapster

  namespace: kube-system

spec:

  ports:

  - port: 80

    targetPort: 8082

  selector:

    k8s-app: heapster
用户权限,默认的没有create权限
# kubectl apply -f heapster-rbac.yaml
重新导出yaml文件,修改rule角色权限
# kubectl get ClusterRole system:heapster -o yaml > heapster_modify.yaml
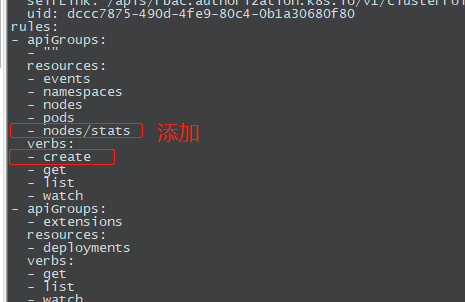
# kubectl apply -f heapster_modify.yaml
部署heapster
#kubectl apply -f heapster.yaml
查询角色权限,verbs中有了create权限

[root@k8s-master1 test2]# kubectl describe ClusterRole system:heapster

Name:         system:heapster

Labels:       kubernetes.io/bootstrapping=rbac-defaults

Annotations:  rbac.authorization.kubernetes.io/autoupdate: true

PolicyRule:

  Resources               Non-Resource URLs  Resource Names  Verbs

  ---------               -----------------  --------------  -----

  events                  []                 []              [create get list watch]

  namespaces              []                 []              [create get list watch]

  nodes/stats             []                 []              [create get list watch]

  nodes                   []                 []              [create get list watch]

  pods                    []                 []              [create get list watch]

  deployments.extensions  []                 []              [get list watch]
4、部署grafana
新版本k8sapi变动,修改Deployment apiVersion为apiVersion: apps/v1
镜像修改为国内镜像源:image: registry.aliyuncs.com/google_containers/heapster-grafana-amd64:v5.0.4
增加selector选择器
[root@k8s-master1 test2]# cat grafana.yaml

apiVersion: apps/v1

kind: Deployment

metadata:

  name: monitoring-grafana

  namespace: kube-system

spec:

  replicas: 1

  selector:

    matchLabels:

      task: monitoring

      k8s-app: grafana

  template:

    metadata:

      labels:

        task: monitoring

        k8s-app: grafana

    spec:

      containers:

      - name: grafana

        image: registry.aliyuncs.com/google_containers/heapster-grafana-amd64:v5.0.4

        ports:

        - containerPort: 3000

          protocol: TCP

        volumeMounts:

        - mountPath: /etc/ssl/certs

          name: ca-certificates

          readOnly: true

        - mountPath: /var

          name: grafana-storage

        env:

        - name: INFLUXDB_HOST

          value: monitoring-influxdb

        - name: GF_SERVER_HTTP_PORT

          value: "3000"

          # The following env variables are required to make Grafana accessible via

          # the kubernetes api-server proxy. On production clusters, we recommend

          # removing these env variables, setup auth for grafana, and expose the grafana

          # service using a LoadBalancer or a public IP.

        - name: GF_AUTH_BASIC_ENABLED

          value: "false"

        - name: GF_AUTH_ANONYMOUS_ENABLED

          value: "true"

        - name: GF_AUTH_ANONYMOUS_ORG_ROLE

          value: Admin

        - name: GF_SERVER_ROOT_URL

          # If you're only using the API Server proxy, set this value instead:

          # value: /api/v1/namespaces/kube-system/services/monitoring-grafana/proxy

          value: /

      volumes:

      - name: ca-certificates

        hostPath:

          path: /etc/ssl/certs

      - name: grafana-storage

        emptyDir: {}

---

apiVersion: v1

kind: Service

metadata:

  labels:

    # For use as a Cluster add-on (https://github.com/kubernetes/kubernetes/tree/master/cluster/addons)

    # If you are NOT using this as an addon, you should comment out this line.

    kubernetes.io/cluster-service: 'true'

    kubernetes.io/name: monitoring-grafana

  name: monitoring-grafana

  namespace: kube-system

spec:

  # In a production setup, we recommend accessing Grafana through an external Loadbalancer

  # or through a public IP.

  # type: LoadBalancer

  # You could also use NodePort to expose the service at a randomly-generated port

  # type: NodePort

  ports:

  - port: 80

    targetPort: 3000

  selector:

    k8s-app: grafana

  type: NodePort

部署grafana

# kubectl apply -f grafana.yaml
5、查询部署资源
[root@k8s-master1 test2]# kubectl get all -n kube-system | egrep 'heapster|monitor'

pod/heapster-7f6787db47-xjtg2             1/1     Running   2          17h

pod/monitoring-grafana-745bf97858-5484w   1/1     Running   2          18h

pod/monitoring-influxdb-77864d8b5-dlwwz   1/1     Running   2          18h

service/heapster              ClusterIP   10.103.130.255   <none>        80/TCP                   17h

service/monitoring-grafana    NodePort    10.102.137.71    <none>        80:31526/TCP             18h

service/monitoring-influxdb   ClusterIP   10.102.238.82    <none>        8086/TCP                 18h

deployment.apps/heapster              1/1     1            1           17h

deployment.apps/monitoring-grafana    1/1     1            1           18h

deployment.apps/monitoring-influxdb   1/1     1            1           18h

replicaset.apps/heapster-7f6787db47             1         1         1       17h

replicaset.apps/monitoring-grafana-745bf97858   1         1         1       18h

replicaset.apps/monitoring-influxdb-77864d8b5   1         1         1       18h
6、可以使用top命令查询node,pod等资源监控数据。这个需要等一段时间才会有数据
[root@k8s-master1 test2]# kubectl top node

NAME          CPU(cores)   CPU%   MEMORY(bytes)   MEMORY%

k8s-master1   125m         6%     1140Mi          29%

k8s-node1     39m          1%     587Mi           15%

k8s-node2     39m          1%     479Mi           12%
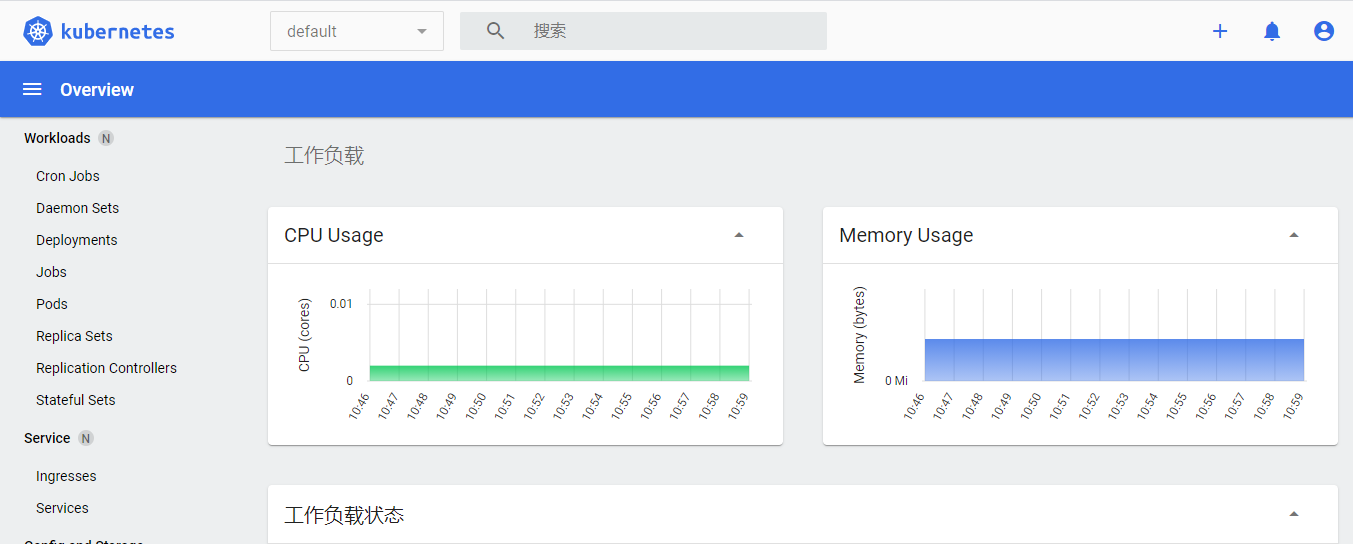
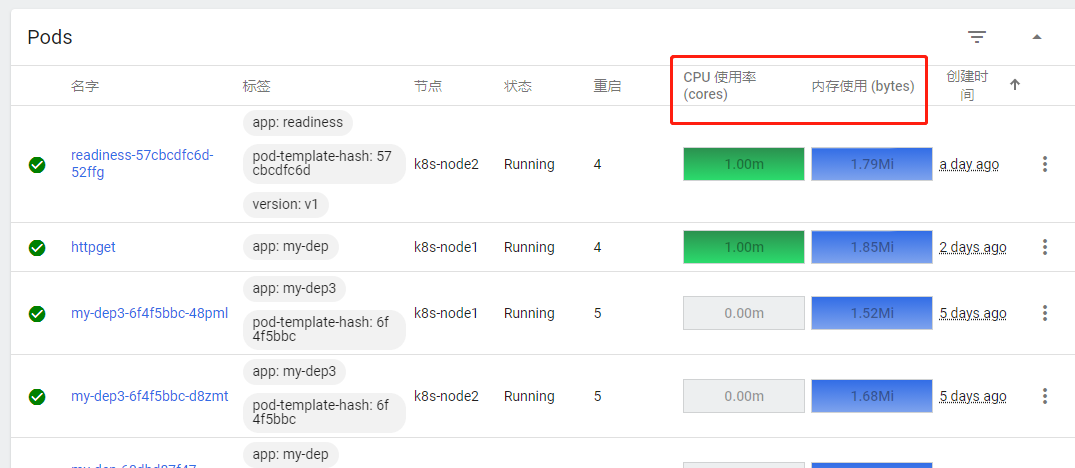
7、 结果展示,在dashboard页面可以看到资源监控数据
部署k8s的heapster监控的更多相关文章
- 部署k8s集群监控Heapster
git clone https://github.com/kubernetes/heapster.gitkubectl apply -f heapster/deploy/kube-config/inf ...
- k8s实战之部署Prometheus+Grafana可视化监控告警平台
写在前面 之前部署web网站的时候,架构图中有一环节是监控部分,并且搭建一套有效的监控平台对于运维来说非常之重要,只有这样才能更有效率的保证我们的服务器和服务的稳定运行,常见的开源监控软件有好几种,如 ...
- 从零开始入门 K8s | 可观测性:监控与日志
作者 | 莫源 阿里巴巴技术专家 一.背景 监控和日志是大型分布式系统的重要基础设施,监控可以帮助开发者查看系统的运行状态,而日志可以协助问题的排查和诊断. 在 Kubernetes 中,监控和日志 ...
- k8s全栈监控之metrics-server和prometheus
一.概述 使用metric-server收集数据给k8s集群内使用,如kubectl,hpa,scheduler等 使用prometheus-operator部署prometheus,存储监控数据 使 ...
- kubeadm构建k8s之Prometheus-operated监控(0.18.1)
介绍: 大家好,k8s的搭建有许多方式,也有许多快速部署的,为了简化部署的复杂度,官方也提供了开源的kubeadm快速部署,最新1.10.x版本已经可以实现部署集群, 如果你对k8s的原理已经非常了解 ...
- 使用kubeadm部署k8s
k8s组件 master,node master中包括apiserver,scheduler,controller.etcd apiserver:负责接收用户请求,并且保存至etcd中. schedu ...
- 部署K8S集群
1.Kubernetes 1.1.概念 kubernetes(通常称为k8s)用于自动部署.扩展和管理容器化应用程序的开源系统.它旨在提供“跨主机集群的自动部署.扩展以及运行应用程序容器的平台”.支持 ...
- 二进制部署k8s
一.二进制部署 k8s集群 1)参考文章 博客: https://blog.qikqiak.com 文章: https://www.qikqiak.com/post/manual-install-hi ...
- lvs+keepalived部署k8s v1.16.4高可用集群
一.部署环境 1.1 主机列表 主机名 Centos版本 ip docker version flannel version Keepalived version 主机配置 备注 lvs-keepal ...
随机推荐
- 为什么要使用TypeScript(Why Typescript?)
客观原因 静态类型. 在编译期即可进行静态类型分析, 减少JS运行时类型错误. 语法功能强大 对于大型项目具有更好构建机制,加入了类.接口.泛型.模块等概念. 兼容JavaScript 与现存的Jav ...
- hive完整搭建
安装 MySQL 服务的详细步骤如下: 1. 解压安装包 现在已经为大家下载好了 MySQL 5.7.25 的安装包,存放在 /root/software 目录下.首先进入此目录下,然后使用tar - ...
- SAP Drag or drop tree
1 *&---------------------------------------------------------------------* 2 *& Report RSDEM ...
- ansible管理windows主机
1. 在windows开启winrm winrm service 默认都是未启用的状态,先查看状态:如无返回信息,则是没有启动: winrm enumerate winrm/config/listen ...
- 项目中使用@Transactional需要注意的点
项目如果是Spring Boot.或者Spring Cloud,切记需要在启动类上加入@EnableTransactionManagement该注解.否则事务不生效. @Transactional是一 ...
- 千万不要把Request传递到异步线程里面!有坑!
你好哇,我是歪歪. 前几天在网上冲浪的时候看到一篇技术文章,讲的是他把一个 request 请求传递到了线程池里面,然后遇到了一个匪夷所思的情况. 他写了这篇文章,把自己针对这个问题的探索过程分享了出 ...
- Webpack干货系列 | 怎么运用 Webpack 5 处理css/scss/sass、less、stylus样式资源
程序员优雅哥简介:十年程序员,呆过央企外企私企,做过前端后端架构.分享vue.Java等前后端技术和架构. 本文摘要:主要讲解webpack 5 如何高效处理CSS 资源.scss/sass 资源.l ...
- 1.JS中变量的重新声明和提升
重新声明 1.允许在程序的任何位置使用 var 重新声明 JavaScript 变量: 实例 var x = 10; // 现在,x 为 10 var x = 6; // 现在,x 为 6 2.在相同 ...
- Ajax辨析
Ajax辨析 最近在多个知识点涉及到了ajax请求,各个知识有所交错,知识体系上学的有些混乱,这里梳理一下 单纯的发送Ajax请求 方式1: ajax传统4步骤 ajax的post请求 var xhr ...
- Str 真题解(置换)
目录 题面 置换 这里没有群论 置换 置换的乘法(复合) 置换乘法的单位元 置换乘法的结合律 置换快速幂 置换求乘法逆 真题解 一种可能的代码实现 关于循环节做法 题面 对于字符串 \(s\) 定义一 ...