
WPF在Canvas中绘图实现折线统计图
最近在WPF中做一个需要实现统计的功能,其中需要用到统计图,之前也没有接触过,度娘上大多都是各种收费或者免费的第三方控件,不想用第三方控件那就自己画一个吧。
在园子还找到一篇文章,思路来自这篇文章,文章链接:http://www.cnblogs.com/endlesscoding/p/6670432.html
不过根据我的需求,数据每次都在变化,所以都只能从后台绑定,先来看一下完成后的效果吧

可以看到,数据源是一年内一到十二月的金额,所以X轴是固定的,而Y轴标尺是根据数据源的最大值向上取100。再来计算每个标尺该显示的数值。
数据点的显示,也是根据提供数据的比例,来计算出像素值的
从头开始吧,先来说xaml,xaml中需要一个Canvas控件,之后所有的图形就是画在这里面
不会用Canvas的话可以先学习下官方文档:https://msdn.microsoft.com/zh-cn/library/system.windows.controls.canvas(v=vs.110).aspx
 <Grid Height="400" Width="645">

                         <Grid.ColumnDefinitions>

                             <ColumnDefinition Width="150" />

                             <ColumnDefinition Width="330"/>

                             <ColumnDefinition Width="*"/>

                         </Grid.ColumnDefinitions>

                         <Grid.RowDefinitions>

                             <RowDefinition Height="25" />

                             <RowDefinition />

                         </Grid.RowDefinitions>

                         <j:JLabel Label="企业账号:" Grid.Column="0" Grid.Row="0">

                             <TextBlock Text="{Binding Userid}" HorizontalAlignment="Left"  Foreground="Red"/>

                         </j:JLabel>

                         <j:JLabel Label="企业名称:" Grid.Column="1" Grid.Row="0">

                             <TextBlock Text="{Binding Username}" HorizontalAlignment="Left" Foreground="Red"/>

                         </j:JLabel>

                         <j:JLabel Label="总金额(元):" Grid.Column="2" Grid.Row="0">

                             <TextBlock Text="{Binding Pay_Total}" HorizontalAlignment="Left" Foreground="Red"/>

                         </j:JLabel>

                         <Canvas x:Name="chartCanvas" Margin="5" Grid.Column="0" Grid.Row="1" Grid.ColumnSpan="4">

                         </Canvas>

                     </Grid>
先来画横纵坐标和箭头吧,x1,y1,x2,y2这四个参数是Line在Canvas中的起点终点位置像素值
同样,Line类官方文档:https://msdn.microsoft.com/zh-cn/library/system.windows.shapes.line(v=vs.110).aspx
         /// <summary>

         /// 生成横纵坐标及箭头

         /// </summary>

         private void DrawArrow()

         {

             Line x_axis = new Line();//x轴

             Line y_axis = new Line();//y轴

             x_axis.Stroke = System.Windows.Media.Brushes.Black;

             y_axis.Stroke = System.Windows.Media.Brushes.Black;

             x_axis.StrokeThickness = ;

             y_axis.StrokeThickness = ;

             x_axis.X1 = ;

             x_axis.Y1 = ;

             x_axis.X2 = ;

             x_axis.Y2 = ;

             y_axis.X1 = ;

             y_axis.Y1 = ;

             y_axis.X2 = ;

             y_axis.Y2 = ;

             this.chartCanvas.Children.Add(x_axis);

             this.chartCanvas.Children.Add(y_axis);

             Line y_scale1 = new Line(); //坐标原点直角

             y_scale1.Stroke = System.Windows.Media.Brushes.Black;

             y_scale1.StrokeThickness =;

             y_scale1.X1 = ;

             y_scale1.Y1 = ;

             y_scale1.X2 = ;

             y_scale1.Y2 = ;

             y_scale1.StrokeStartLineCap = PenLineCap.Triangle;

             this.chartCanvas.Children.Add(y_scale1);

             Path x_axisArrow = new Path();//x轴箭头

             Path y_axisArrow = new Path();//y轴箭头

             x_axisArrow.Fill = new SolidColorBrush(Color.FromRgb(, , ));

             y_axisArrow.Fill = new SolidColorBrush(Color.FromRgb(, , ));

             PathFigure x_axisFigure = new PathFigure();

             x_axisFigure.IsClosed = true;

             x_axisFigure.StartPoint = new Point(, );                          //路径的起点

             x_axisFigure.Segments.Add(new LineSegment(new Point(, ), false)); //第2个点

             x_axisFigure.Segments.Add(new LineSegment(new Point(, ), false)); //第3个点

             PathFigure y_axisFigure = new PathFigure();

             y_axisFigure.IsClosed = true;

             y_axisFigure.StartPoint = new Point(, );                          //路径的起点

             y_axisFigure.Segments.Add(new LineSegment(new Point(, ), false)); //第2个点

             y_axisFigure.Segments.Add(new LineSegment(new Point(, ), false)); //第3个点

             PathGeometry x_axisGeometry = new PathGeometry();

             PathGeometry y_axisGeometry = new PathGeometry();

             x_axisGeometry.Figures.Add(x_axisFigure);

             y_axisGeometry.Figures.Add(y_axisFigure);

             x_axisArrow.Data = x_axisGeometry;

             y_axisArrow.Data = y_axisGeometry;

             this.chartCanvas.Children.Add(x_axisArrow);

             this.chartCanvas.Children.Add(y_axisArrow);

             TextBlock x_label =new TextBlock();

             TextBlock y_label =new TextBlock();

             TextBlock o_label =new TextBlock();

             x_label.Text = "月";

             y_label.Text = "元";

             o_label.Text = "";

             Canvas.SetLeft(x_label, );

             Canvas.SetLeft(y_label, );

             Canvas.SetLeft(o_label, );

             Canvas.SetTop(x_label, );

             Canvas.SetTop(y_label, );

             Canvas.SetTop(o_label, );

             x_label.FontSize = ;

             y_label.FontSize = ;

             o_label.FontSize = ;

             this.chartCanvas.Children.Add(x_label);

             this.chartCanvas.Children.Add(y_label);

             this.chartCanvas.Children.Add(o_label);

         }
标尺,X轴以45为间隔单位,Y轴以10px为单位,且没5格显示一个大标尺
         /// <summary>

         /// 作出x轴和y轴的标尺

         /// </summary>

         private void DrawScale()

         {

             for (int i = ; i < ; i++)//作12个刻度

             {

                 //原点 O=(40,320)

                 Line x_scale = new Line(); //主x轴标尺

                 x_scale.StrokeEndLineCap = PenLineCap.Triangle;

                 x_scale.StrokeThickness = ;

                 x_scale.Stroke = new SolidColorBrush(Color.FromRgb(, , ));

                 x_scale.X1 =  + i * ;

                 x_scale.X2 = x_scale.X1;

                 x_scale.Y1 = ;

                 x_scale.StrokeThickness = ;

                 x_scale.Y2 = x_scale.Y1 - ;

                 this.chartCanvas.Children.Add(x_scale);

                 Line x_in = new Line();//x轴轴辅助标尺

                 x_in.Stroke = System.Windows.Media.Brushes.LightGray;

                 x_in.StrokeThickness = 0.5;

                 x_in.X1 =  + i * ;

                 x_in.Y1 = ;

                 x_in.X2 =  + i * ;

                 x_in.Y2 = ;

                 this.chartCanvas.Children.Add(x_in);

             }

             for (int j = ; j < ; j++ )

             {

                 Line y_scale = new Line(); //主Y轴标尺

                 y_scale.StrokeEndLineCap = PenLineCap.Triangle;

                 y_scale.StrokeThickness = ;

                 y_scale.Stroke = new SolidColorBrush(Color.FromRgb(, , ));

                 y_scale.X1 = ;            //原点x=40

                 if (j %  == )

                 {

                     y_scale.StrokeThickness = ;

                     y_scale.X2 = y_scale.X1 + ;//大刻度线

                 }

                 else

                 {

                     y_scale.X2 = y_scale.X1 + ;//小刻度线

                 }

                 y_scale.Y1 =  - j * ;  //每10px作一个刻度

                 y_scale.Y2 = y_scale.Y1;

                 this.chartCanvas.Children.Add(y_scale);

             }

             for (int i = ; i < ; i++)

             {

                 Line y_in = new Line();//y轴辅助标尺

                 y_in.Stroke = System.Windows.Media.Brushes.LightGray;

                 y_in.StrokeThickness = 0.5;

                 y_in.X1 = ;

                 y_in.Y1 =  - i * ;

                 y_in.X2 = ;

                 y_in.Y2 =  - i * ;

                 this.chartCanvas.Children.Add(y_in);

             }

         }
刻度标签的话,X轴是固定的,并且其中用到了一个把阿拉伯数字转换为中文的方法 NumberToChinese(),
Y轴标尺标签,是用出入的 list<double>,计算出最大值再向上取100整,再分成五份,每份的值就是五个标签了
list最大值向上取100的方法:(除100向上取整再乘100)
Math.Ceiling(list.Max() / 100) * 100
         /// <summary>

         /// 添加刻度标签

         /// </summary>

         private void DrawScaleLabel(List<double> list)

         {

             for (int i = ; i < ; i++)

             {

                 TextBlock x_ScaleLabel = new TextBlock();

                 x_ScaleLabel.Text = NumberToChinese(i.ToString());

                 if (x_ScaleLabel.Text == "一零")

                 {

                     x_ScaleLabel.Text = "十";

                     Canvas.SetLeft(x_ScaleLabel,  +  * i - );

                 }

                 else if (x_ScaleLabel.Text == "一一")

                 {

                     x_ScaleLabel.Text = "十一";

                     Canvas.SetLeft(x_ScaleLabel,  +  * i - );

                 }

                 else if (x_ScaleLabel.Text == "一二")

                 {

                     x_ScaleLabel.Text = "十二";

                     Canvas.SetLeft(x_ScaleLabel,  +  * i - );

                 }

                 else

                 {

                     Canvas.SetLeft(x_ScaleLabel,  +  * i - );

                 }

                 Canvas.SetTop(x_ScaleLabel,  + );

                 this.chartCanvas.Children.Add(x_ScaleLabel);

             }

             for (int i = ; i < ; i++)

             {

                 TextBlock y_ScaleLabel = new TextBlock();

                 double max = Math.Ceiling(list.Max() / ) * ;

                 y_ScaleLabel.Text = (i * (max/)).ToString();

                 Canvas.SetLeft(y_ScaleLabel,  - );

                 Canvas.SetTop(y_ScaleLabel,  -  *  * i - );

                 this.chartCanvas.Children.Add(y_ScaleLabel);

             }

         }

         /// <summary>

         /// 数字转汉字

         /// </summary>

         /// <param name="numberStr"></param>

         /// <returns></returns>

         public static string NumberToChinese(string numberStr)

         {

             string numStr = "";

             string chineseStr = "零一二三四五六七八九";

             char[] c = numberStr.ToCharArray();

             for (int i = ; i < c.Length; i++)

             {

                 int index = numStr.IndexOf(c[i]);

                 if (index != -)

                     c[i] = chineseStr.ToCharArray()[index];

             }

             numStr = null;

             chineseStr = null;

             return new string(c);

         }
接下来就是计算数据点了,难点在于计算像素点,X轴是固定的,所以不用关注
直接算好的X轴十二个数值
double[] left = { 85, 130, 175, 220, 265, 310, 355, 400, 445, 490, 535, 580 };
而Y轴就要自己算了,提供一个思路:
区域总像素 - 区域总像素 * (数值/最大值)
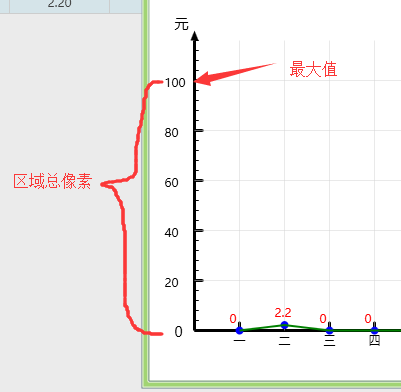
         /// <summary>

         /// 计算数据点并添加

         /// </summary>

         /// <param name="list"></param>

         private void DrawPoint(List<double> list)

         {

             double[] left = { , , , , , , , , , , ,  };

             List<double> leftlist = new List<double>();

             leftlist.AddRange(left);

             for (int i = ; i < ; i++)

             {

                 Ellipse Ellipse = new Ellipse();

                 Ellipse .Fill = new SolidColorBrush(Color.FromRgb(, , 0xff));

                 Ellipse .Width = ;

                 Ellipse .Height = ;

                 Canvas.SetLeft(Ellipse,leftlist[i-]- );

                 double y_Max = Math.Ceiling(list.Max() / ) * ;

                 Canvas.SetTop(Ellipse,  -  * (list[i-] / y_Max) - );

                 coordinatePoints.Add(new Point(leftlist[i-],  -  * (list[i-] / y_Max)));

                 this.chartCanvas.Children.Add(Ellipse);

                 //值显示

                 TextBlock EP_Label = new TextBlock();

                 EP_Label.Foreground = System.Windows.Media.Brushes.Red;

                 EP_Label.Text = list[i-].ToString();

                 Canvas.SetLeft(EP_Label, leftlist[i-] - );

                 Canvas.SetTop(EP_Label,  -  * (list[i-] / y_Max) - );

                 this.chartCanvas.Children.Add(EP_Label);

             }

         }
在绘制数据点的时候,每一次的位置都保存了: coordinatePoints.Add(new Point(leftlist[i-1], 320 - 250 * (list[i-1] / y_Max)));
先得定义:
/// <summary>

        /// 折线图坐标点

        /// </summary>

        private PointCollection coordinatePoints = new PointCollection();
最后直接连连看就好了
         /// <summary>

         /// 绘制连接折线

         /// </summary>

         private void DrawCurve()

         {

             Polyline curvePolyline = new Polyline();

             curvePolyline.Stroke = Brushes.Green;

             curvePolyline.StrokeThickness = ;

             curvePolyline.Points = coordinatePoints;

             this.chartCanvas.Children.Add(curvePolyline);

         }
由于我项目的关系,数据是从DataGrid控件行数据来的,所以每一次都不一样,只能在弹出窗体时调用这几个方法
由于每一都不一样,在窗口关闭时需要清空画布内的所有控件,否则画布内控件会一直覆盖
chartCanvas.Children.Clear();

coordinatePoints.Clear();
我的邮箱:alonezying@163.com 欢迎交流学习
WPF在Canvas中绘图实现折线统计图的更多相关文章
- WPF笔记(1.10 绘图)——Hello,WPF!
原文:WPF笔记(1.10 绘图)--Hello,WPF! 书中的代码语法过时了,改写为以下(测试通过): <Button> <Button.L ...
- 年度巨献-WPF项目开发过程中WPF小知识点汇总(原创+摘抄)
WPF中Style的使用 Styel在英文中解释为”样式“,在Web开发中,css为层叠样式表,自从.net3.0推出WPF以来,WPF也有样式一说,通过设置样式,使其WPF控件外观更加美化同时减少了 ...
- HTML5在canvas中绘制复杂形状附效果截图
HTML5在canvas中绘制复杂形状附效果截图 一.绘制复杂形状或路径 在简单的矩形不能满足需求的情况下,绘图环境提供了如下方法来绘制复杂的形状或路径. beginPath() : 开始绘制一个新路 ...
- WPF的二维绘图(一)——DrawingContext
DrawingContext比较类似WinForm中的Graphics 类,是基础的绘图对象,用于绘制各种图形,它主要API有如下几种: 绘图API 绘图API一般形为DrawingXXX系列,常用的 ...
- 讲解Canvas中的一些重要方法
Canvas所提供的各种方法根据功能来看大致可以分为几类: 第一是以drawXXX为主的绘制方法: 第二是以clipXXX为主的裁剪方法: 第三是以scale.skew.translate和rotat ...
- WPF技巧-Canvas转为位图
转自:http://www.cnblogs.com/tmywu/archive/2010/09/14/1825650.html 在WPF中我们可以将Canvas当成一种画布,将Canvas中的控件当成 ...
- 结合ItemsControl在Canvas中动态添加控件的最MVVM的方式
今天很开心的收获: ItemsControl 中 ItemsPanel的重定义和 ItemContainerStyle 以及 ItemTemplate 三者的巧妙结合,在后台代码不实例化任何控件的前提 ...
- HTML5 Canvas 2D绘图
为了防止无良网站的爬虫抓取文章,特此标识,转载请注明文章出处.LaplaceDemon/ShiJiaqi. http://www.cnblogs.com/shijiaqi1066/p/4851774. ...
- Wpf 之Canvas介绍
从这篇文章开始是对WPF中的界面如何布局做一个较简单的介绍,大家都知道:UI是做好一个软件很重要的因素,如果没有一个漂亮的UI,功能做的再好也无法吸引很多用户使用,而且没有漂亮的界面,那么普通用户会感 ...
随机推荐
- Python3.6 下 安装MySql
https://pypi.python.org/pypi/mysqlclient/1.3.10 该网页下下载 Python-3.5及上版本的扩展的mysql驱动. 下载的是一个.whl文件,下载目录为 ...
- Android为TV端助力 遥控器的映射
第一编写kl文件时先在盒子上输入getevent -v查看设备信息,设备信息里有vendor.product.version, 假如分别是xxxx,yyyy,zzzz,那么你的文件名就要命名为Vend ...
- Jump Flood Algorithms for Centroidal Voronoi Tessellation
Brief Implemented both CPU and GPU version, you could consider this as the basic playground to imple ...
- Statement和PreparedStatement的异同
1.首先两个都是java向数据库执行sql语句的对象! java代码连接数据库,并且执行sql语句的步骤如下: //1.注册数据库的驱动程序 Class.forName(driverClass); / ...
- Testlink1.9.17使用方法(第五章 测试用例管理)
第五章 测试用例管理 QQ交流群:585499566 TestLink支持的测试用例的管理包含二层:分别为新建测试用例集(Test Suites).创建测试用例(Test Cases).可以把测试用例 ...
- WPF:完美自定义MeaagseBox 动画 反弹 背景模糊 扁平化
不知道为什么,WPF的MeaageBox的风格还停留在Win 2000的风格... 很久前就想自己封装一个MessageBox出来,但是都只是简单的封装,不怎么具有通用性.这次终于搞完了. 使用方法和 ...
- POST 400 的一次遭遇
使用Springboot开发接口的过程中,使用POST接收提交的数据. @PostMapping("/input") public void inputData(@RequestB ...
- spring4笔记----spring4设值注入
2个接口 package com.ij34.servce; public interface people { public void cut(); } package com.ij34.servce ...
- web测试笔记
WEB兼容性测试 一.客户端兼容性 1.浏览器的兼容性测试 a.内核角度 Tridnt内核:代表作IE.腾讯.遨游.世界之窗等 Gecko内核:代表作Firefox webkit内核:代表作Safar ...
- vi/vim tab键空格数修改
更改Tap键单位 vi/vim编辑器默认情况下,每按一次Tap相对于8个空格. (1)临时性更改 使用vi打开文件后,输入如下命令: :set tabstop=4 命令释义:更改为相当于四个空格. ( ...