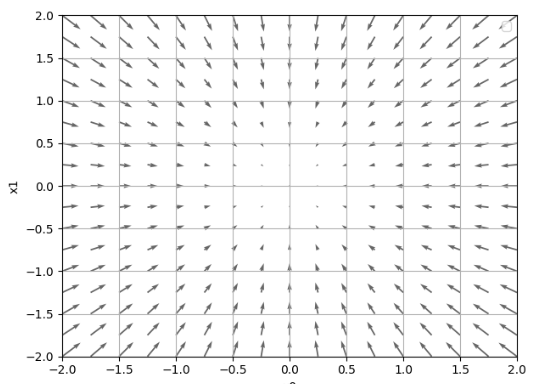
python matplotlib quiver——画箭头、风场
理解参考:https://blog.csdn.net/liuchengzimozigreat/article/details/84566650
以下实例
import numpy as np

import matplotlib.pyplot as plt

def function(x):

    return np.sum(x**2)#return x[0]**2 + x[1]**2

def _numerical_gradient_no_batch(f,x):

    h = 1e-4

    grad = np.zeros_like(x)

    for idx in range(x.size):

        tmp_va1 = x[idx]

        x[idx] = float(tmp_va1) + h

        fxh1 =f(x)

        x[idx] = tmp_va1 -h

        fxh2 = f(x)

        grad[idx] = (fxh1- fxh2)/(2*h)

        x[idx] = tmp_va1

    print("grad:"+str(grad))

    return grad

def numerical_gradient(f,X):

    if X.ndim == 1:

        return _numerical_gradient_no_batch(f,X)

    else:

        grad = np.zeros_like(X)

        for idx,x in enumerate(X):

            grad[idx] = _numerical_gradient_no_batch(f,x)

        return grad

def function_2(x):

    if x.ndim == 1:

        return np.sum(x **2)

    else:

        return np.sum(x**2,axis=1)

def tangent_line(f,x):

    d = numerical_gradient(f,x)

    print(d)

    y = f(x) - d * x

    return lambda t : d * t + y

print(_numerical_gradient_no_batch(function_2,np.array([3.0,4.0])))

print(numerical_gradient(function_2,np.array([3.0,4.0])))

print(numerical_gradient(function_2,np.array([[3.0,4.0],[0.0,2.0],[3.0,0.0]])))

if __name__ =='__main__':

    x0= np.arange(-2,2.5,0.25)

    x1=np.arange(-2,2.5,0.25)

    X,Y= np.meshgrid(x0,x1)

    X = X.flatten()

    Y = Y.flatten()

    grad = numerical_gradient(function_2,np.array([X,Y]))

    plt.figure()

    plt.quiver(X,Y,-grad[0],-grad[1],angles="xy",color="#666666")

    plt.xlim([-2,2])

    plt.ylim([-2,2])

    plt.xlabel('x0')

    plt.ylabel('x1')

    plt.grid()

    plt.legend()

    plt.draw()

    plt.show()
python matplotlib quiver——画箭头、风场的更多相关文章
- Python matplotlib pylab 画张图
from pylab import * w1 = 1 w2 = 25 fs = 18 y = np.arange(-2,2,0.001) x = w1*y*log(y)-1.0/w2*exp(-(w2 ...
- Python - matplotlib 数据可视化
在许多实际问题中,经常要对给出的数据进行可视化,便于观察. 今天专门针对Python中的数据可视化模块--matplotlib这块内容系统的整理,方便查找使用. 本文来自于对<利用python进 ...
- 转:使用 python Matplotlib 库 绘图 及 相关问题
使用 python Matplotlib 库绘图 转:http://blog.csdn.net/daniel_ustc/article/details/9714163 Matplotlib ...
- 安装python Matplotlib 库
转:使用 python Matplotlib 库 绘图 及 相关问题 使用 python Matplotlib 库绘图 转:http://blog.csdn.net/daniel_ustc ...
- 在matlab 画箭头
[转载]在matlab 画箭头 原文地址:在matlab 画箭头作者:纯情小郎君 完整见链接http://www.mathworks.com/matlabcentral/fx_files/14056/ ...
- python matplotlib 中文显示参数设置
python matplotlib 中文显示参数设置 方法一:每次编写代码时进行参数设置 #coding:utf-8import matplotlib.pyplot as pltplt.rcParam ...
- python matplotlib plot 数据中的中文无法正常显示的解决办法
转发自:http://blog.csdn.net/laoyaotask/article/details/22117745?utm_source=tuicool python matplotlib pl ...
- python matplotlib画图产生的Type 3 fonts字体没有嵌入问题
ScholarOne's 对python matplotlib画图产生的Type 3 fonts字体不兼容,更改措施: 在程序中添加如下语句 import matplotlib matplotlib. ...
- 菱形实现气泡Bubble,菱形画箭头,菱形画三角形
菱形实现气泡Bubble,菱形画箭头,菱形画三角形 >>>>>>>>>>>>>>>>>>&g ...
随机推荐
- elixir mac环境
1.升级brew brew update 2.安装 erlang brew install erlang 3.安装Elixir: brew install elixir 终端 iex iex> ...
- Spring Boot--02MVC设置
package com.smartmap.sample.ch1.conf; import java.util.List; import javax.servlet.http.HttpServletRe ...
- FineReport中如何用JavaScript自定义地图标签
在日常使用地图过程中,通常会遇到地图标签,提示点等显示不满足我们的需求,需要进行JavaScript代码编写. 例如:在使用地图过程中,会发现很多地名显示的位置偏离.这时候就需要使用JavaScrip ...
- Office - Excel 2013
1. 在使用TODAY()时需要注意格式,比如,如果系统区域是中国,那么格式为2015/7/28,如果在单元格中设置了其它格式(比如美国格式 3/24/2015),则可能无法比较: 2. $表示cel ...
- Android 通过URL获取网络资源
1.先在AndroidManifest.xml中注册加入访问因特网服务的权限: <uses-permission android:name="android.permission.IN ...
- maven 项目目录图与web 应用结构图对比
web应用结构图 -war | | | |++++META-INF | | |----WEB-INF | | |-classes | | |com/baidu/controller/Controlle ...
- CCSUOJ评测系统——第二次scrum冲刺
1.小组成员 舒 溢 许嘉荣 唐 浩 黄欣欣 廖帅元 2.第二次冲刺任务安排 对HUSTOJ数据库进行分析 序号 表名 作用 备注 1 compileinfo 记录编译错误的记录 2 contest ...
- LeetCode题解之Rotate Array
1.题目描述 2.代码 void rotate(vector<int>& nums, int k) { ) return ; && (k / nums.size() ...
- Grunt-学习。
Grunt 依赖 Node.js 所以在安装之前确保你安装了 Node.js.然后开始安装 Grunt 实际上,安装的并不是 Grunt,而是 Grunt-cli,也就是命令行的 Grunt,这样你就 ...
- 指令-Directive
restrict:'A'用作设定用那种方式使用指令. 可组合使用如restrict:'AE' E - 元素名称: <my-directive></my-directive> A ...