基于python、jupyter-notebook 的金融领域用户交易行为分析
说明:本文重在说明交易数据统计、分析方法,所有数据均为生成的数据
时间原因代码未定义成函数
统计指标:1.用户单日交易行为数据
2.按小时为计算单位,统计用户行为数据(旨在求得一天24小时中每个小时的交易金额、交易量和后再做统计计算)
获取数据代码如下:
 #!/usr/bin/env python

 # -*- coding: utf-8 -*-

 __author__ = 'zqf'

 import pymysql

 import random

 import time

 from conf import test_conf

 con = pymysql.connect(**test_conf.con_set)

 print("连接成功")

 cur = con.cursor()

 time_start = time.time()

 for i in range(1, 100000):

     phone_random = random.randint(10000000000, 19999999999)

     transaction_amount_random = random.uniform(0, 50000)

     transaction_type_random = random.randint(1, 5)

     # sql = "select * from my_database.transcation_info"

     sql = "insert into my_database.transaction_info(user_id, name, phone, transaction_amount, transaction_type, " \

           "transaction_time) values('%d', 'name%d', '%d', '%d', '%d', '2019-05-%d %d:%d:%d')" % \

           (random.randint(1, 1000), random.randint(1, 1000), phone_random, transaction_amount_random,

            transaction_type_random, random.randint(1, 31), random.randint(0, 23), random.randint(0, 59),

            random.randint(0, 59))

     cur.execute(sql)

 print("execute完毕即将提交")

 try:

     con.commit()

     print("提交成功")

 except Exception:

     print("插入失败")

     con.rollback()

 time_stop = time.time()

 take_time = time_stop - time_start

 print("花费时间:", take_time)

 # print(cur.fetchall())
在juoyter-notebook中
导入所需包
# 导入所需包
import pandas as pd

import pymysql

from datetime import datetime

import time

from matplotlib import pyplot as plt

plt.rcParams['font.family'] = ['sans-serif']

plt.rcParams['font.sans-serif'] = ['SimHei']

# from conf import test_conf
连接sql数据库
 # 连接数据库

 con = pymysql.connect(**{

     'database': 'my_database',

     'host': '192.168.**.**',

     'port': 3306,

     'user': 'root',

     'password': '********',

     'charset': 'utf8'

 })

 print("连接成功")

 cur = con.cursor()

 sql = "select * from transaction_info"

 time_start = time.time()

 df = pd.read_sql(sql=sql, con=con)

 time_stop = time.time()

 take_time = time_stop - time_start

 print("读取十万条数据花费时间:", take_time)

 # print(df)
连接成功

读取十万条数据花费时间: 4.09512186050415
# 用户每天每小时最大交易金额

df_groupby_hour = df.groupby(['user_id', df['transaction_time'].apply(lambda item: datetime.strftime(item, '%Y-%m-%d %H'))])
# 计算每天每小时交易金额最大值, 最小值, 平均值, 交易次数, 交易金额总计
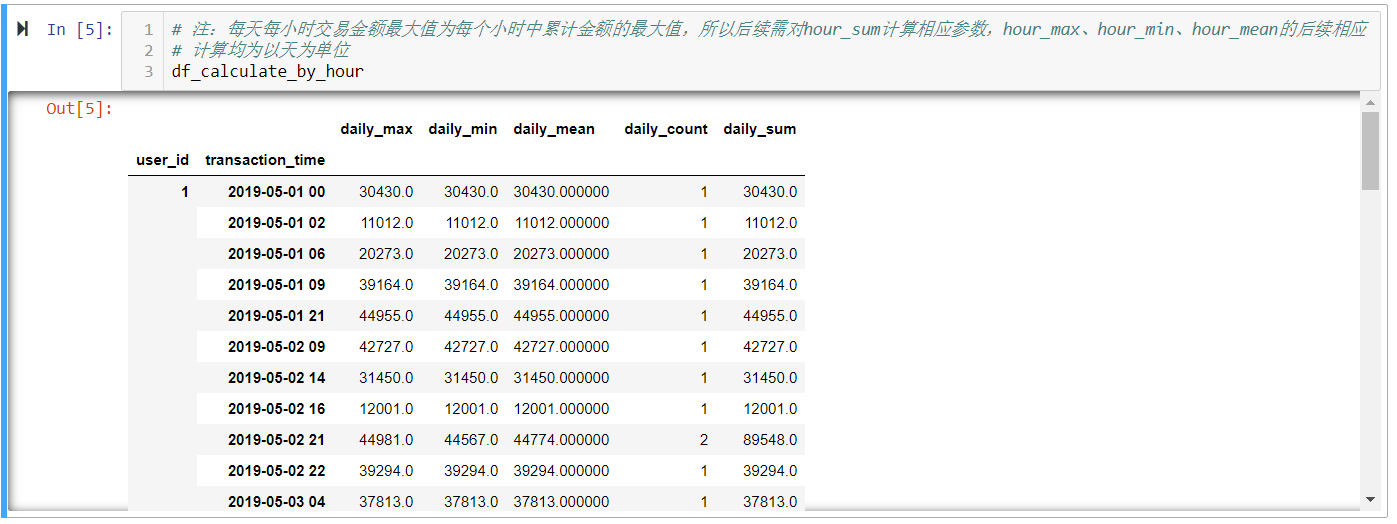
df_calculate_by_hour = df_groupby_hour['transaction_amount'].agg([["daily_max", "max"], ["daily_min", "min"], ["daily_mean", "mean"], ["daily_count", "count"], ["daily_sum", "sum"]])
# 注:每天每小时交易金额最大值为每个小时中累计金额的最大值,所以后续需对hour_sum计算相应参数,hour_max、hour_min、hour_mean的后续相应

# 计算均为以天为单位

df_calculate_by_hour
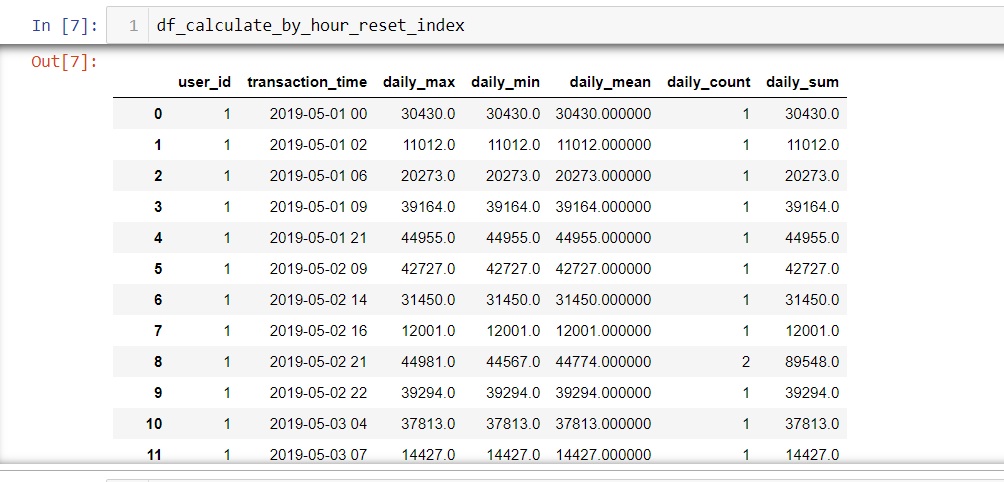
# 将user_id, transaction_time层索引设置成列索引

df_calculate_by_hour_reset_index = df_calculate_by_hour.reset_index()

df_calculate_by_hour_reset_index
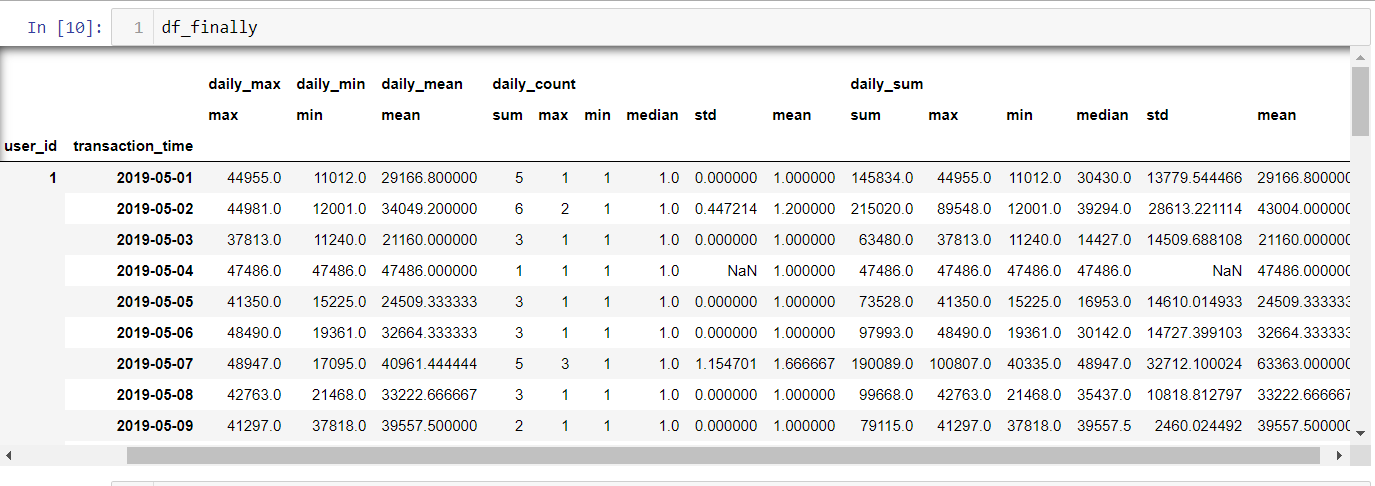
# 再根据user_id、transaction_time 分组,到天

df_calculate_by_hour_reset_index_regroup = df_calculate_by_hour_reset_index.groupby(['user_id', df_calculate_by_hour_reset_index['transaction_time'].apply(lambda item: datetime.strftime(pd.to_datetime(item), '%Y-%m-%d'))])
# 聚合计算

df_finally = df_calculate_by_hour_reset_index_regroup.agg({'daily_max':['max'], 'daily_min':['min'], 'daily_mean':['mean'], 'daily_count':['sum', 'max', 'min', 'median', 'std', 'mean'], 'daily_sum':['sum', 'max', 'min', 'median', 'std', 'mean']})
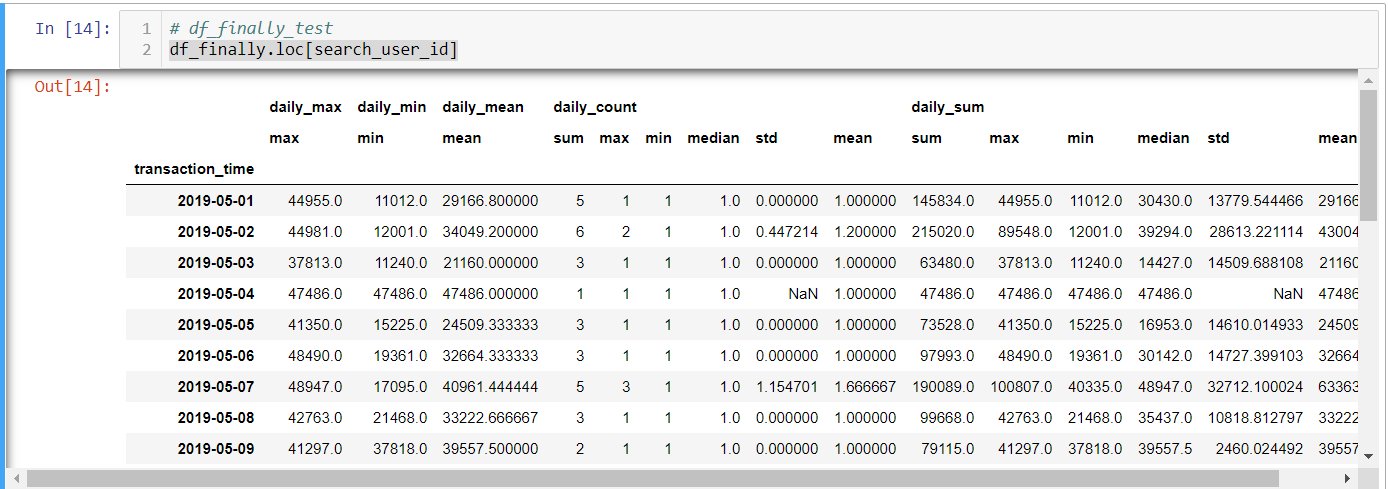
# 获取用户交易信息

search_user_id = 1

get_user_message = df_finally.loc[search_user_id]

# 将user_id, transaction_time层索引设置成列索引

df_finally_reset = df_finally.reset_index()

df_finally.loc[search_user_id]
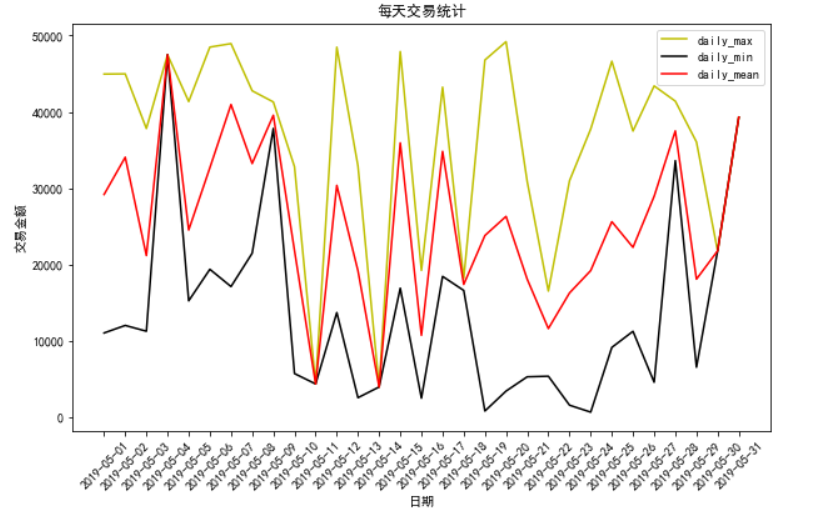
# 绘制每天参数图

plt.figure(figsize=(10, 6))

plt.xticks(rotation=45)

x = df_finally.loc[search_user_id].index

li_daily = df_finally.columns.levels[0][:-2]

colors = ['y', 'k', 'r']

for index, i in enumerate(li_daily):

    plt.plot(x, df_finally.loc[search_user_id][i][df_finally[i].columns[0]], label=f"{i}", color=colors[index])

plt.title("每天交易统计")

plt.xlabel("日期")

plt.ylabel("交易金额")

plt.legend()

plt.show()
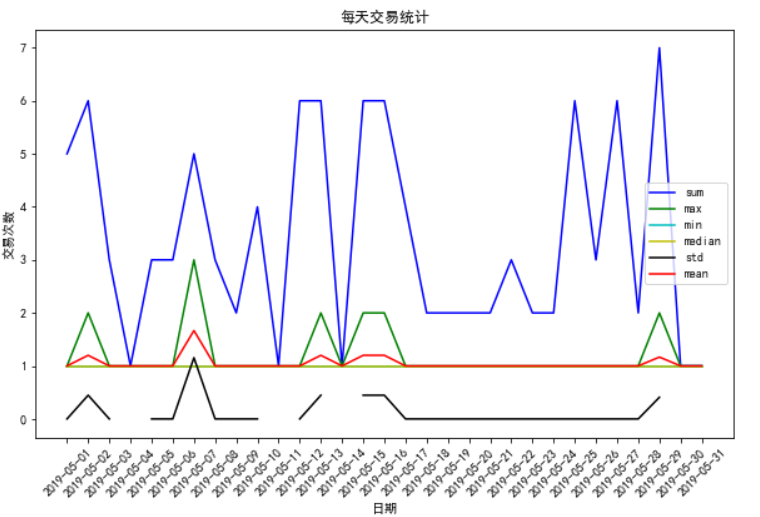
# 绘制交易量交易图

plt.figure(figsize=(10, 6))

plt.xticks(rotation=45)

daily_count_str = df_finally.columns.levels[0][3]

li_counts = df_finally[daily_count_str].columns

x = df_finally.loc[search_user_id].index

df_finally.columns.levels[0][3]

colors = ['b', 'g', 'c', 'y', 'k', 'r']

for index, i in enumerate(li_counts):

    plt.plot(x, df_finally.loc[search_user_id][daily_count_str][i], label=f"{i}", color=colors[index])

plt.title("每天交易统计")

plt.xlabel("日期")

plt.ylabel("交易次数")

plt.legend()

plt.show()
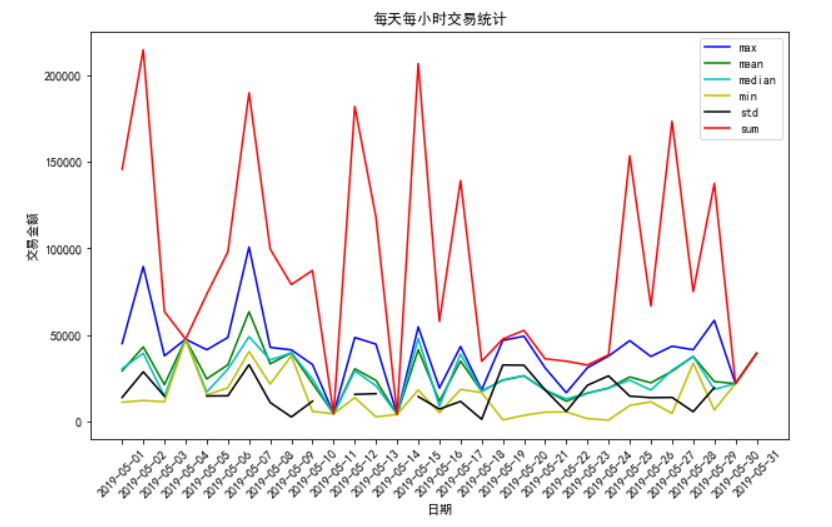
# 绘制每天每小时交易图

plt.rcParams['font.family'] = ['sans-serif']

plt.rcParams['font.sans-serif'] = ['SimHei']

plt.figure(figsize=(10, 6))

plt.xticks(rotation=45)

x = df_finally.loc[search_user_id].index

li_daily_hour = df_finally.columns.levels[1]

daily_sum_str = df_finally.columns.levels[0][4]

colors = ['b', 'g', 'c', 'y', 'k', 'r']

for index, i in enumerate(li_daily_hour):

    plt.plot(x, df_finally.loc[search_user_id][daily_sum_str][i], label=f"{i}", color=colors[index])

plt.title("每天每小时交易统计")

plt.xlabel("日期")

plt.ylabel("交易金额")

plt.legend()

plt.show()
基于python、jupyter-notebook 的金融领域用户交易行为分析的更多相关文章
- Python,Jupyter Notebook,IPython快速安装教程
0.安装环境 Windows10,Python3.5.1,IPython,jupyter notebook,and other functionality 官方安装文档Linux版3.x 官方安装文档 ...
- [python] [Jupyter Notebook]
最近又要用notebook 转一篇我原来写的安装教程 还是很好用的. IPython是一个 Python 的一个交互式 shell,它提供了很多内建的函数.Jupyter Notebook是IPyt ...
- 教你用Python Jupyter Notebook 制作代码分享 PPT
PPT 是个强大的工具,但是笔者的 PPT 制作技术不咋地,所以之前的分享习惯使用 Jupyter Notebook + RISE,这样使用简单的 markdown 格式加上代码就足够做一次代码分享了 ...
- Python/Jupyter Notebook以及可视化的运用
最近陆陆续续使用Jupyter Notebook和Python可视化做了一些小工具,用于提高开发效率. 这里将其归类总结一下,作为学习的记录.
- Python·Jupyter Notebook各种使用方法
PythonJupyter Notebook各种使用方法记录持续更新 一 Jupyter NoteBook的安装 1 新版本Anaconda自带Jupyter 2 老版本Anacodna需自己安装Ju ...
- MAC安装python jupyter notebook
介绍: Jupyter Notebook(此前被称为 IPython notebook)是一个交互式笔记本,支持运行 40 多种编程语言. Jupyter Notebook 的本质是一个 Web 应用 ...
- Python·Jupyter Notebook各种使用方法记录
标签(空格分隔): Python 一 Jupyter NoteBook的安装 1 新版本Anaconda自带Jupyter 2 老版本Anacodna需自己安装Jupyter 二 更改Jupyter ...
- [Mac][Python][Jupyter Notebook]安装配置和使用
Jupyter 项目(以前称为 IPython 项目),提供了一套使用功能强大的交互式 shell 进行科学计算的工具,实现了将代码执行与创建实时计算文档相结合. 这些 Notebook 文件可以包含 ...
- 基于Python项目的Redis缓存消耗内存数据简单分析(附详细操作步骤)
目录 1 准备工作 2 具体实施 1 准备工作 什么是Redis? Redis:一个高性能的key-value数据库.支持数据的持久化,可以将内存中的数据保存在磁盘中,重启的时候可以再次加载进行使 ...
随机推荐
- MySQL:MySQL安装
ylbtech-MySQL:MySQL安装 mysql5.5.27_win64_zol.msi 1.返回顶部 1. 2. 3. 4. 5. 6. 7. 8. 9. 10. 11. 12. 13. 14 ...
- java用户角色权限设计
实现业务系统中的用户权限管理 B/S系统中的权限比C/S中的更显的重要,C/S系统因为具有特殊的客户端,所以访问用户的权限检测可以通过客户端实现或通过客户端+服务器检测实现,而B/S中,浏览器是每一台 ...
- 引水入城 2010年NOIP全国联赛提高组(bfs+贪心)
1066 引水入城 2010年NOIP全国联赛提高组 时间限制: 1 s 空间限制: 128000 KB 题目等级 : 钻石 Diamond 题目描述 Description 在一个遥远 ...
- 服务器出现 nginx 502 Bad Gateway
发生原因1.PHP FastCGI进程数不够用 当网站并发访问巨大时,php fastcgi的进程数不有一定的保障,因为cgi是单线程多进程工作的,也就是说cgi需要处理完一个页面后再继续下一个页面. ...
- spring Cache /Redis 缓存 + Spring 的集成示例
spring Cache https://www.ibm.com/developerworks/cn/opensource/os-cn-spring-cache/ spring+redis 缓存 ht ...
- [Usaco2011 Jan]道路和航线
Description Farmer John正在一个新的销售区域对他的牛奶销售方案进行调查.他想把牛奶送到T个城镇 (1 <= T <= 25,000),编号为1T.这些城镇之间通过R条 ...
- Troubleshooting Guide for ORA-12541 TNS: No Listener
Server side checks (not platform specific): 1) Check the result on the server using tnsping to the ...
- C#手机充值系统开发(基于聚合数据)
说是手机充值系统有点装了,其实就是调用了聚合数据的支付接口,其实挺简单的事 但是我发现博客园竟然没有类似文章,我就个出头鸟把我的代码贡献出来吧 首先说准备工作: 去聚合数据申请账号-添加手机支付的认证 ...
- Spring.Net学习笔记(3)-创建对象
一.开发环境 编译器:VS2013 .Net版本:.net framework4.5 二.涉及程序集 Spring.Core.dll:1.3 Common.Logging 三.开发过程 1.项目结构 ...
- NodeJs学习记录(一)初步学习,杂乱备忘
2016/12/26 星期一 1.在win7下安装了NodeJs 1)进入官网 https://nodejs.org/en/download/,下载对应的安装包,我目前下载的是node-v6.2.0- ...