python应用-matplotlib绘图
详细内容参看:官网
测试数据:
# 传入的参数

x=[1,2,3,4,5]

squares=[1,4,9,16,25]
简单的绘图
import matplotlib.pyplot as plt

def plot1(x,squares):

    """plot simple pic"""

    plt.plot(x,squares,linewidth=1)

    # or plt.plot(squares)

    plt.show()
- plt.plot(x,y)
- plt.show()
改变文字、字体、线宽
def plot2(x,squares):

    """change literature and line width"""

    plt.plot(x,squares,linewidth=2)

    plt.title("Literatures",fontsize=24)

    plt.xlabel("xlabel",fontsize=14)

    plt.ylabel("ylabel",fontsize=14)

    # set labelsize of x, y

    plt.tick_params(axis='both',labelsize=14)

    plt.show()
- plt.title("title")
- plt.xlabel('xlabel')
- plt.ylabel('ylabel')
- plt.tick_params(axis,labelsize)
自动生成数据
def plot3():

    """automatically compute the data"""

    x_val = list(range(1,1001))

    y_val = [x**2 for x in x_val]

    plt.scatter(x_val,y_val,s=5)

    plt.title("Literatures",fontsize=24)

    plt.xlabel("xlabel",fontsize=14)

    plt.ylabel("ylabel",fontsize=14)

    # set labelsize of x, y

    plt.tick_params(axis='both',labelsize=14)

    plt.axis([0,1100,0,1100000])

    plt.show()
- plt.axis([0,1100,0,110000])
- plt.scatter(x,y,s)
颜色改变(很漂亮)
def plot4():

    """change the color"""

    x_val = list(range(1,1001))

    y_val = [x**2 for x in x_val]

    # delete the default edgecolor(black)

    # change color by adjusting c

    plt.scatter(x_val,y_val,edgecolor='none',c=(0.5,0.6,0.3),s=5)

    plt.title("Literatures",fontsize=24)

    plt.xlabel("xlabel",fontsize=14)

    plt.ylabel("ylabel",fontsize=14)

    # set labelsize of x, y

    plt.tick_params(axis='both',labelsize=14)

    plt.axis([0,1100,0,1100000])

    plt.show()
- plt.scatter(x,y,edgecolor='none',c,s)
- c用来调节颜色
- s代表size
def plot5():

    """using colormap"""

    x_val = list(range(1,1001))

    y_val = [x**2 for x in x_val]

    # delete the default edgecolor(black)

    # using cmap to make gradient

    plt.scatter(x_val,y_val,edgecolor='none',c=y_val,s=5,cmap=plt.cm.Blues)

    plt.title("Literatures",fontsize=24)

    plt.xlabel("xlabel",fontsize=14)

    plt.ylabel("ylabel",fontsize=14)

    # set labelsize of x, y

    plt.tick_params(axis='both',labelsize=14)

    plt.axis([0,1100,0,1100000])

    plt.show()
- plt.scatter(x,y,edgecolor,c,s,cmap)
- cmap颜色映射
- plt.cm.Blues
- plt.cm.Reds
- plt.cm.Greens
- plt.cm.Paired
- plt.cm.binary
- plt.cm.seismic
- cmap颜色映射
保存图片
def plot6():
"""using colormap"""
x_val = list(range(1,1001))
y_val = [x**2 for x in x_val]
# delete the default edgecolor(black)
# using cmap to make gradient
# cmap(plt.cm.*) Blues Reds Greens Paired binary seismic
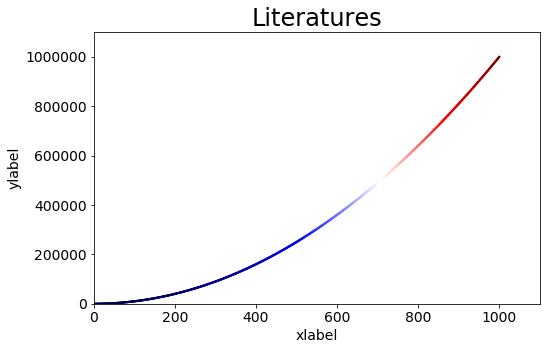
plt.scatter(x_val,y_val,edgecolor='none',c=y_val,s=5,cmap=plt.cm.seismic)
plt.title("Literatures",fontsize=24)
plt.xlabel("xlabel",fontsize=14)
plt.ylabel("ylabel",fontsize=14)
# set labelsize of x, y
plt.tick_params(axis='both',labelsize=14)
plt.axis([0,1100,0,1100000])
# do not show, save it
plt.savefig('save.png',bbox_inches='tight')
- plt.savefig('name.jpg',bbox_inches)
- 一般bbox_inches='tight'比较好
python应用-matplotlib绘图的更多相关文章
- python 中matplotlib 绘图
python 中matplotlib 绘图 数学建模需要,对于绘图进行简单学习 matpoltlib之类的包安装建议之间用anaconda 绘制一条y=x^2的曲线 #比如我们要绘制一条y=x^2的曲 ...
- python之matplotlib绘图基础
Python之matplotlib基础 matplotlib是Python优秀的数据可视化第三方库 matplotlib库的效果可参考 http://matplotlib.org/gallery.ht ...
- python基于matplotlib绘图
import math import numpy as np import matplotlib.pyplot as plt from matplotlib.font_manager import F ...
- python中matplotlib绘图封装类之折线图、条状图、圆饼图
DrawHelper.py封装类源码: import matplotlib import matplotlib.pyplot as plt import numpy as np class DrawH ...
- Python用matplotlib绘图网格线的设置
一.X轴网格线的设置 import matplotlib.pyplot as plt import numpy as np from pylab import mpl mpl.rcParams['fo ...
- python中利用matplotlib绘图可视化知识归纳
python中利用matplotlib绘图可视化知识归纳: (1)matplotlib图标正常显示中文 import matplotlib.pyplot as plt plt.rcParams['fo ...
- python 利用matplotlib中imshow()函数绘图
matplotlib 是python最著名的2D绘图库,它提供了一整套和matlab相似的命令API,十分适合交互式地进行制图.而且也可以方便地将它作为绘图控件,嵌入GUI应用程序中.通过简单的绘图语 ...
- python实战学习之matplotlib绘图
matplotlib 是最流行的Python底层绘图库,主要做数据可视化图表 可以将数据可视化,能够更直观的呈现数据 matplotlib绘图基本要点 首先实现一个简单的绘图 # 导入pyplot f ...
- python强大的绘图模块matplotlib示例讲解
Matplotlib 是 Python 的绘图库.作为程序员,经常需要进行绘图,在我自己的工作中,如果需要绘图,一般都是将数据导入到excel中,然后通过excel生成图表,这样操作起来还是比较繁琐的 ...
随机推荐
- IPMI相关漏洞利用及WEB端默认口令登录漏洞
IPMI相关漏洞 0套件漏洞 使用0套件时,只需要Username,口令任意即可绕过身份鉴别执行指令.而且一般还有一个默认的账户admin或者ADMIN. 备注:IPMI是一套主机远程管理系统,可以远 ...
- Android搜索自动提示功能 AutocompleteTextView
1.配置main.xml中自动提示控件: <AutoCompleteTextView android:id="@+id/autotv_searchresult" androi ...
- jdbc将数据库连接信息放置配置文件中
目录如下: jdbcConnection.java: package jdbc01; import java.io.InputStream; import java.sql.Connection; i ...
- 三维凸包求重心到面的最短距离(HDU4273)
http://acm.hdu.edu.cn/showproblem.php?pid=4273 Rescue Time Limit: 2000/1000 MS (Java/Others) Memo ...
- 最小树形图(hdu4009)
Transfer water Time Limit: 5000/3000 MS (Java/Others) Memory Limit: 65768/65768 K (Java/Others) T ...
- postgresql----继承表INHERITS PARENT TABLE
使用INHERITS创建的新表会继承一个或多个父表,子表只会继承父表的表结构和NOT NULL,DEFAULT,CHECK三种约束,主键,外键和唯一键以及索引不会被继承,所以修改父表的结构(增删字段) ...
- aliyun oss 文件上传 java.net.SocketTimeoutException Read timed out 问题分析及解决
upload ClientException Read timed out com.aliyun.openservices.ClientException: Read timed out ...
- Oracle等待事件之Latch Free
1.产生原因 表示某个锁存器上发生了竞争.首先应该确保已经提供了足够多的Latch 数,如果仍然发生这种等待事件,那么应该进一步确定是那种锁存器上发生了竞争(在v$session_wait 上的P2 ...
- collectionView itemW宽度计算不对
([[UIScreen mainScreen] bounds].size.width - 28) / 4.00 没加括号 collectioView不能正常撑开 用flowLayout 不要用 代理方 ...
- 模仿Masonary写一个计算器
1.CaculatorMaker @interface CaculatorMaker : NSObject @property(nonatomic,assign)int result; -(Cacul ...