Matplotlib风羽自定义
【前言】对于气象专业的小学生来说,风场是预报重要的参考数据,我们所知的风羽有四种:短线代表风速2m/s,长线代表风速4m/s,空心三角代表风速20m/s,实心三角代表风速50m/s。而matplotlib的风羽只有短线、长线、三角三种,而这里的三角不分空心实心,但是可通过改变风羽颜色为白色使三角变为空心形状,虽然这三种可以自定义各自代表的风速,但是仍与我们的使用习惯不符,即使把三角设成20m/s,原本一个实心三角就能表示的50m/s的风在matplotlib中需要两个三角外加两条长线一条短线。为了迎合预报员的需求,我在研究了matplotlib的风场函数barbs()的源代码quiver.py文件后,对quiver.py做了适当的调整,使得matplotlib也有了空心三角和实心三角之分。
一、函数barbs的使用
barb(X, Y, U, V,, **kw)
X:风场数据X坐标
Y:风场数据Y坐标
U:风的水平方向分量
V:风的垂直方向分量
'''

Demonstration of wind barb plots

'''

import matplotlib.pyplot as plt

import numpy as np

x = np.linspace(-5, 5, 5)

X, Y = np.meshgrid(x, x)

U, V = 12*X, 12*Y

data = [(-1.5, .5, -6, -6),(1, -1, -46, 46),(-3, -1, 11, -11),(1, 1.5, 80, 80),(0.5, 0.25, 25, 15),(-1.5, -0.5, -5, 40)]

data = np.array(data, dtype=[('x', np.float32), ('y', np.float32), ('u', np.float32), ('v', np.float32)])

# Default parameters, uniform grid

ax = plt.subplot(2, 2, 1)

ax.barbs(X, Y, U, V)

# Arbitrary set of vectors, make them longer and change the pivot point

#(point around which they're rotated) to be the middle

ax = plt.subplot(2, 2, 2)

ax.barbs(data['x'], data['y'], data['u'], data['v'], length=8, pivot='middle')

# Showing colormapping with uniform grid. Fill the circle for an empty barb,

# don't round the values, and change some of the size parameters

ax = plt.subplot(2, 2, 3)

ax.barbs(X, Y, U, V, np.sqrt(U*U + V*V), fill_empty=True, rounding=False,sizes=dict(emptybarb=0.25, spacing=0.2, height=0.3))

# Change colors as well as the increments for parts of the barbs

ax = plt.subplot(2, 2, 4)

ax.barbs(data['x'], data['y'], data['u'], data['v'], flagcolor='r',barbcolor=['b', 'g'], barb_increments=dict(half=10, full=20, flag=100),flip_barb=True)

plt.show()

二、源代码解读
1.class Barbs()
class Barbs(mcollections.PolyCollection):

   @docstring.interpd

   def __init__(self, ax, *args, **kw):

        '...'

   def _find_tails(self, mag, rounding=True, half=5, full=10, flag=50):

        '...'

   def _make_barbs(self, u, v, nflags, nbarbs, half_barb, empty_flag, length,pivot, sizes, fill_empty, flip):

        '...'

   def set_UVC(self, U, V, C=None):

        '...'

   def set_offsets(self, xy):

        '...'
- 通过读源代码可知类Barbs有五个方法分别为
__init__、_find_tails、_make_barbs、set_UVC、set_offsets。
2.__init__
    @docstring.interpd

    def __init__(self, ax, *args, **kw):

        """

        The constructor takes one required argument, an Axes

        instance, followed by the args and kwargs described

        by the following pylab interface documentation:

        %(barbs_doc)s

        """

        self._pivot = kw.pop('pivot', 'tip')

        self._length = kw.pop('length', 7)

        barbcolor = kw.pop('barbcolor', None)

        flagcolor = kw.pop('flagcolor', None)

        self.sizes = kw.pop('sizes', dict())

        self.fill_empty = kw.pop('fill_empty', False)

        self.barb_increments = kw.pop('barb_increments', dict())

        self.rounding = kw.pop('rounding', True)

        self.flip = kw.pop('flip_barb', False)

        transform = kw.pop('transform', ax.transData)

        # Flagcolor and and barbcolor provide convenience parameters for

        # setting the facecolor and edgecolor, respectively, of the barb

        # polygon.  We also work here to make the flag the same color as the

        # rest of the barb by default

        if None in (barbcolor, flagcolor):

            kw['edgecolors'] = 'face'

            if flagcolor:

                kw['facecolors'] = flagcolor

            elif barbcolor:

                kw['facecolors'] = barbcolor

            else:

                # Set to facecolor passed in or default to black

                kw.setdefault('facecolors', 'k')

        else:

            kw['edgecolors'] = barbcolor

            kw['facecolors'] = flagcolor

        # Parse out the data arrays from the various configurations supported

        x, y, u, v, c = _parse_args(*args)

        self.x = x

        self.y = y

        xy = np.hstack((x[:, np.newaxis], y[:, np.newaxis]))

        # Make a collection

        barb_size = self._length ** 2 / 4  # Empirically determined

        mcollections.PolyCollection.__init__(self, [], (barb_size,),

                                             offsets=xy,

                                             transOffset=transform, **kw)

        self.set_transform(transforms.IdentityTransform())

        self.set_UVC(u, v, c)
__init__()方法为初始化方法,此方法中flagcolor、barbcolor为设置风羽颜色的关键字,中间的说明文字提示颜色设置是针对所有的风羽的,所以通过颜色设置达不到风羽中既有空心白色三角又有实心黑色三角。初始化方法中在对一些参数进行了初始化赋值后执行了set_UVC()方法,所以我们顺着这个set_UVC()方法往下继续读。
3.set_UVC()
    def set_UVC(self, U, V, C=None):

        self.u = ma.masked_invalid(U, copy=False).ravel()

        self.v = ma.masked_invalid(V, copy=False).ravel()

        if C is not None:

            c = ma.masked_invalid(C, copy=False).ravel()

            x, y, u, v, c = delete_masked_points(self.x.ravel(),

                                                 self.y.ravel(),

                                                 self.u, self.v, c)

        else:

            x, y, u, v = delete_masked_points(self.x.ravel(), self.y.ravel(),

                                              self.u, self.v)

        magnitude = np.hypot(u, v)

        flags, emptyflags,barbs, halves, empty = self._find_tails(magnitude,

                                                       self.rounding,

                                                       **self.barb_increments)

        # Get the vertices for each of the barbs

        plot_barbs = self._make_barbs(u, v, flags, emptyflags,barbs, halves, empty,

                                      self._length, self._pivot, self.sizes,

                                      self.fill_empty, self.flip)

        self.set_verts(plot_barbs)

        # Set the color array

        if C is not None:

            self.set_array(c)

        # Update the offsets in case the masked data changed

        xy = np.hstack((x[:, np.newaxis], y[:, np.newaxis]))

        self._offsets = xy

        self.stale = True
- 在此方法中,首先进行了变量的命名赋值,然后依次执行了方法
_find_tails和_make_barbs。_make_barbs的输入为_find_tails的输出,_find_tails的输入中有一个为magnitude = np.hypot(u, v),np.hypot()为勾股定理方法,因此可知magnitude为风速。
4._find_tails
    def _find_tails(self, mag, rounding=True, half=5, full=10, flag=50):

        '''

        Find how many of each of the tail pieces is necessary.  Flag

        specifies the increment for a flag, barb for a full barb, and half for

        half a barb. Mag should be the magnitude of a vector (i.e., >= 0).

        This returns a tuple of:

            (*number of flags*, *number of barbs*, *half_flag*, *empty_flag*)

        *half_flag* is a boolean whether half of a barb is needed,

        since there should only ever be one half on a given

        barb. *empty_flag* flag is an array of flags to easily tell if

        a barb is empty (too low to plot any barbs/flags.

        '''

        # If rounding, round to the nearest multiple of half, the smallest

        # increment

        if rounding:

            mag = half * (mag / half + 0.5).astype(np.int)

        num_flags = np.floor(mag / flag).astype(np.int)

        mag = np.mod(mag, flag)

        num_barb = np.floor(mag / full).astype(np.int)

        mag = np.mod(mag, full)

        half_flag = mag >= half

        empty_flag = ~(half_flag | (num_flags > 0) | (num_emptyflags > 0) |(num_barb > 0))

        return num_flags,num_barb, half_flag, empty_flag
- 通过读此方法的说明文档可知,此方法作用为根据输入的风速、设置的短线长线三角的数值计算并返回三角、长线、短线的个数以及有没有无风的情况。
5._make_barbs
    def _make_barbs(self, u, v, nflags, nbarbs, half_barb, empty_flag, length,

                    pivot, sizes, fill_empty, flip):

        '''

        This function actually creates the wind barbs.  *u* and *v*

        are components of the vector in the *x* and *y* directions,

        respectively.

        *nflags*, *nbarbs*, and *half_barb*, empty_flag* are,

        *respectively, the number of flags, number of barbs, flag for

        *half a barb, and flag for empty barb, ostensibly obtained

        *from :meth:`_find_tails`.

        *length* is the length of the barb staff in points.

        *pivot* specifies the point on the barb around which the

        entire barb should be rotated.  Right now, valid options are

        'head' and 'middle'.

        *sizes* is a dictionary of coefficients specifying the ratio

        of a given feature to the length of the barb. These features

        include:

            - *spacing*: space between features (flags, full/half

               barbs)

            - *height*: distance from shaft of top of a flag or full

               barb

            - *width* - width of a flag, twice the width of a full barb

            - *emptybarb* - radius of the circle used for low

               magnitudes

        *fill_empty* specifies whether the circle representing an

        empty barb should be filled or not (this changes the drawing

        of the polygon).

        *flip* is a flag indicating whether the features should be flipped to

        the other side of the barb (useful for winds in the southern

        hemisphere.

        This function returns list of arrays of vertices, defining a polygon

        for each of the wind barbs.  These polygons have been rotated to

        properly align with the vector direction.

        '''

        # These control the spacing and size of barb elements relative to the

        # length of the shaft

        spacing = length * sizes.get('spacing', 0.125)

        full_height = length * sizes.get('height', 0.4)

        full_width = length * sizes.get('width', 0.25)

        empty_rad = length * sizes.get('emptybarb', 0.15)

        # Controls y point where to pivot the barb.

        pivot_points = dict(tip=0.0, middle=-length / 2.)

        # Check for flip

        if flip:

            full_height = -full_height

        endx = 0.0

        endy = pivot_points[pivot.lower()]

        # Get the appropriate angle for the vector components.  The offset is

        # due to the way the barb is initially drawn, going down the y-axis.

        # This makes sense in a meteorological mode of thinking since there 0

        # degrees corresponds to north (the y-axis traditionally)

        angles = -(ma.arctan2(v, u) + np.pi / 2)

        # Used for low magnitude.  We just get the vertices, so if we make it

        # out here, it can be reused.  The center set here should put the

        # center of the circle at the location(offset), rather than at the

        # same point as the barb pivot; this seems more sensible.

        circ = CirclePolygon((0, 0), radius=empty_rad).get_verts()

        if fill_empty:

            empty_barb = circ

        else:

            # If we don't want the empty one filled, we make a degenerate

            # polygon that wraps back over itself

            empty_barb = np.concatenate((circ, circ[::-1]))

        barb_list = []

        for index, angle in np.ndenumerate(angles):

            # If the vector magnitude is too weak to draw anything, plot an

            # empty circle instead

            if empty_flag[index]:

                # We can skip the transform since the circle has no preferred

                # orientation

                barb_list.append(empty_barb)

                continue

            poly_verts = [(endx, endy)]

            offset = length

            # Add vertices for each flag

            for i in range(nflags[index]):

                # The spacing that works for the barbs is a little to much for

                # the flags, but this only occurs when we have more than 1

                # flag.

                if offset != length:

                    offset += spacing / 2.

                poly_verts.extend(

                    [[endx, endy + offset],

                     [endx + full_height, endy - full_width / 2 + offset],

                     [endx, endy - full_width + offset]])

                offset -= full_width + spacing

            # Add vertices for each barb.  These really are lines, but works

            # great adding 3 vertices that basically pull the polygon out and

            # back down the line

            for i in range(nbarbs[index]):

                poly_verts.extend(

                    [(endx, endy + offset),

                     (endx + full_height, endy + offset + full_width / 2),

                     (endx, endy + offset)])

                offset -= spacing

            # Add the vertices for half a barb, if needed

            if half_barb[index]:

                # If the half barb is the first on the staff, traditionally it

                # is offset from the end to make it easy to distinguish from a

                # barb with a full one

                if offset == length:

                    poly_verts.append((endx, endy + offset))

                    offset -= 1.5 * spacing

                poly_verts.extend(

                    [(endx, endy + offset),

                     (endx + full_height / 2, endy + offset + full_width / 4),

                     (endx, endy + offset)])

            # Rotate the barb according the angle. Making the barb first and

            # then rotating it made the math for drawing the barb really easy.

            # Also, the transform framework makes doing the rotation simple.

            poly_verts = transforms.Affine2D().rotate(-angle).transform(

                poly_verts)

            barb_list.append(poly_verts)

        return barb_list
- 通过读此方法的说明文档可知,此方法作用为根据输入的风数据以及短线长线三角的个数绘制风羽风向杆。
- 绘制过程为:判断地图坐标点是不是无风,如果无风就绘制一个空心圆圈代表。如果有风就开始按照三角、长线、短线的顺序绘制。
- 绘制方法为:
- 创建一个用于存储关键点坐标的列表
poly_verts - 计算关键点坐标
- 通过
transform方法将关键点坐标列表中的各个关键点依次用黑线连接起来,最终将风羽风向杆绘制出来
- 此方法的几个关键变量:
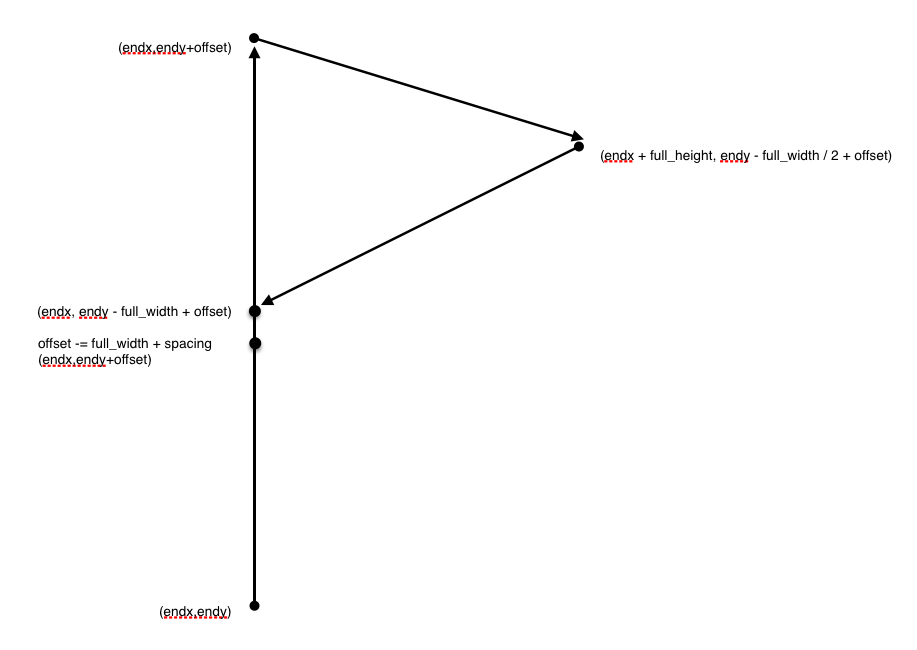
spacing:风羽上短线长线以及三角间的距离full_height:三角的高度full_width:三角的宽度endx:风羽绘制的起始点x坐标endy:风羽绘制的起始点y坐标angles:风向杆角度poly_verts:绘制风羽风向杆的关键点列表offset:绘制完一个三角或线后下一个三角或线的关键起始坐标
            poly_verts = [(endx, endy)]

            offset = length

            # Add vertices for each flag

            for i in range(nflags[index]):

                # The spacing that works for the barbs is a little to much for

                # the flags, but this only occurs when we have more than 1

                # flag.

                if offset != length:

                    offset += spacing / 2.

                poly_verts.extend(

                    [[endx, endy + offset],

                     [endx + full_height, endy - full_width / 2 + offset],

                     [endx, endy - full_width + offset]])

                offset -= full_width + spacing
- 这一段是绘制风羽的主要代码,利用图片的形式说明
三、绘制空心实心三角
在了解了风羽的绘制过程后,发现可以通过增加关键点直接绘制实心三角,通过原绘制方法绘制空心三角。
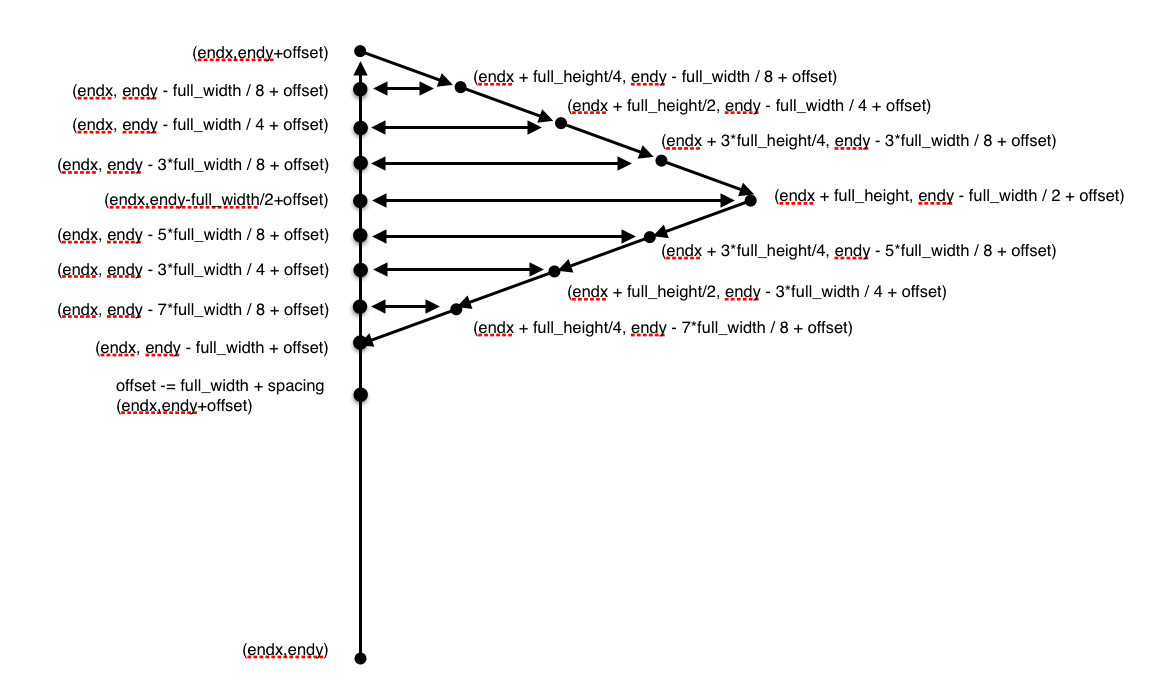
1.实心三角绘制
- 实心三角绘制代码
            # Add vertices for each flag

            for i in range(nflags[index]):

                # The spacing that works for the barbs is a little to much for

                # the flags, but this only occurs when we have more than 1

                # flag.

                if offset != length:

                    offset += spacing / 2.

                poly_verts.extend(

                    [[endx, endy + offset],

                     [endx + full_height/4, endy - full_width / 8 + offset],

                     [endx, endy - full_width / 8 + offset],

                     [endx + full_height/4, endy - full_width / 8 + offset],

                     [endx + full_height/2, endy - full_width / 4 + offset],

                     [endx, endy - full_width / 4 + offset],

                     [endx + full_height/2, endy - full_width / 4 + offset],

                     [endx + 3*full_height/4, endy - 3*full_width / 8 + offset],

                     [endx, endy - 3*full_width / 8 + offset],

                     [endx + 3*full_height/4, endy - 3*full_width / 8 + offset],

                     [endx + full_height, endy - full_width / 2 + offset],

                     [endx,endy-full_width/2+offset],

                     [endx + full_height, endy - full_width / 2 + offset],

                     [endx + 3*full_height/4, endy - 5*full_width / 8 + offset],

                     [endx, endy - 5*full_width / 8 + offset],

                     [endx + 3*full_height/4, endy - 5*full_width / 8 + offset],

                     [endx + full_height/2, endy - 3*full_width / 4 + offset],

                     [endx, endy - 3*full_width / 4 + offset],

                     [endx + full_height/2, endy - 3*full_width / 4 + offset],

                     [endx + full_height/4, endy - 7*full_width / 8 + offset],

                     [endx, endy - 7*full_width / 8 + offset],

                     [endx + full_height/4, endy - 7*full_width / 8 + offset],

                     [endx, endy - full_width + offset]])

                offset -= full_width + spacing
实心三角绘制示意图
方法参数中加入nfullflags
def _make_barbs(self, u, v, nfullflags, nflags,nbarbs, half_barb, empty_flag, length,pivot, sizes, fill_empty, flip):

    '...'
2.实心三角个数计算
    def _find_tails(self, mag, rounding=True, half=2, full=4, flag=20,fullflag=50):

        '''

        Find how many of each of the tail pieces is necessary.  Flag

        specifies the increment for a flag, barb for a full barb, and half for

        half a barb. Mag should be the magnitude of a vector (i.e., >= 0).

        This returns a tuple of:

            (*number of flags*, *number of barbs*, *half_flag*, *empty_flag*)

        *half_flag* is a boolean whether half of a barb is needed,

        since there should only ever be one half on a given

        barb. *empty_flag* flag is an array of flags to easily tell if

        a barb is empty (too low to plot any barbs/flags.

        '''

        # If rounding, round to the nearest multiple of half, the smallest

        # increment

        if rounding:

            mag = half * (mag / half + 0.5).astype(np.int)

        num_fullflags = np.floor(mag / fullflag).astype(np.int)

        mag = np.mod(mag, fullflag)

        num_flags = np.floor(mag / flag).astype(np.int)

        mag = np.mod(mag, flag)

        num_barb = np.floor(mag / full).astype(np.int)

        mag = np.mod(mag, full)

        half_flag = mag >= half

        empty_flag = ~(half_flag | (num_flags > 0) | (num_fullflags > 0) |(num_barb > 0))

        return num_fullflags,num_flags,num_barb, half_flag, empty_flag
3. 调整set_UVC中相关方法使用
        fullflags, flags,barbs, halves, empty = self._find_tails(magnitude,

                                                       self.rounding,

                                                       **self.barb_increments)

        # Get the vertices for each of the barbs

        plot_barbs = self._make_barbs(u, v, fullflags, flags,barbs, halves, empty,

                                      self._length, self._pivot, self.sizes,

                                      self.fill_empty, self.flip)
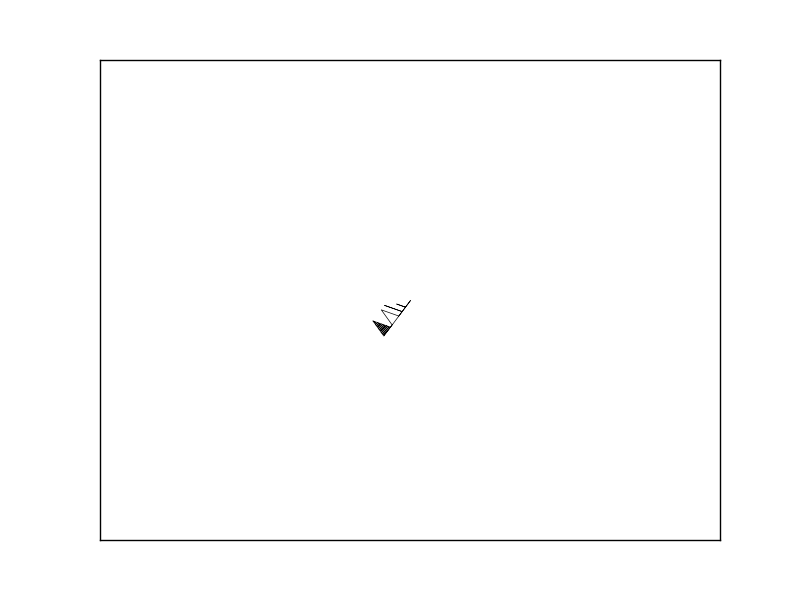
四、测试
import matplotlib.pyplot as plt

fig=plt.figure()

ax=fig.add_subplot(111);

ax.axis([-1,1,-1,1])

ax.set_xticks([])

ax.set_yticks([])

ax.barbs(0,0,30*1.5,40*1.5,length=8,linewidth=0.5)

plt.show()
五、总结
通过本次实践一方面解决了自己实际问题,另一方面锻炼了自己阅读代码的能力,是一次很重要的学习过程,为我的Python之路打下坚实基础。
本文版权归作者和博客园共有,欢迎转载,但未经作者同意必须保留此段声明,且在文章页面明显位置给出原文连接,否则保留追究法律责任的权利。
想观看Matplotlib教学视频,了解更多Matplotlib实用技巧可关注
微信公众账号: MatplotlibClass

今日头条号:Matplotlib小讲堂

Matplotlib风羽自定义的更多相关文章
- Python自学笔记——Matplotlib风羽自定义
[前言]对于气象专业的小学生来说,风场是预报重要的参考数据,我们所知的风羽有四种:短线代表风速2m/s,长线代表风速4m/s,空心三角代表风速20m/s,实心三角代表风速50m/s.而matplotl ...
- 【Python数据分析】四级成绩分布 -matplotlib,xlrd 应用
最近获得了一些四级成绩数据,大概500多个,于是突发奇想是否能够看看这些成绩数据是否满足所谓的正态分布呢?说干就干,于是有了这篇文章.文章顺带介绍了xlrd模块的一些用法和matplotlib画自定义 ...
- 如何美化 Matplotlib 的工具栏和绘图风格
前言 matplotlib 功能十分强大,就是工具栏丑了点.忍了一个学期之后,还是决定自己动手,魔改一波 matplotlib 的工具栏样式.同时给大家分享一下自己按照 MATLAB 写的 matpl ...
- Python面试题_初级版
1.如何在一个函数内部修改全局变量 a=5 def fn(): a=4 fn() print(a) # 5 #在一个函数内部修改全局变量 a=5 def fn(): global a a=4 fn() ...
- 利用Python快速绘制海报级别地图
1 简介 基于Python中诸如matplotlib等功能丰富.自由度极高的绘图库,我们可以完成各种极富艺术感的可视化作品,关于这一点我在系列文章在模仿中精进数据可视化中已经带大家学习过很多案例了. ...
- 自定义 matplotlib 设置
Customizing plots with style sheets import matplotlib as mpl 查看配置文件所在的目录:mpl.get_configdir() 1. 自定义 ...
- 数据可视化基础专题(十):Matplotlib 基础(二) 自定义配置文件和绘图风格(rcParams和style)
https://matplotlib.org/api/rcsetup_api.html#module-matplotlib.rcsetup 一.什么是rcParams?我们在使用matplotlibl ...
- matplotlib工具栏源码探析三(添加、删除自定义工具项)
转: matplotlib工具栏源码探析三(添加.删除自定义工具项) matplotlib工具栏源码探析二(添加.删除内置工具项)探讨了工具栏内置工具项的管理,除了内置工具项,很多场景中需要自定义工具 ...
- matplotlib basic and boxplot
============================================matplotlib 绘图基础========================================= ...
随机推荐
- python数据分析的工具环境
python做数据分析的优势: 拥有大量的库为数据分析和处理提供了完整的工具链 随着库还在不断的增加的同时, 算法的实现也更加的创新.Numpy, matplotlib, scipy,scikit-l ...
- 网易公开课[一万分钟]《office办公达人养成计划》
note: Shift表示移动 Ctrl表示复制 Excel: 快速选中单元格: 选中表格左上角Ctrl+A Ctrl+方向键,跳到行或列的尽头 Ctrl+Shift+方向键,选中一行或一列 Shif ...
- JMeter的__threadGroupName使用注意事项
JMeter从4.1版本开始引入了一个新函数"${__threadGroupName}",这个函数的作用是返回当前线程组的名字.${__threadGroupName}的用途也较为 ...
- java并发之线程池的使用
背景 当系统并发的线程数量很多,并且每个线程都是执行一个时间很短的任务就结束了,这样频繁创建线程就会大大降低系统的效率,因为频繁创建线程和销毁线程需要消耗大量的系统资源. 所以需要一个办法使得线程可以 ...
- jmeter线程组介绍
Jmeter中的测试计划是一直有的,但可以在右侧修改名字,要开始做具体测试设计前,都需要在测试计划下边添加一个线程组,添加路径为鼠标捕获测试计划后,点击鼠标右键->添加->Threads( ...
- 【snaptype nexus】搭建maven私服仓库
搭建本地开发私库,旨在解决本地开始受限于网络环境的问题:具体的搭建步骤主要包含以下几个步骤: 1.私服服务器使用的是ubuntu,首先下载安装包(版本号:2.12),下载地址:http://www.s ...
- Codeforces70 | Codeforces Beta Round #64 | 瞎讲报告
目录 前言 正文 A B C D E 前言 这个毒瘤的517 放了Div1 然后D题是昨天讲的动态凸包(啊喂!我还没来的及去写 结果自己想的是二分凸包 (当然没有写出来 写完前两题之后就愉快地弃疗 C ...
- python3去除字符串中括号及括号里面的内容
a = """ <option value="search-alias=arts-crafts-intl-ship">Arts & ...
- printf命令详解
基础命令学习目录首页 本文是Linux Shell系列教程的第(八)篇,更多shell教程请看:Linux Shell系列教程 在上一篇:Linux Shell系列教程之(七)Shell输出这篇文章中 ...
- bootstrap中的data-toggle模态框相关
一,点击即打开1,点击按钮 <a href="javascript:void(0)" class="btn btn-primary" data-toggl ...