prometheus+grafana监控Linux和kubernetes的例子
1.安装和配置prometheus
tar zxvf prometheus-2.3..linux-amd64.tar.gz -C /usr/local/

ln -sv /usr/local/prometheus-2.3..linux-amd64/ /usr/local/prometheus

cd /usr/local/prometheus

[root@do1cloud03 prometheus]# cat prometheus.yml |egrep -v '#'

global:

alerting:

  alertmanagers:

  - static_configs:

    - targets:

rule_files:

scrape_configs:

  - job_name: linux

    static_configs:

      - targets: ['192.168.1.46:9100']

        labels:

          instance: db1

  - job_name: node45

    static_configs:

      - targets: ['192.168.1.45:9100']

        labels:

          instance: node45

/data/prometheus-2.3.0.linux-amd64/prometheus --config.file=/data/prometheus-2.3.0.linux-amd64/prometheus.yml --web.listen-address=10.253.124.27:9090
2.安装node-exporter
tar -zxvf node_exporter-0.16..linux-arm64.tar.gz

mv node_exporter-0.16..linux-amd64 /usr/local/node_exporter

./node_exporter --web.listen-address="10.253.124.7:50002" &
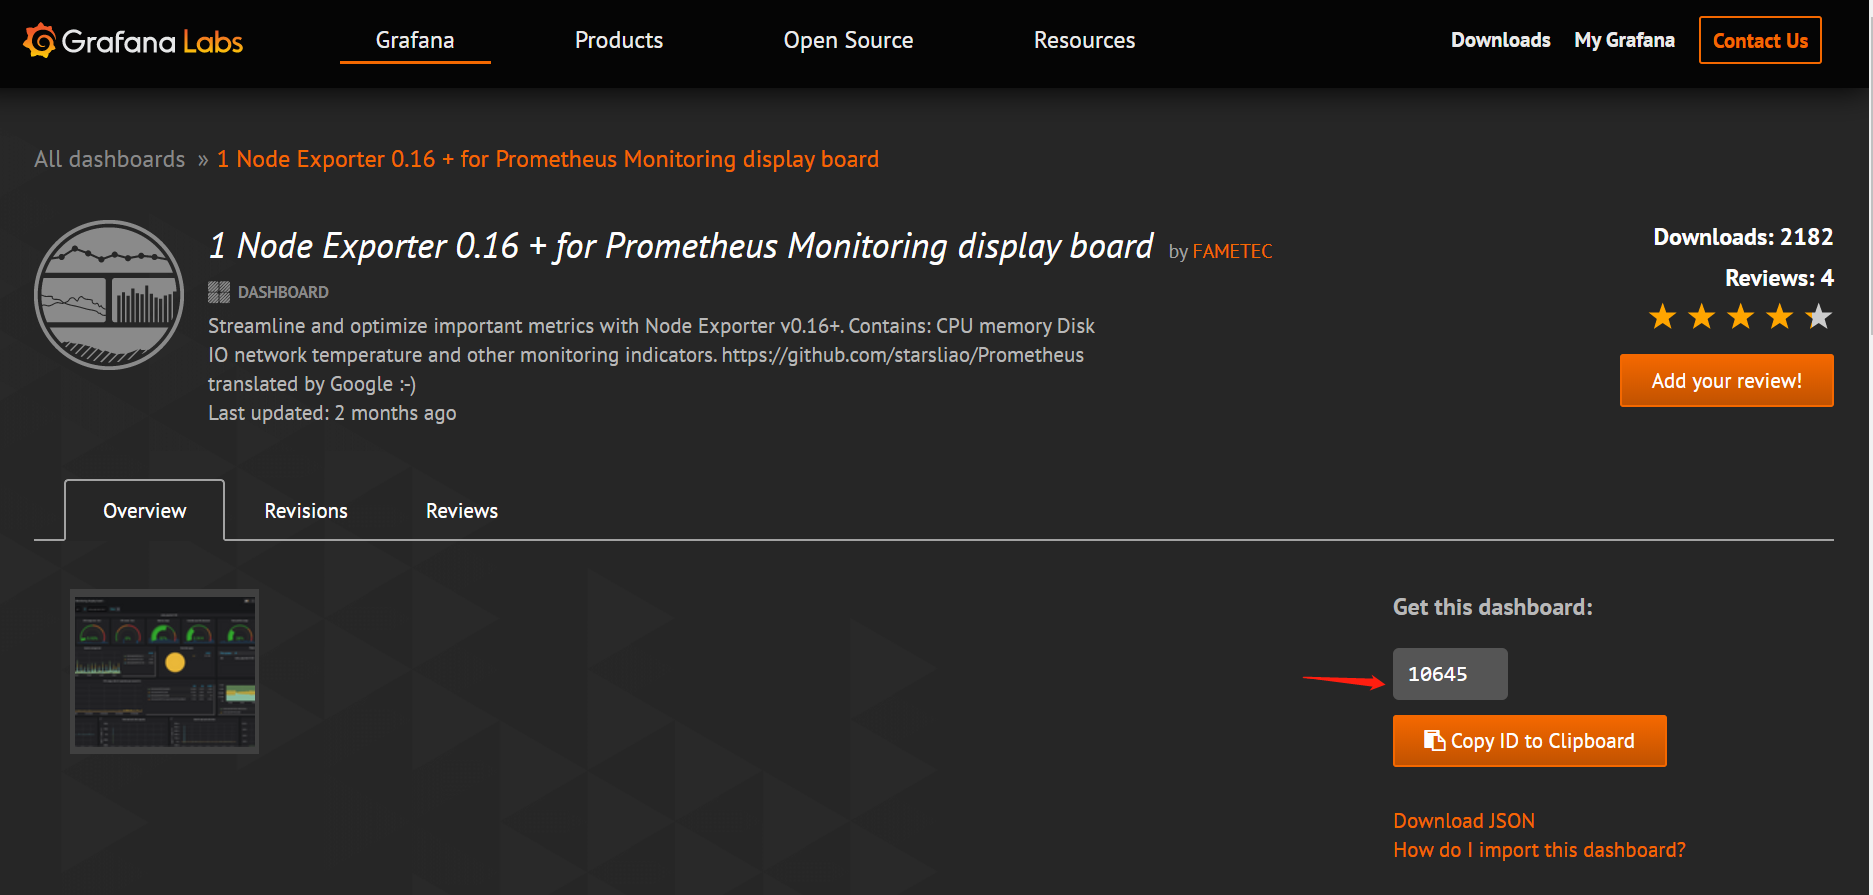
3.去官网下载node-exporter-1.6.0对应的dashboard
https://grafana.com/grafana/dashboards
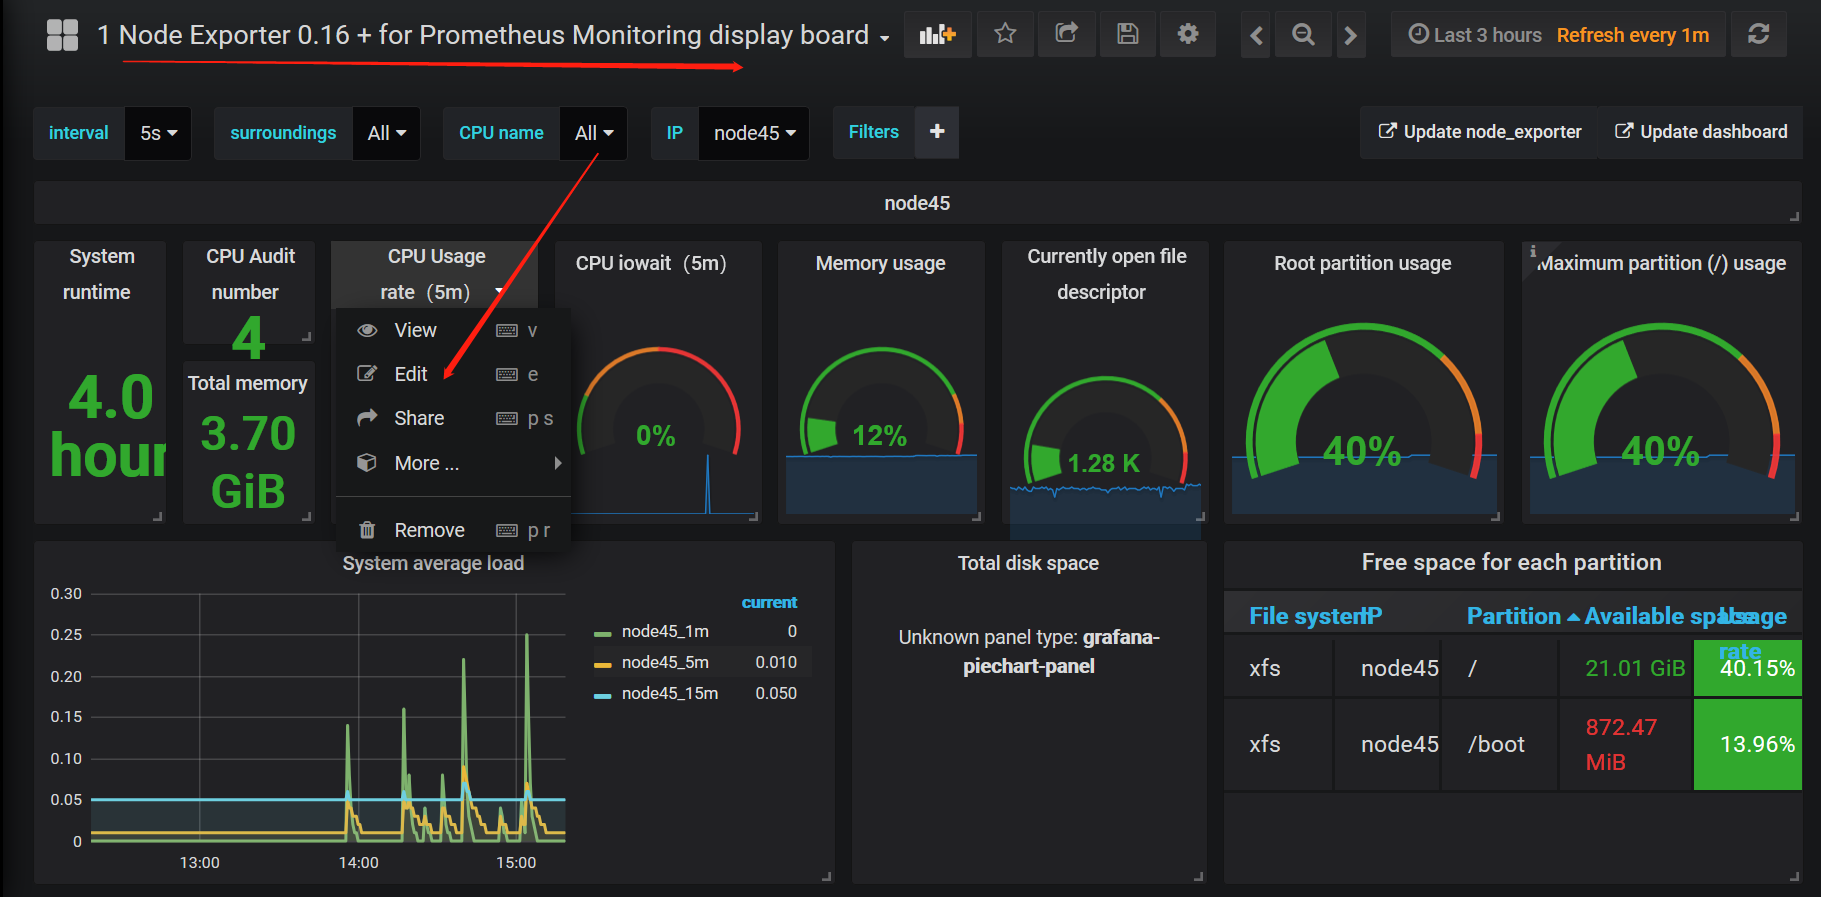
4.去dashboard设置
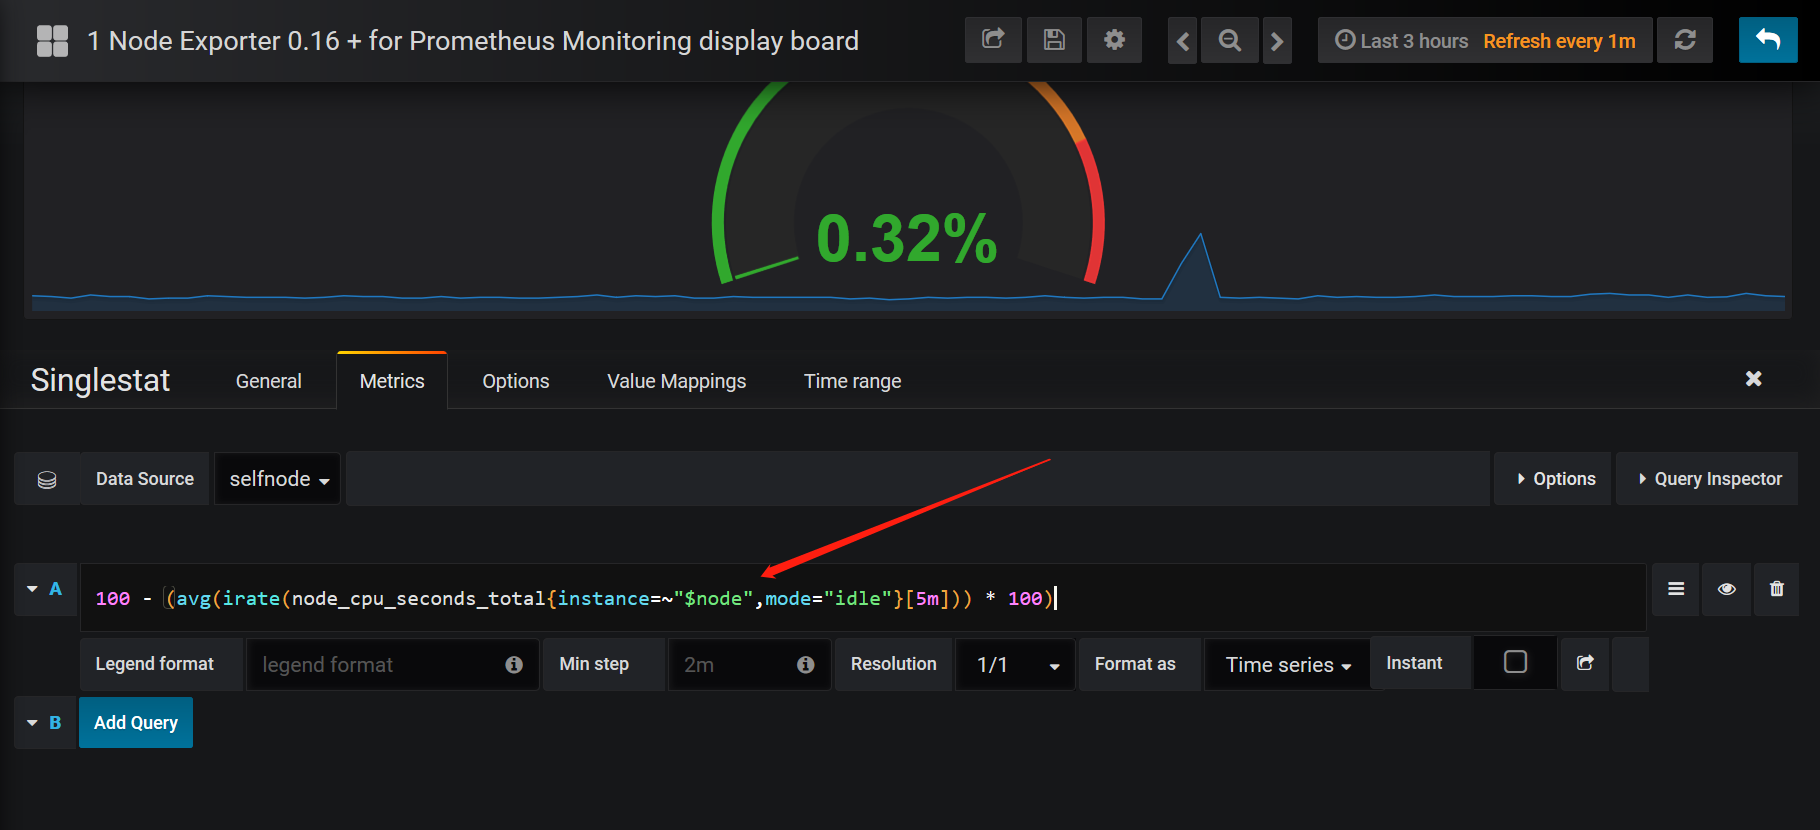
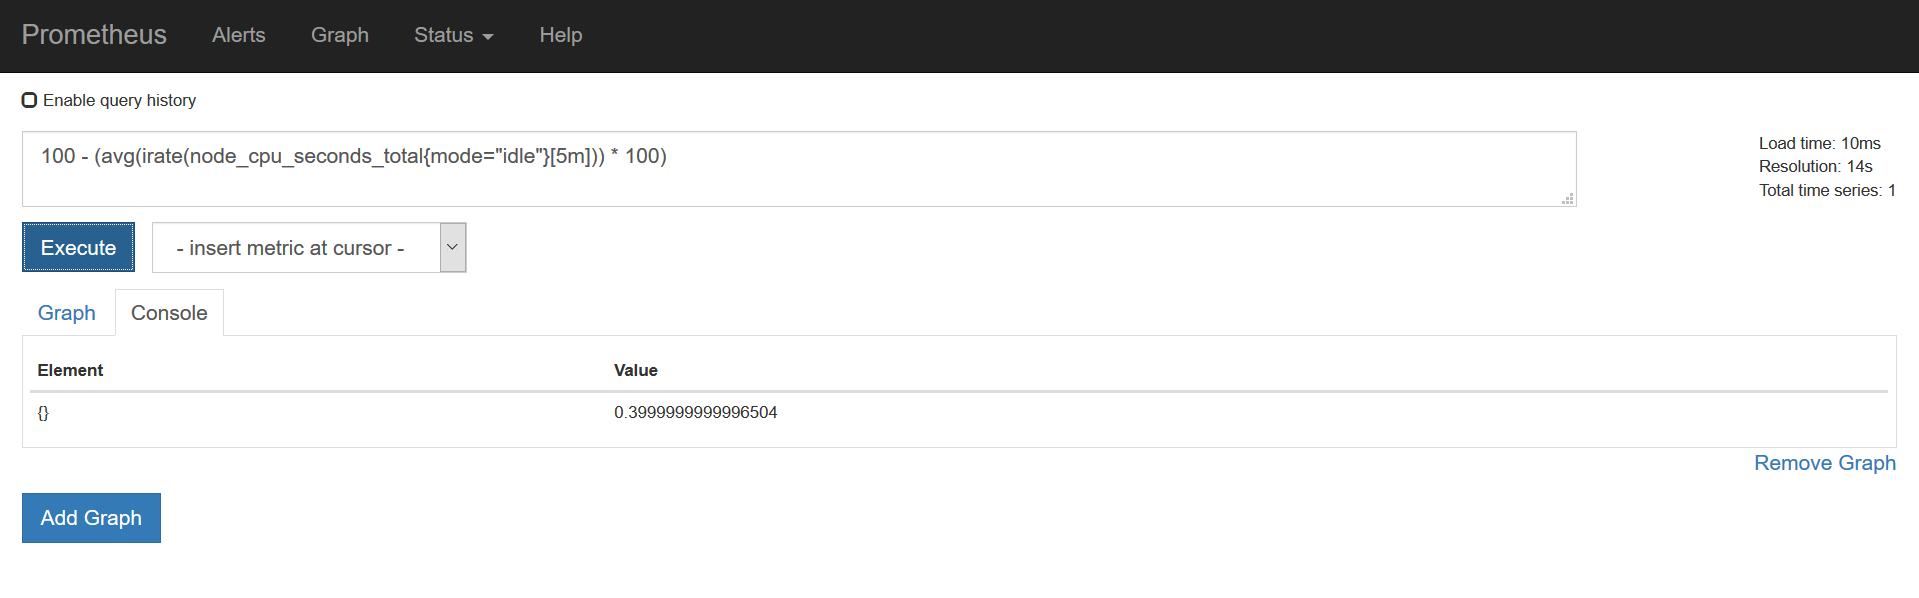
5.排错思路:在这里获取到prom sql,去Prometheus的graph查询
对于已经存储的历史数据,Prometheus提供了PromQL语言进行查询,并自带了一个简易的UI界面,可以在界面上进行查询、绘图、查看配置、告警等等。
需要学习简单的PromQL语言,在grafana里面根据业务自定义dashboard
prometheus+grafana监控Linux和kubernetes的例子的更多相关文章
- [转帖]安装prometheus+grafana监控mysql redis kubernetes等
安装prometheus+grafana监控mysql redis kubernetes等 https://www.cnblogs.com/sfnz/p/6566951.html plug 的模式进行 ...
- 安装prometheus+grafana监控mysql redis kubernetes等
1.prometheus安装 wget https://github.com/prometheus/prometheus/releases/download/v1.5.2/prometheus-1.5 ...
- Prometheus + Grafana 监控系统搭
本文主要介绍基于Prometheus + Grafana 监控Linux服务器. 一.Prometheus 概述(略) 与其他监控系统对比 1 Prometheus vs. Zabbix Zabbix ...
- [转帖]Prometheus+Grafana监控Kubernetes
原博客的位置: https://blog.csdn.net/shenhonglei1234/article/details/80503353 感谢原作者 这里记录一下自己试验过程中遇到的问题: . 自 ...
- Prometheus+Grafana监控Kubernetes
涉及文件下载地址:链接:https://pan.baidu.com/s/18XHK7ex_J0rzTtfW-QA2eA 密码:0qn6 文件中需要下载的镜像需要自己提前下载好,eg:prom/node ...
- 【Springboot】用Prometheus+Grafana监控Springboot应用
1 简介 项目越做越发觉得,任何一个系统上线,运维监控都太重要了.关于Springboot微服务的监控,之前写过[Springboot]用Springboot Admin监控你的微服务应用,这个方案可 ...
- 部署Prometheus+Grafana监控
Prometheus 1.不是很友好,各种配置都手写 2.对docker和k8s监控有成熟解决方案 Prometheus(普罗米修斯) 是一个最初在SoudCloud上构建的监控系统,开源项目,拥有非 ...
- cAdvisor+Prometheus+Grafana监控docker
cAdvisor+Prometheus+Grafana监控docker 一.cAdvisor(需要监控的主机都要安装) 官方地址:https://github.com/google/cadvisor ...
- prometheus+grafana监控redis
prometheus+grafana监控redis redis安装配置 https://www.cnblogs.com/autohome7390/p/6433956.html redis_export ...
随机推荐
- uint128_t 添加 c++ 重载类型强制转换
类型声明: class uint128 { public: uint128() :hi(), lo(){} uint128(uint32_t l) :hi(), lo(l){} uint128(int ...
- 【Python之路】特别篇--组合搜索功能实现
组合搜索: 根据特定标签内容,返回符合的数据. 效果图: 设计规划: 一.数据库表划分: 1.方向表,(运维自动化,Python开发,..) 2.分类表,(Python,Java,C#,.) 3.多对 ...
- linux系统编程--线程
安装线程man page,命令:sudo apt-get install manpages-posix-dev 线程概念 什么是线程 LWP:light weight process 轻量级的进程,本 ...
- x86—EFLAGS寄存器详解[转]
鉴于EFLAGS寄存器的重要性,所以将这一部分内容从处理器体系结构及寻址模式一文中单独抽出另成一文,这部分内容主要来自Intel Developer Mannual,在后续的内核系列中遇到的许多和EF ...
- 数据结构实验之链表二:逆序建立链表(SDUT 2117)
题目链接 #include <bits/stdc++.h> using namespace std; struct node { int data; struct node *next; ...
- mac使用php-version切换PHP版本
在开发过程中,有时候我们的程序对某个php版本有着极为重要的限制,特别是大型项目. 因此,我们就需要切换多个php版本来满足我们的需求. 我们使用php-version来达到这个目的. 首先我们先使用 ...
- dcokee 安装 nginx
1,docker pull openresty/openresty 2, mkdir /opt/local/openresty 等等文件夹 3, docker run --name=" ...
- HTML5调用本地摄像头画面,拍照,上传服务器
实现功能和适用业务 采集本地摄像头获取摄像头画面,拍照保存,上传服务器: 前端上传图片处理,展示,缩小,裁剪,上传服务器 实现步骤 调取本地摄像头(getUserMedia)/上传图片,将图片/视频显 ...
- Laravel 代码开发最佳实践
我们这里要讨论的并不是 Laravel 版的 SOLID 原则(想要了解更多 SOLID 原则细节查看这篇文章)亦或是设计模式,而是 Laravel 实际开发中容易被忽略的最佳实践. 内容概览 单一职 ...
- 操作系统 | 结合 CPU 理解一行 Java 代码是怎么执行的
根据冯·诺依曼思想,计算机采用二进制作为数制基础,必须包含:运算器.控制器.存储设备,以及输入输出设备,如下图所示. 我们先来分析 CPU 的工作原理,现代 CPU 芯片中大都集成了,控制单元,运算单 ...