
prometheus学习系列五: Prometheus配置文件
在prometheus监控系统,prometheus的职责是采集,查询和存储和推送报警到alertmanager。本文主要介绍下prometheus的配置文件。
全局配置文件简介
默认配置文件
[root@node00 prometheus]# cat prometheus.yml.default

# my global config

global:

  scrape_interval:     15s # Set the scrape interval to every 15 seconds. Default is every 1 minute.

  evaluation_interval: 15s # Evaluate rules every 15 seconds. The default is every 1 minute.

  # scrape_timeout is set to the global default (10s).

# Alertmanager configuration

alerting:

  alertmanagers:

  - static_configs:

    - targets:

      # - alertmanager:9093

# Load rules once and periodically evaluate them according to the global 'evaluation_interval'.

rule_files:

  # - "first_rules.yml"

  # - "second_rules.yml"

# A scrape configuration containing exactly one endpoint to scrape:

# Here it's Prometheus itself.

scrape_configs:

  # The job name is added as a label `job=<job_name>` to any timeseries scraped from this config.

  - job_name: 'prometheus'

    # metrics_path defaults to '/metrics'

    # scheme defaults to 'http'.

    static_configs:

    - targets: ['localhost:9090']
- global: 此片段指定的是prometheus的全局配置, 比如采集间隔,抓取超时时间等。
- rule_files: 此片段指定报警规则文件, prometheus根据这些规则信息,会推送报警信息到alertmanager中。
- scrape_configs: 此片段指定抓取配置,prometheus的数据采集通过此片段配置。
- alerting: 此片段指定报警配置, 这里主要是指定prometheus将报警规则推送到指定的alertmanager实例地址。
- remote_write: 指定后端的存储的写入api地址。
- remote_read: 指定后端的存储的读取api地址。
global片段主要参数
  # How frequently to scrape targets by default.

  [ scrape_interval: <duration> | default = 1m ]      # 抓取间隔

  # How long until a scrape request times out.

  [ scrape_timeout: <duration> | default = 10s ]     # 抓取超时时间

  # How frequently to evaluate rules.

  [ evaluation_interval: <duration> | default = 1m ]   # 评估规则间隔

  # The labels to add to any time series or alerts when communicating with

  # external systems (federation, remote storage, Alertmanager).

  external_labels:                                                  # 外部一些标签设置

    [ <labelname>: <labelvalue> ... ]
scrapy_config片段主要参数
一个scrape_config 片段指定一组目标和参数, 目标就是实例,指定采集的端点, 参数描述如何采集这些实例, 主要参数如下
- scrape_interval: 抓取间隔,默认继承global值。
- scrape_timeout: 抓取超时时间,默认继承global值。
- metric_path: 抓取路径, 默认是/metrics
- scheme: 指定采集使用的协议,http或者https。
- params: 指定url参数。
- basic_auth: 指定认证信息。
- *_sd_configs: 指定服务发现配置
- static_configs: 静态指定服务job。
- relabel_config: relabel设置。
static_configs样例
scrape_configs:

  # The job name is added as a label `job=<job_name>` to any timeseries scraped from this config.

  - job_name: 'prometheus'

    # metrics_path defaults to '/metrics'

    # scheme defaults to 'http'.

    static_configs:

    - targets: ['localhost:9090']

  - job_name: "node"

    static_configs:

    - targets:

      - "192.168.100.10:20001"
      - "192.168.100.11:20001
      - "192.168.100.12:20001"
file_sd_configs样例
scrape_configs:

  # The job name is added as a label `job=<job_name>` to any timeseries scraped from this config.

  - job_name: 'prometheus'

    # metrics_path defaults to '/metrics'

    # scheme defaults to 'http'.

    static_configs:

    - targets: ['localhost:9090']

  - job_name: "node"

    file_sd_configs:

    - refresh_interval: 1m

      files:

      - "/usr/local/prometheus/prometheus/conf/node*.yml"

# 独立文件配置如下

cat conf/node-dis.conf

- targets:

  - "192.168.100.10:20001"

  - "192.168.100.11:20001"

  - "192.168.100.12:20001"

或者可以这样配置

[root@node00 conf]# cat node-dis.yml

- targets:

  - "192.168.100.10:20001"

  labels:

    hostname: node00

- targets:

  - "192.168.100.11:20001"

  labels:

    hostname: node01

- targets:

  - "192.168.100.12:20001"

  labels:

    hostname: node02
通过file_fd_files 配置后我们可以在不重启prometheus的前提下, 修改对应的采集文件(node_dis.yml), 在特定的时间内(refresh_interval),prometheus会完成配置信息的载入工作。
consul_sd_file样例
由于consul的配置需要有consul的服务提供, 这里简单部署下consul的服务。
# 进入下载目录
[root@node00 prometheus]# cd /usr/src/
# 下载

[root@node00 src]# wget https://releases.hashicorp.com/consul/1.6.1/consul_1.6.1_linux_amd64.zip
# 解压

[root@node00 src]# unzip consul_1..1_linux_amd64.zip

Archive:  consul_1..1_linux_amd64.zip

  inflating: consul
# 查看

[root@node00 src]# ls

consul  consul_1..1_linux_amd64.zip  debug  kernels  node_exporter-0.18..linux-amd64.tar.gz  prometheus-2.12..linux-amd64.tar.gz
# 查看文件类型

[root@node00 src]# file consul

consul: ELF -bit LSB executable, x86-, version  (SYSV), statically linked, not stripped
# 防止到系统bin目录

[root@node00 src]# mv consul /usr/local/bin/
# 确保环境变量包含

[root@node00 src]# echo $PATH

/usr/local/sbin:/usr/local/bin:/usr/sbin:/usr/bin:/root/bin


# 运行测试

[root@node00 consul.d]# consul agent -dev
# 测试获取成员
[root@node00 ~]# consul members

# 创建配置目录

[root@node00 ~]#mkdir /etc/consul.d

[root@node00 consul.d]# cat prometheus-node.json

{
  "addresses": {
                        "http": "0.0.0.0",
                        "https": "0.0.0.0"
           },
  "services": [{
                "name": "prometheus-node",
                "tags": ["prometheus","node"],
                "port": 20001
             }]

}
# 指定配置文件运行
consul  agent -dev -config-dir=/etc/consul.d
打开web管理界面 192.169.100.10:8500,查看相应的服务信息。

上面我们可以看到有2个service , 其中prometheus-node是我们定义的service。
和prometheus集成样例:
scrape_configs:
  # The job name is added as a label `job=<job_name>` to any timeseries scraped from this config.
  - job_name: 'prometheus'

    # metrics_path defaults to '/metrics'
    # scheme defaults to 'http'.
    static_configs:
    - targets: ['localhost:9090']

  - job_name: "node"
    consul_sd_configs:
    - server: localhost:8500
      services:
      - prometheus-node
    #  tags:
    #  - prometheus
    #  - node
    #- refresh_interval: 1m
在prometheus的target界面上我们看到服务注册发现的结果。
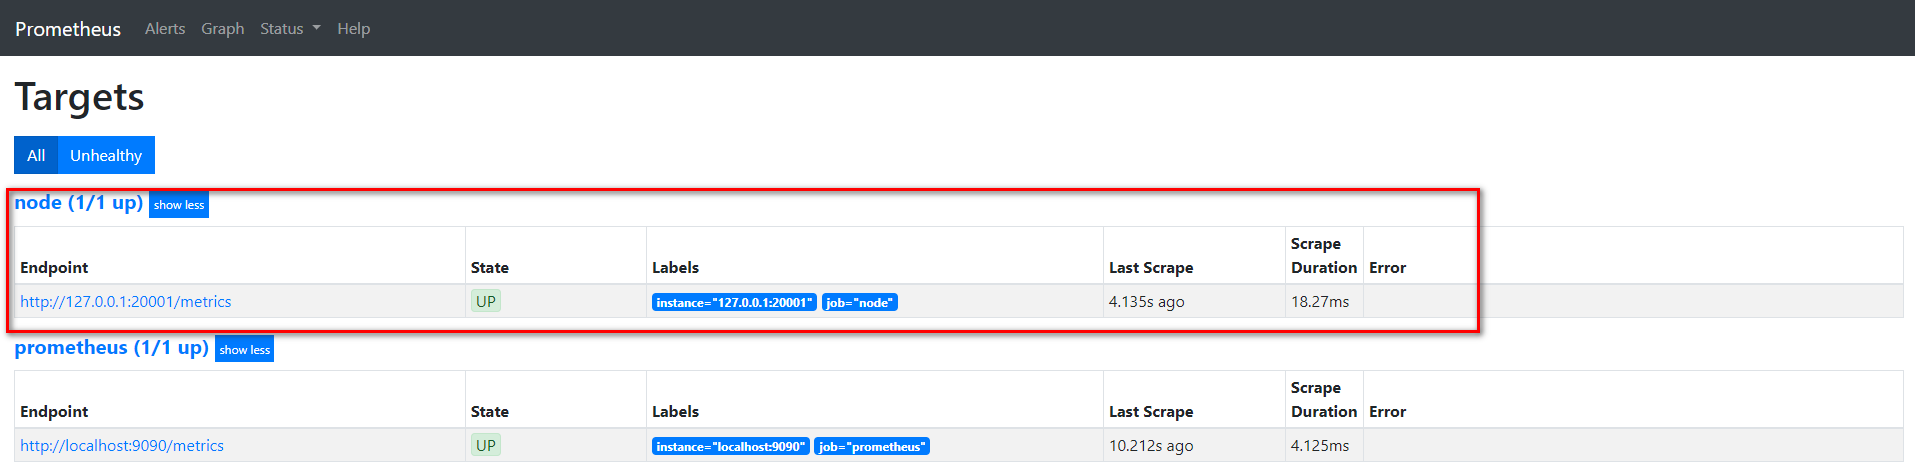
我们通过api接口给该service添加一个节点, 看看是否可以同步过来。
[root@node00 ~]# curl -XPUT -d@node01.json  127.0.0.1:8500/v1/catalog/register
true
[root@node00 ~]# cat node01.json
{
        "id":"0cc931ea-9a3a-a6ff-3ef5-e0c99371d77d",
        "Node": "node01",
        "Address": "192.168.100.11",
        "Service":
                {
                        "Port": 20001,
                        "ID": "prometheus-node",
                        "Service": "prometheus-node"
                }
}
在consul和prometheus中查看


可以发现通过向consul中特定服务加入节点, 就可以在prometheus动态变动采集的实例地址。
prometheus学习系列五: Prometheus配置文件的更多相关文章
- scrapy爬虫学习系列五:图片的抓取和下载
系列文章列表: scrapy爬虫学习系列一:scrapy爬虫环境的准备: http://www.cnblogs.com/zhaojiedi1992/p/zhaojiedi_python_00 ...
- Prometheus学习系列(五)之Prometheus 规则(rule)、模板配置说明
前言 本文来自Prometheus官网手册1.2.3.4和 Prometheus简介1.2.3.4 记录规则 一.配置规则 Prometheus支持两种类型的规则,这些规则可以定期配置,然后定期评估: ...
- Prometheus学习系列(六)之Prometheus 查询说明
前言 本文来自Prometheus官网手册和 Prometheus简介 Prothetheus查询 Prometheus提供一个函数式的表达式语言PromQL (Prometheus Query La ...
- Prometheus学习系列(二)之Prometheus FIRST STEPS
前言 本文来自Prometheus官网手册 和 Prometheus简介 说明 Prometheus是一个监控平台,通过在监控目标上的HTTP端点来收集受监控目标的指标.本指南将向您展示如何使用Pro ...
- Prometheus学习系列(九)之Prometheus 联盟、迁移
前言 本文来自Prometheus官网手册 和 Prometheus简介 FEDERATION 允许Prometheus服务器从另一台Prometheus服务器抓取选定的时间序列. 一,用例 联盟有不 ...
- prometheus学习系列九: Prometheus AlertManager使用
在Prometheus的报警系统中,是分为2个部分的, 规则是配置是在prometheus中的, prometheus组件完成报警推送给alertmanager的, alertmanager然后管理这 ...
- prometheus学习系列三:node_exporter安装部署
node_exporter简介 node_exporter安装部署 [root@node00 ~]# cd /usr/src/ [root@node00 src]# wget https://gith ...
- prometheus学习系列二: Prometheus安装
下载 在prometheus的官网的download页面,可以找到prometheus的下载二进制包. [root@node00 src]# cd /usr/src/ [root@node00 src ...
- Prometheus学习系列(一)之Prometheus简介
前言 本文来自Prometheus官网手册 和 Prometheus简介 什么是prometheus? Prometheus是一个最初在SoundCloud上构建的开源系统监视和警报工具包.自2012 ...
随机推荐
- Python——IO多路复用之select模块select方法
Python——IO多路复用之select模块select方法 使用select模块的select方法实现Python——IO多路复用 实现同时将终端输入的文本以及客户端传输的文本写入文本文件中: w ...
- Python3 异常
异常 --- 程序执行时产生的事件,为Python对象 <Python学习手册>笔记 异常总是通过实例对象来识别 默认的异常处理器 --- 打印标准出错信息(包括引发的异常和堆栈跟踪-异常 ...
- ISE 14.7安装教程最新版(Win10安装)
一.下载 第一步下载首先自己下载好四个压缩包,把第一个解压,其余的三个不用解压,然后去第一个解压后的文件夹打开启动程序. 第二步是点击启动程序后会有以下界面 next到下一个界面,这个时候需要把之前没 ...
- jedis代码操作
一.jedis快速入门 * Jedis: 一款java操作redis数据库的工具. * 使用步骤: 1. 下载jedis的jar包 2. 使用 //1. 获取连接 Jedis jedis = new ...
- ECMAScript6-2
1.模板字串.箭头函数 1.1.模板字串 传统js,输出模板 var str='<b>姓名:</b>'+ '<span>lxr</span>'; con ...
- xcode选项Build Active Architecture Only的作用
Build Active Architecture Only 设置: 设置为NO的时候,会导致react-native项目启动失败npx react-native run-ios 根据错误信息 bui ...
- es 内存占用优化
对6.3: 修改Elasticsearch中JVM配置文件jvm.options: Dlog4j2.enable.threadlocals=false 注: 本文主要针对ES 2.x. “该给ES分配 ...
- Linux内核device结构体分析
1.前言 Linux内核中的设备驱动模型,是建立在sysfs设备文件系统和kobject上的,由总线(bus).设备(device).驱动(driver)和类(class)所组成的关系结构,在底层,L ...
- Effective.Java第45-55条(规范相关)
45. 明智谨慎地使用Stream 46. 优先考虑流中无副作用的函数 47. 优先使用Collection而不是Stream作为方法的返回类型 48. 谨慎使用流并行 49. 检查参数有效 ...
- k8s-Annotation(注解)
k8s-Annotation(注解) Annotation与Label类似,也使用key/value键值对的形式进行定义. Label具有严格的命名规则,它定义的是Kubernetes对象的元数据(M ...